

Customer case study · Turfgrass
Satellite Turf Health Monitoring: A California Case Study
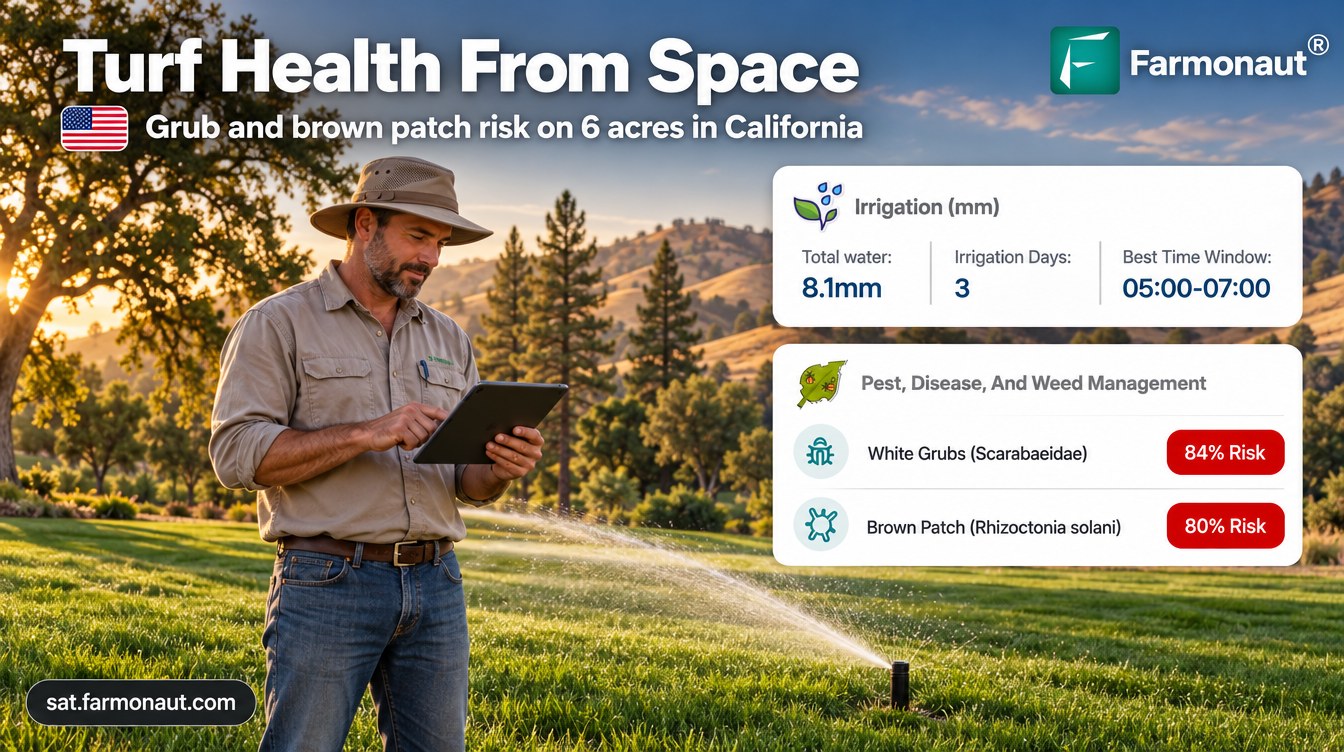
Satellite turf health monitoring tracked white grub and brown patch risk on about 6 acres of turf in California’s Sierra Nevada foothills, planned no water on 32% of days, and showed NDVI falling from about 0.5 in spring to 0.24–0.27 by October.
Key takeaways
- A managed turf site in the central Sierra Nevada foothills received 109 satellite advisories for two grass areas (about 5.8 acres) from March to October 2026.
- White grub risk averaged 76% to 84% every month from April to September and peaked at 96%; brown patch peaked at 95% in June.
- The plan left 123 of 380 area-days (32%) dry, about a third less water than a same-dose daily routine.
- Planned water matched the estimated cool-season turf need in June, about 6.3 inches, then eased as NDVI fell to 0.24–0.27.
- Every pest, disease and nutrient recommendation came with an organic option.
In this article
Satellite turf health monitoring gave a managed turf site in California’s Sierra Nevada foothills a fresh plan for each of its two grass areas every few days from spring to fall. Over the 2026 season the advisories scored white grub risk as high as 96% and brown patch risk as high as 95%, and they planned no water on 32% of days, which put the planned water about a third below a same-dose daily routine. NDVI, a satellite measure of green leaf, fell from about 0.5 in April to 0.24–0.27 by early October.
This case study walks through 109 advisories sent for about 6 acres of grass from March to October 2026. It shows what the satellite saw, what each advisory recommended, and how other turf and grounds managers can use the same data. All figures come from the client’s advisory records. Risk scores are modelled probabilities, not confirmed outbreaks, and the water figures are planned amounts, not metered use.
The turf site and the brief
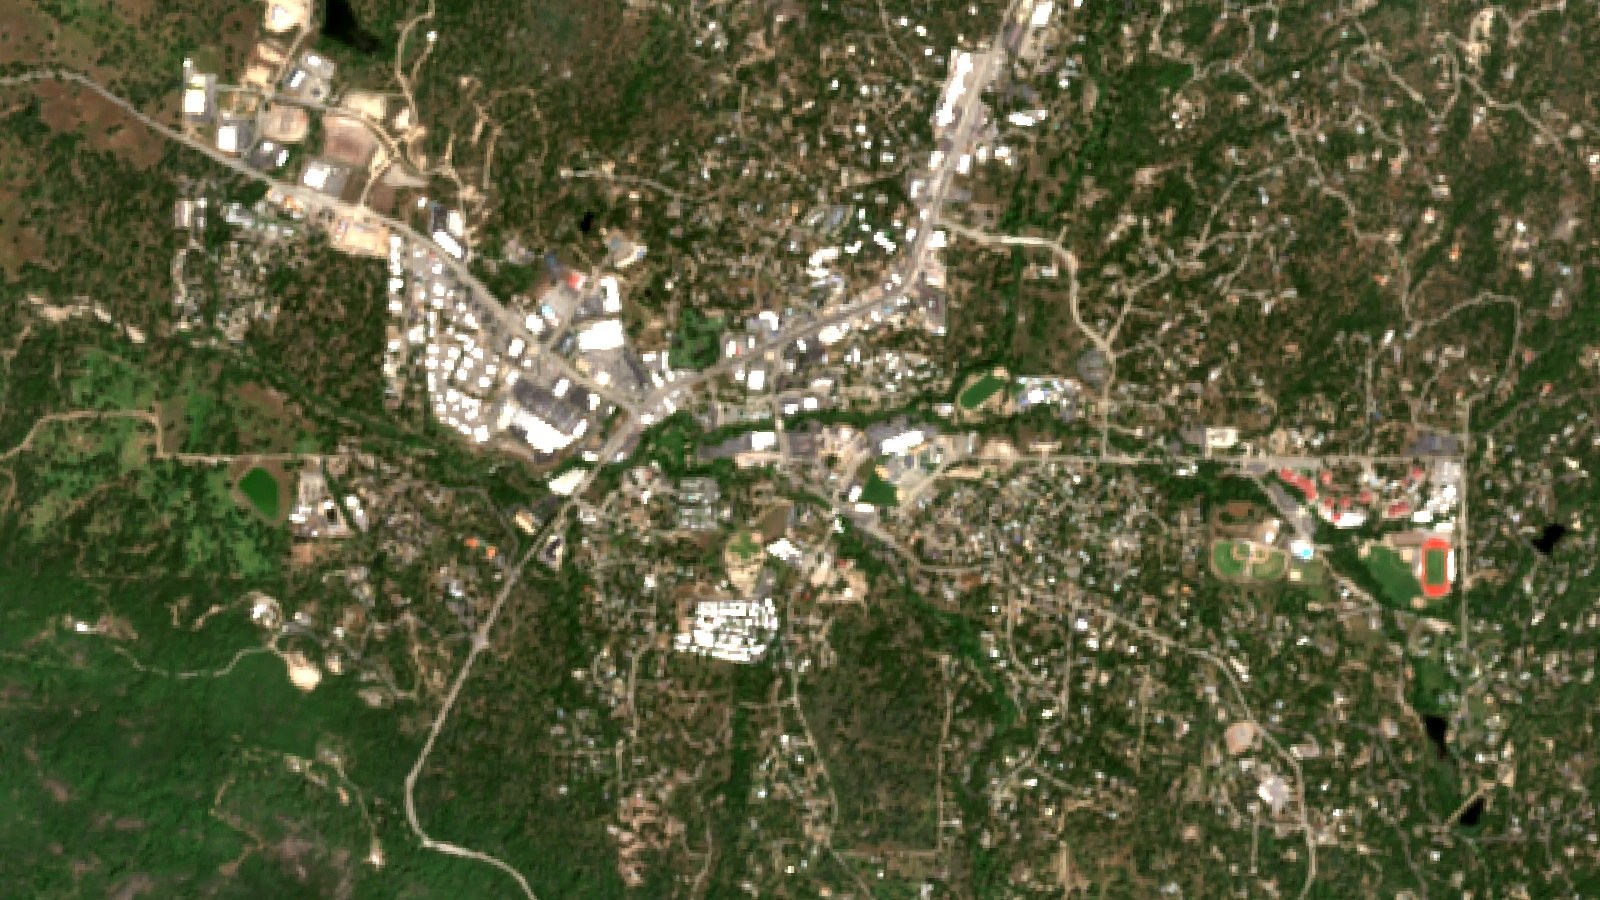
The client manages open grass areas on a property in the central Sierra Nevada foothills of California, set among oaks and pines. Two areas are monitored: one of about 4.1 acres (1.7 ha) and one of about 1.6 acres (0.7 ha), about 5.8 acres (2.3 ha) in total. Both were drawn once in the Farmonaut app at the end of March 2026, and advisories have arrived every few days since then.
Where the turf site is
California shaded; marker shows the approximate area only
Foothill grass has a hard summer. Winter and spring bring most of the year’s rain, then June to September is hot and almost dry. Turf that stays green through that stretch depends on sprinklers, and warm, wet turf is also where root-feeding grubs and summer patch diseases do well. The client wanted one place to see grass vigour, a sprinkler plan and pest and disease risk for each area without walking every corner first.
| Item | Detail |
|---|---|
| Region | Central Sierra Nevada foothills, California |
| Site | Managed turf, two grass areas |
| Total area | About 5.8 acres (2.3 ha) |
| Area sizes | About 4.1 and 1.6 acres |
| Irrigation | Sprinklers |
| Monitoring period | March to October 2026 |
| Advisories | 109 in total, 17 built from radar |
| Soil (modelled) | pH 6.4 to 6.8, low salinity, organic carbon rated low |
Why foothill turf needs a water plan
California’s Department of Water Resources splits the state into 18 reference evapotranspiration (ETo) zones. Most of the central Sierra foothills sit in zone 11, where the long-term ETo climbs from 3.10 inches in March to 8.06 inches in July, and totals 53.1 inches a year. ETo is the water a well-watered reference grass would use, so it is a direct guide to what a lawn needs.
Chart
Reference evapotranspiration by month, ETo zone 11
Long-term average inches per month, central Sierra Nevada zone, March to October
Turf does not need the full ETo figure. UC ANR’s Center for Landscape and Urban Horticulture gives cool-season turfgrasses such as tall fescue, ryegrass and Kentucky bluegrass an annual average crop coefficient of 0.80, and warm-season grasses such as bermudagrass 0.60. In July, the UC monthly value for cool-season turf is 0.94, so a cool-season lawn in zone 11 needs about 7.6 inches of water that month. With almost no summer rain, nearly all of it has to come from sprinklers.
How satellite turf health monitoring works
Each advisory starts with fresh satellite images of each grass area. The Sentinel-2 satellites carry a camera with a revisit time of five days with its two satellites and 10-metre detail in the visible and near-infrared bands. From these bands the system works out vegetation indices such as NDVI, which compares red and near-infrared light reflected by the land surface to show how much green leaf is present.
Infographic
How each turf advisory is built in 4 steps
- 1Satellite passSentinel-2 images each grass area every few days; Sentinel-1 radar covers cloudy dates.
- 2Read the canopyNDVI and moisture indices show green cover and wetness area by area.
- 3Add weather and seasonThe weather outlook and season set water need and pest and disease risk.
- 4Area planSprinkler plan, risk scores, nutrients with organic options, and a soil summary.
When cloud hides the site, the system switches to radar. Sentinel-1 radar can image the ground by day or night, whatever the weather, so 17 of the 109 advisories for this site were built from radar data.
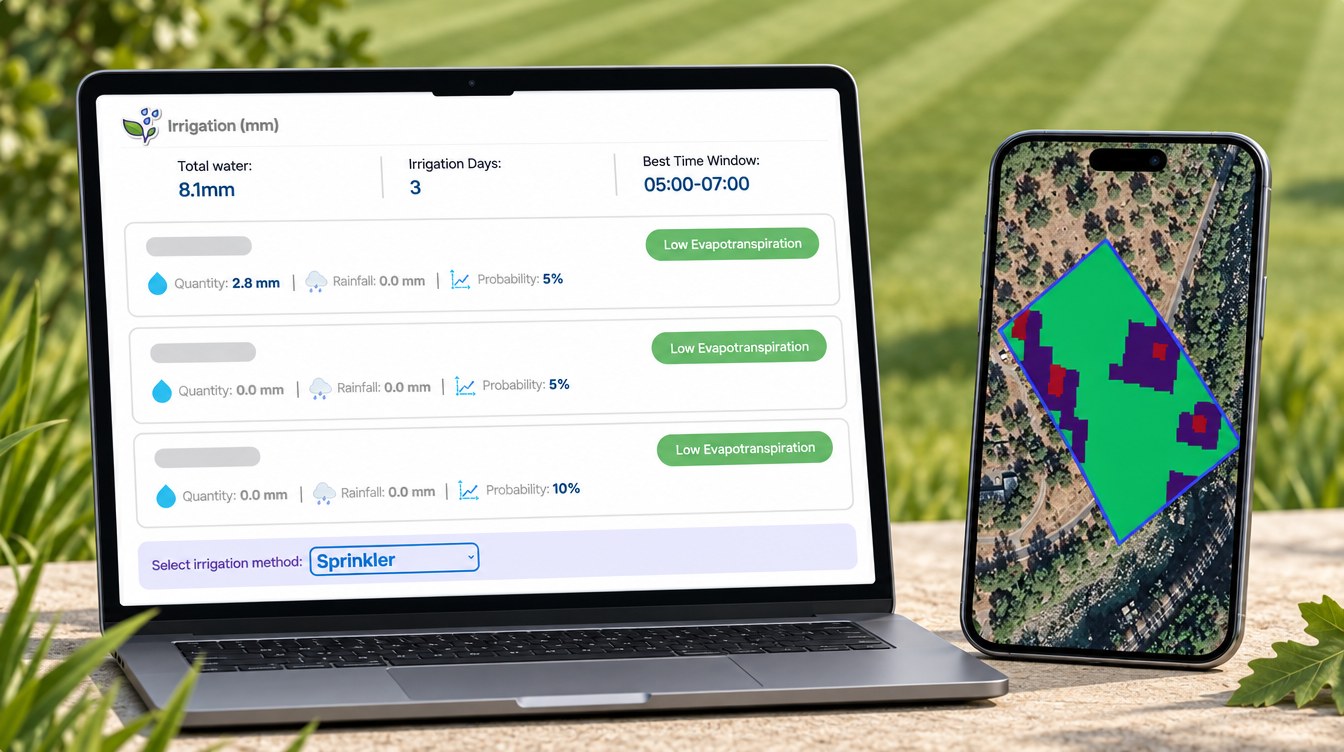
The images are combined with the weather outlook, the grass’s growth stage and its known water and nutrient needs. The result is one advisory per grass area with five parts: a sprinkler plan for the next week, pest and disease risk scores, weed risk, a fertilizer plan with organic options, and a soil summary.
▶ How satellite health maps show plant stress before you can see it · 4:09
The season in advisories
From the end of March to early October 2026, the two areas received 109 advisories, 46 for the larger area and 63 for the smaller one, including 17 built from radar images. The model labelled the grass with growth stages borrowed from forage grasses, such as heading or harvest. For a lawn, those labels are best read as seasons: spring green-up, early summer growth, then summer and fall maintenance with regular mowing.

▶ Why radar satellites can see grass and crops through cloud · 2:37
| Months | Season stage | What the advisories focused on |
|---|---|---|
| Apr | Spring green-up | Most nutrient advice, early grub and pythium watch |
| May | Active growth | Brown patch risk rising, water plan stepping up |
| Jun | Early summer peak | Highest planned water, brown patch and sod webworm risk at their peak |
| Jul | Midsummer | NDVI sliding, fertilizer mostly held back |
| Aug to Sep | Late-summer maintenance | Grub risk steady, cutworm scores in September, more dry days planned |
| Early Oct | Fall | Low NDVI, grub and brown patch risk still high |
NDVI tells the story of the summer. On the larger area, the monthly average fell from 0.52 in April to 0.45 in June and about 0.35 in July, then held near 0.32–0.35 in August and September. By 27 September it read 0.27. The smaller area followed a similar path, from 0.45 in April to 0.24 at the start of October. The advisory notes put the late reading slightly below the 0.30–0.50 range the model expects for grass at that stage, a cue to walk the area and check.
Chart
NDVI by month on the two turf areas
Monthly mean NDVI from optical advisories, April to September 2026
Brown patch and white grub risk through the season
The advisories scored the same few turf threats again and again. White grubs were scored 100 times, brown patch 95 times, dollar spot 80 times and sod webworms 74 times. Each score is a modelled probability built from the area’s canopy, moisture and weather data. It does not confirm a pest. It tells the manager where and when to look first.
Chart
Turf threats scored most often
Number of times each threat was scored, both areas, March to October 2026
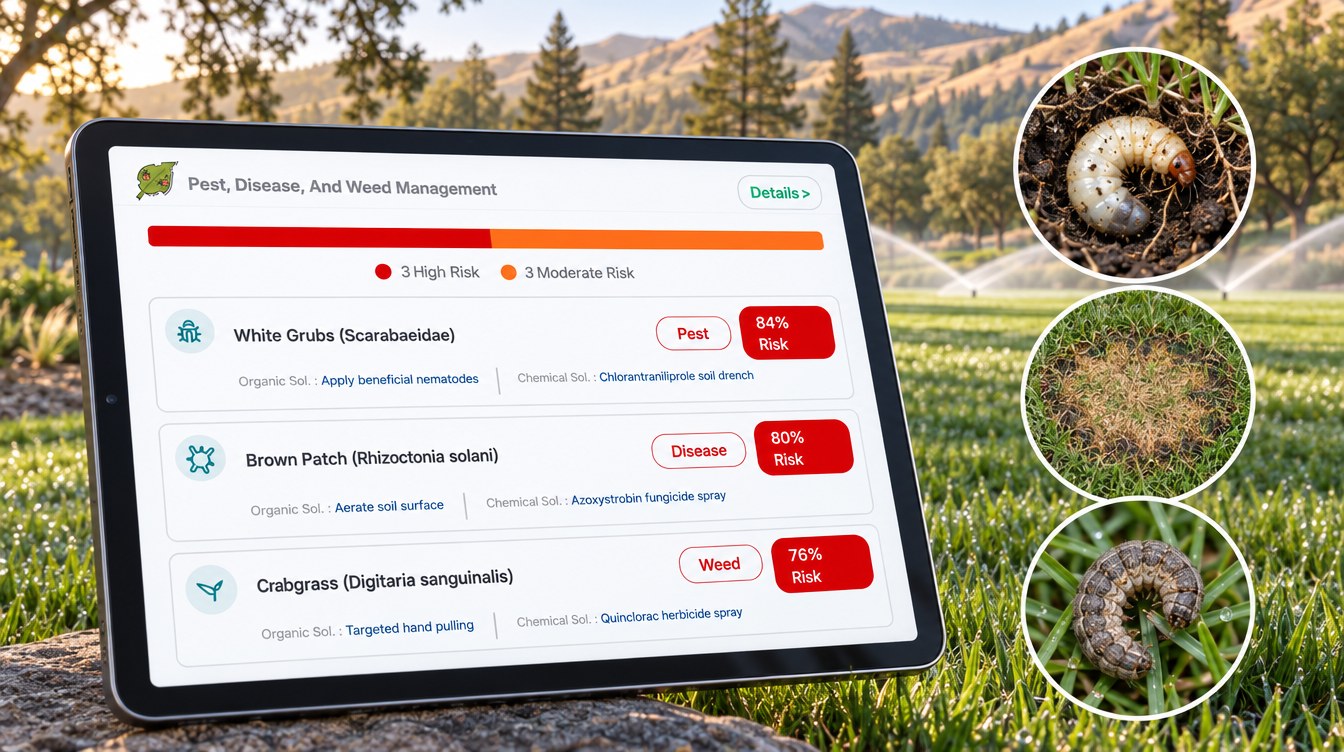
From April to September the monthly average scores moved with the heat. Brown patch and sod webworm scores rose to 88% in June. White grub scores stayed high all season, between 76% and 84% each month. Dollar spot scores were highest in spring and eased in late summer.
White grubs
White grub scores peaked at 96% on the larger area in early June and still read 84% in the October advisory. The UC IPM turfgrass guidelines describe masked chafer grubs as C-shaped larvae that feed on turf roots, causing irregular dead patches that look like drought stress and persist even where there is enough water. UC IPM adds that most damage shows up in late summer or early fall, and that in general turf up to six grubs per square foot can usually be tolerated. The advisory’s organic option was beneficial nematodes; UC IPM notes that Heterorhabditis bacteriophora nematodes can control masked chafers, while Steinernema carpocapsae do not. Always follow the product label and local rules.
Brown patch
Brown patch scores peaked at 95% on the larger area in June and read 80% in October. UC IPM says brown patch hits cool-season grasses in hot weather, and is common at 75°F to 95°F, with the best conditions for the fungus at 85°F to 90°F with high humidity or long leaf wetness. At the nearest NOAA normals station, the average July and August high is about 89°F. UC IPM’s advice is to irrigate in the pre-dawn or early morning hours so leaves dry quickly. When the advisories planned water, the sprinkler window almost always fell between 4:00 and 8:00 am, most often 5:00 to 7:00 am.
Sod webworms and cutworms
Sod webworm scores were highest in June. UC IPM suggests monitoring for them from June to early October and notes that damage is usually not noticeable in turf mowed above 2.5 inches. Cutworms were scored most often in September. UC IPM says cutworms and armyworms are active from mid-March to October, sets a threshold of five larvae per square yard, and advises irrigating to the turf’s evapotranspiration needs so wet, stressed patches do not attract egg-laying moths.
Dollar spot
Dollar spot scores averaged 72% in May and 56% in September. UC IPM notes the disease is most common in spring and fall in California, and that turf short of nitrogen tends to develop more of it.
Every one of the 436 pest and disease scores in the season came with an organic option as well as a conventional one. For a full list of cultural steps, see our guide to lawn disease control strategies.
Chart
Monthly average risk score for the top turf threats
Modelled probability, %, both areas, April to September 2026
Water: a third of days planned dry
The irrigation part of each advisory plans a sprinkler amount for each of the next several days. When advisories overlapped, we kept the newest plan for each area and day. That left 380 area-days of planned irrigation from 1 April to 9 October 2026. On 123 of them, or 32%, the advisory planned no water at all.
Chart
Rainfall vs planned sprinkler water by month
Inches per month; NOAA 1991–2020 normal rainfall vs advisory plan per area, 2026
The plan followed the heat. The planned amount averaged about 2.7 inches (69 mm) for April, 4.7 inches in May and 6.4 inches (161 mm) in June, the peak month, when only 2% of days were planned dry. It then eased to 4.7 inches in July, 3.1 inches in August and 2.1 inches in September, when half of all days were dry.
Local rainfall explains why the summer plan carried the load. At NOAA’s Yosemite Park Headquarters station, the nearest station with 1991–2020 normals, mean rainfall is 3.17 inches in April but under half an inch a month from June to September, and 36.55 inches a year. The station sits higher than the turf site, but its dry-summer pattern is typical of the foothills.
Planned water compared with a daily routine
To compare, we worked out what each area would have received if it had been given its own average sprinkler dose, about 0.19 inches (4.6 to 4.7 mm), every day. Against that same-dose routine, the advisory plan used 32% less water on both areas. Over the planning window, that is about 23.9 inches (607 mm) against 35.3 inches on the larger area, and 23.2 inches against 34.4 inches on the smaller one. This is a comparison of plans, not a metered saving.
The plan can also be read against the UC crop coefficients. If the grass is a cool-season type, its estimated need in zone 11 is about 6.3 inches in June, and the plan matched that almost exactly. From July the plan ran below the cool-season estimate, which lines up with the NDVI slide. That is how a manager can use the two numbers together: decide which areas should stay green and get the full amount, and which can be let go semi-dormant through the dry months.
Chart
Planned water vs estimated cool-season turf need
Inches per month, April to September 2026
Nutrition, soil and weeds
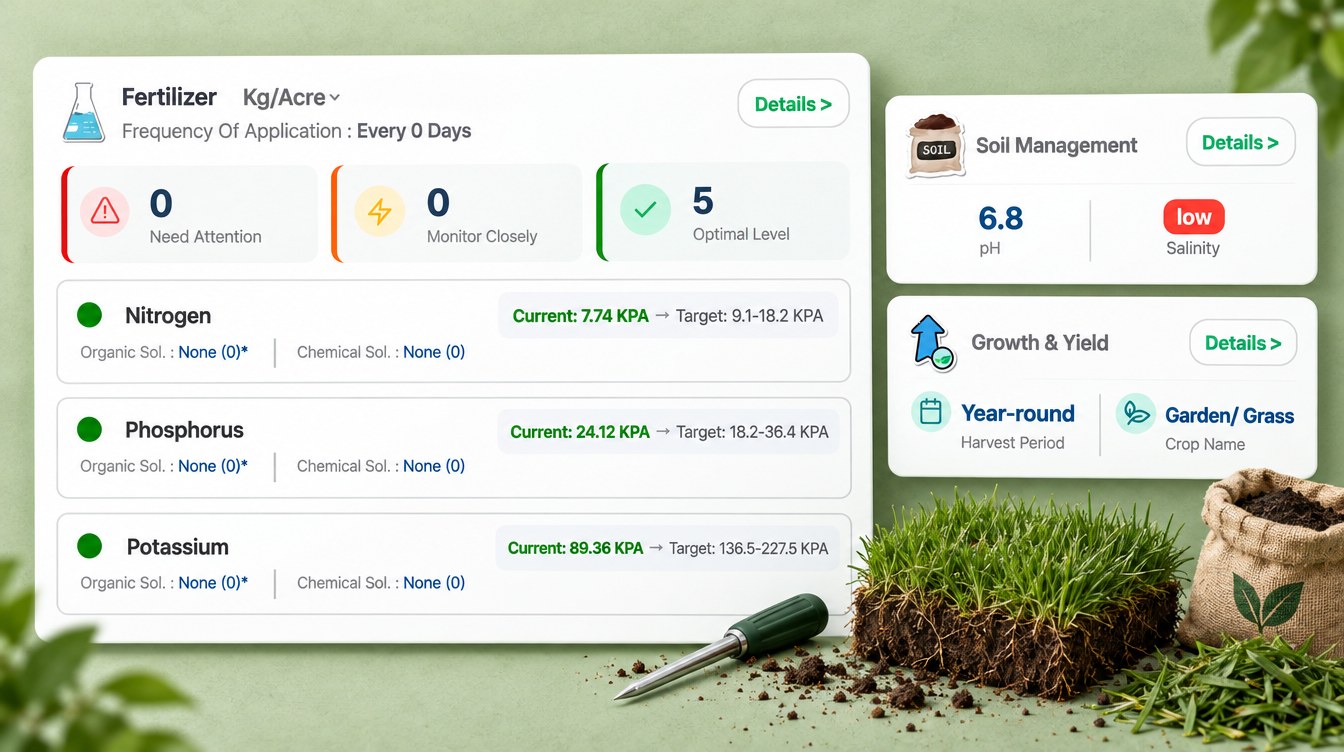
The fertilizer part of each advisory compares the area’s modelled nutrient levels with the ideal range for the stage, then gives a rate for each nutrient that is short. Over the season the advisories made 291 nutrient recommendations, mostly from March to June, and every one of them came with an organic source, such as blood meal for nitrogen, bone meal for phosphorus, kelp meal for potassium and compost for sulfur. From July most rates were set to zero, holding fertilizer back through the summer and early fall.
The soil section put both areas at pH 6.4 to 6.8 with low salinity, and rated soil organic carbon low in every advisory. That is why the soil advice leaned on topdressing with compost, which feeds the grass and builds organic matter at the same time.
Crabgrass appeared in every advisory, with an average score of 77%, followed by yellow nutsedge and annual bluegrass. Each weed came with a non-chemical option, such as corn gluten meal, hand pulling or close mowing, as well as a herbicide. Always follow the product label and local rules.
What other turf managers can take from it
Four lessons stand out from this season of data.
- Watch risk by season, not by calendar alone. Brown patch and sod webworm scores peaked in June, while white grub scores stayed high from spring to fall.
- Check the ground when NDVI drops. A fall from about 0.5 to 0.24–0.27 is the cue to dig a square foot of turf and count grubs, because grub damage looks like drought.
- Plan water around ETo. The plan peaked in June, left 32% of days dry and stayed about a third below a same-dose routine.
- Keep organic options on the table. Every pest, disease and nutrient recommendation came with an organic choice.
If you manage your own turf, the calculator below estimates a month’s water need for your grass from ETo and a crop coefficient, and what that water costs at your own price. You can then try the Farmonaut Satellite + AI Farm Monitoring System on your own grass areas.
Try the numbers for your own farm below.
Calculator
How much water does your turf need this month?
Enter your own turf area, the month’s ETo, a crop coefficient, expected rain and your water price.
- Water need: 5.60 in
- Water need in millimetres: 142 mm
- Gallons per acre: 152,062 gal/acre
- Cost of that water: $3,802
Example values only, not a benchmark or forecast. Kc 0.80 is the UC ANR annual average for cool-season turf (0.60 for warm-season turf; UC ANR, after Meyer et al. 1985). Find your month’s ETo in the DWR CIMIS zone tables or a nearby CIMIS station. 1 acre-inch of water is 27,154 gallons (43,560 sq ft x 1/12 ft x 7.48 gal per cubic foot, fixed in the formula). Sprinkler losses are not included.
FAQ
What is satellite turf health monitoring?
It uses regular satellite images of each turf area to track green cover, moisture and change over time. Farmonaut turns those images, plus weather data and the grass’s stage, into a plan for irrigation, nutrition and pest and disease risk for each area.
Can a satellite see white grubs or brown patch?
Not directly. A satellite sees changes in the grass canopy, not the grub or the fungus. The advisory combines canopy data with weather and the season to score the risk, and the manager confirms any problem on the ground.
Why did the turf’s NDVI fall to 0.24–0.27?
NDVI fell as the foothill summer got hot and dry and the plan eased below the cool-season estimate. Grub feeding can look the same, so the drop is a signal to check the turf, not a diagnosis.
How often does a turf site get a new advisory?
In this case study each area received an advisory about every five days, in line with the Sentinel-2 revisit time. Radar images filled in on 17 cloudy or low-quality dates.
How much water does cool-season turf need in the Sierra foothills?
Multiply the month’s ETo by the UC crop coefficient. In ETo zone 11, July ETo is 8.06 inches and the UC monthly coefficient for cool-season turf is 0.94, so the need is about 7.6 inches before rain. Use the calculator above with your own numbers.
Farmonaut turf monitoring
Get an area-by-area plan for your turf
Draw your grass areas once, and Farmonaut sends a satellite-based sprinkler, nutrient and pest-risk plan for each one every few days on web, Android or iOS.




Keep reading



Sources
- Farmonaut advisory records for a turf site in the central Sierra Nevada foothills, California (2026): sat.farmonaut.com
- ESA, Sentinel-2 facts and figures: esa.int
- Copernicus SentiWiki, Sentinel-1 mission: sentiwiki.copernicus.eu
- NASA Earth Observatory, Measuring vegetation (NDVI and EVI): science.nasa.gov
- California Department of Water Resources, CIMIS Reference Evapotranspiration Zones (1999 map, January 2012 edition): cimis-legacy.water.ca.gov
- UC ANR Center for Landscape and Urban Horticulture, Turfgrass crop coefficients (Kc): ucanr.edu
- UC IPM, Turfgrass: Masked chafers (white grubs): ipm.ucanr.edu
- UC IPM, Turfgrass: Rhizoctonia blight (brown patch, large patch, yellow patch): ipm.ucanr.edu
- UC IPM, Turfgrass: Sod webworms: ipm.ucanr.edu
- UC IPM, Turfgrass: Cutworms and armyworms: ipm.ucanr.edu
- UC IPM, Turfgrass: Dollar spot: ipm.ucanr.edu
- NOAA NCEI, U.S. Climate Normals 1991–2020, monthly normals for Yosemite Park Headquarters (USC00049855): ncei.noaa.gov
Discussion
Questions, corrections or field experience? Share them below. First-time comments are reviewed before they appear, and your email is never published.
No comments yet. Be the first to add a question or your experience.

 Mostas Tech
 AgroStar
 Native Seeds
 Andex
 FCF India
 Unifrutti Gulf
 Deluxe Conseil
 TVS Electronics
 BW Pipelines
 WICO
 Chimera Innovation
 SkyHarvest
 Polaris Digitech
 Teledarbas

 Licence holder · Niger · Gold










