

Lithium · Supply forecast
Global Lithium Production Forecast: Biggest Mines Ranked
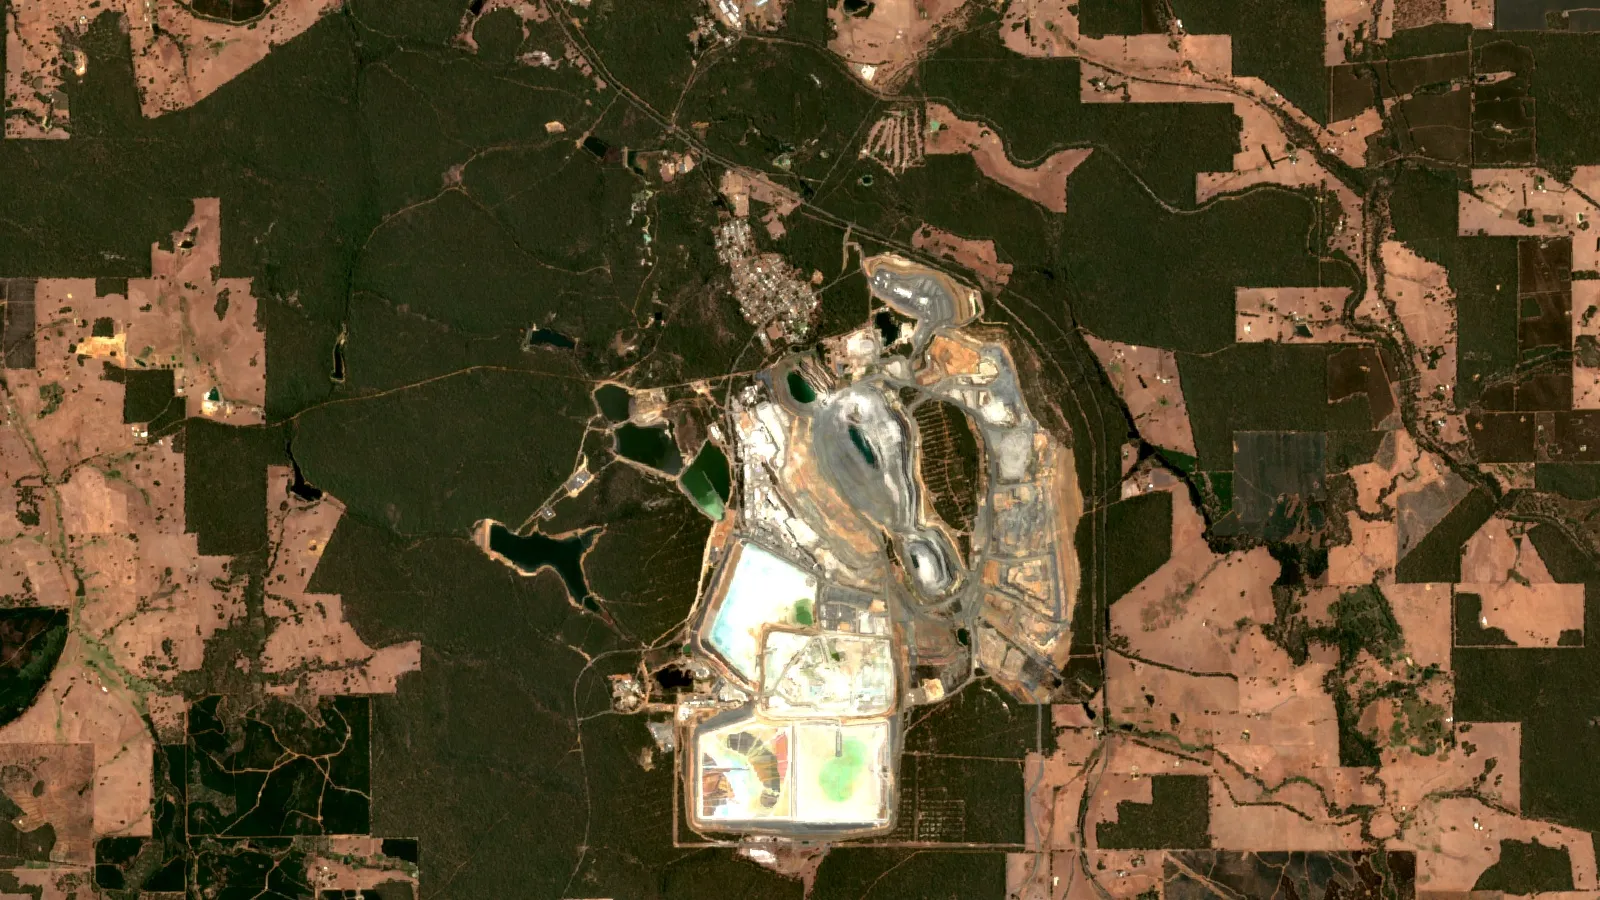
World lithium mine output rose to about 290,000 tonnes in 2025 (USGS) and is forecast to grow about 15% in 2026. Greenbushes is still the biggest lithium mine; here is who produces what, and who owns it.
Key takeaways
- World lithium mine production was about 290,000 t of contained lithium in 2025, up from 222,000 t in 2024 (USGS, 2026).
- GlobalData forecasts 389,100 t for 2026 and about 792,800 t by 2035 (Mining Technology, 2026).
- Greenbushes produced 1.41 Mt of spodumene concentrate in FY26, ahead of Pilgangoora at 879,543 t (IGO and PLS annual reports, 2026).
- Australia led 2025 output with about 92,000 t; Mali rose from 770 t to about 9,400 t (USGS, 2026).
- The IEA expects lithium supply to trail demand through 2035 on the current project pipeline (IEA, 2026).
In this article
- Global lithium production capacity forecast: the numbers
- Biggest lithium mines in the world, ranked by output
- Biggest lithium mine in the world: why Greenbushes still leads
- Biggest lithium companies and who owns what
- Lithium production by country: where the tonnes come from
- Lithium price and what it means for new capacity
- How to read a lithium supply forecast
- Frequently asked questions
World lithium mine output reached about 290,000 tonnes of contained lithium in 2025, up from 222,000 tonnes in 2024, according to the USGS Mineral Commodity Summaries 2026. For 2026, analysts at GlobalData expect a further rise of about 15%, led by new and expanding mines in Argentina, Australia, China, Mali and Zimbabwe. The single biggest lithium mine is still Greenbushes in Western Australia, which produced 1.41 million tonnes of spodumene concentrate in the year to June 2026.
This page sets out the supply forecast in numbers, ranks the biggest lithium mines by what they actually produced, and names the companies that own them. It is written for licence owners, consultants and investors who need to know where new tonnes are coming from and which projects carry the most weight.
Global lithium production capacity forecast: the numbers
Two measures are used in this market, and mixing them up causes most of the confusion in online forecasts. The USGS reports contained lithium (the weight of the element itself). Companies and price reporters often use lithium carbonate equivalent (LCE), the weight of lithium carbonate the same lithium would make. One tonne of lithium equals about 5.32 tonnes of LCE, so a “1.5 million tonne” LCE figure and a “290,000 tonne” lithium figure can describe a similar amount of metal.
Chart
World lithium output forecast
Thousand tonnes of contained lithium, GlobalData estimates
On the contained-lithium basis, the USGS estimates that world mine production rose by roughly 31% in 2025. The USGS does not publish a forward forecast. GlobalData, a commercial research firm, puts 2025 output higher, at 338,300 tonnes, and forecasts 389,100 tonnes for 2026 (published in Mining Technology, 2026). The gap between the two 2025 numbers comes from different coverage and estimation methods, so compare growth rates within one series rather than across them.
GlobalData’s longer view is a compound growth rate of 8.2% a year from 2026 to 2035, reaching about 792,800 tonnes by 2035. That is a forecast built on the current project pipeline. It assumes projects now under construction start on time, which has not always happened in this industry.
Which countries add the most new supply
- Australia: forecast to rise about 6% to 120,300 tonnes in 2026, helped by Kathleen Valley, which moved fully underground in December 2025 (GlobalData, 2026).
- China: forecast up about 17% to 68,500 tonnes, from new brine and hard-rock projects that started in 2025.
- Argentina: forecast up about 43% to 35,700 tonnes, as brine projects such as Mariana and 3Q ramp up.
- Zimbabwe: forecast at 41,900 tonnes, from 37,600 tonnes in 2025. The country exported 1.128 million tonnes of spodumene concentrate in 2025, up 11% on 2024, according to the Minerals Marketing Corporation of Zimbabwe as reported by Reuters.
- Mali: a new producer, forecast at 17,000 tonnes in 2026 from 11,300 tonnes in 2025, from the Goulamina and Bougouni mines.
Why capacity and production are not the same thing
Nameplate capacity is what a plant is built to produce. Production is what it actually ships. The gap widens when prices fall: several Australian mines were placed on care and maintenance in 2024 and 2025 when spodumene prices slumped, and some, such as Bald Hill, have since restarted. The IEA Global Critical Minerals Outlook 2026 reports that lithium companies cut investment by around 40% in 2025 and lithium exploration spending fell by about 45%. The same report says that, on the current project pipeline, lithium supply is expected to fall short of demand through 2035, although the gap has narrowed since its previous outlook.
Biggest lithium mines in the world, ranked by output
Ranking lithium mines is harder than ranking gold or copper mines, because hard-rock mines report tonnes of spodumene concentrate while brine operations report tonnes of lithium carbonate. The list below groups them by type and uses the latest figure each operator has published. Spodumene is the lithium-bearing mineral mined from hard-rock pegmatite deposits; it is crushed and concentrated to about 5.5-6% lithium oxide (Li2O) before it is shipped to a chemical plant.
How we chose
We included operating mines with a published annual output or nameplate capacity from the operator, a stock-exchange filing or a government body, dated 2025 or 2026. Mines on care and maintenance are noted but not ranked. Reserves alone do not earn a place: a large undeveloped deposit is not a big mine until it produces.
1. Greenbushes, Western Australia (hard rock)
Greenbushes produced 1.41 million tonnes of spodumene concentrate in the 2026 financial year (to 30 June), against 1.48 million tonnes a year earlier, according to IGO’s 2026 Annual Report. A fire in June 2026 took the new third chemical-grade plant (CGP3) offline for about seven weeks, which slowed its ramp-up. The mine is run by Talison Lithium, which is 51% held by Tianqi Lithium Energy Australia (a joint venture of Tianqi Lithium and IGO) and 49% by Albemarle. Best for: readers who want the benchmark for grade and cost; IGO reported a Greenbushes EBITDA margin of 73% for FY26.
2. Pilgangoora, Western Australia (hard rock)
PLS (formerly Pilbara Minerals) produced 879,543 dry metric tonnes of spodumene concentrate at Pilgangoora in FY26, above its guidance of 820,000-870,000 tonnes, according to the PLS 2026 Annual Report. PLS restarted its Ngungaju plant on 1 July 2026 and is studying a P2000 expansion to lift processing capacity to about 2 million tonnes a year, with a decision not yet made. Best for: the largest single-owner hard-rock operation listed in Australia.
3. Salar de Atacama, Chile (brine)
SQM pumps brine from the Salar de Atacama and turns it into lithium carbonate and hydroxide near Antofagasta. Under the partnership with state-owned Codelco, now run through the NovaAndino Litio joint venture, the plan is an extra 300,000 tonnes of LCE over 2025-2030 and 280,000-300,000 tonnes of LCE a year from 2031 to 2060, according to NovaAndino Litio. SQM manages the operation until 2030; Codelco takes over management from 2031. Best for: the largest brine source and the lowest-cost lithium in Chile.
4. Goulamina, Mali (hard rock)
Ganfeng Lithium’s Goulamina mine started production in December 2024. It has a capacity of about 506,000 tonnes of spodumene a year, and Ganfeng plans to double that to 1 million tonnes. The Malian government holds 35% and Ganfeng 65% (Investing News Network, May 2026). Best for: the clearest example of Africa’s new lithium supply.
5. Mount Holland, Western Australia (hard rock)
Mount Holland is run by Covalent Lithium, a 50/50 joint venture of SQM and Wesfarmers. Its Kwinana refinery made its first battery-grade lithium hydroxide in July 2025 and targets nameplate capacity of 50,000 tonnes a year by the end of 2026. Best for: a mine-to-hydroxide chain built outside China.
6. Caucharí-Olaroz, Argentina (brine)
Ganfeng (51%) and Lithium Argentina run Caucharí-Olaroz in Jujuy, with capacity of 40,000 tonnes of LCE a year. A Stage 2 plan would add another 45,000 tonnes. Nearby, Rio Tinto’s Olaroz and Fenix brine operations came with its purchase of Arcadium Lithium. Best for: tracking how quickly Argentina’s brine output can grow.
Other large operations to know
- Wodgina and Mount Marion (Western Australia): operated by Mineral Resources. POSCO agreed in November 2025 to take a 30% stake in a new joint venture holding Mineral Resources’ interests in both mines.
- Kathleen Valley (Western Australia): run by Liontown Resources; it became a fully underground mine in December 2025 (GlobalData, 2026).
- Zimbabwe’s hard-rock mines: Arcadia, Bikita, Kamativi and others that together exported 1.128 million tonnes of concentrate in 2025.
- Mount Cattlin (Western Australia): placed on care and maintenance by Rio Tinto in March 2025, so not ranked here.
For a ranking by reserves rather than output, see our guide to the biggest lithium mines by reserves. For the full country table, see lithium production by country.
Biggest lithium mine in the world: why Greenbushes still leads
Greenbushes leads on three counts: volume, grade and cost. It has been mined for more than a century, first for tin and tantalum and later for lithium. IGO’s CY25 Resource and Reserve statement (February 2026) reports updated Mineral Resource and Ore Reserve estimates as at 31 December 2025, as part of an ongoing review of the life-of-mine plan.
Chart
Greenbushes and Mali: output change
Greenbushes in Mt concentrate (FY25 to FY26); Mali in thousand t lithium (2024 to 2025)
A Mineral Resource is the part of a deposit with reasonable prospects of being mined; an Ore Reserve is the smaller part that a mine plan shows can be mined at a profit. Investors usually watch the reserve, because it sets mine life.
The site’s operating history is covered in more detail in our pages on the Greenbushes lithium operation and on Talison Lithium’s operations.
Biggest lithium companies and who owns what
Most large lithium mines are joint ventures, so the biggest companies often own slices of several assets. The list below is ordered by the scale of their lithium operations, not share price. It is facts only and not investment advice.
| Company | Listing (ticker) | Key lithium assets | Recent fact (source date) |
|---|---|---|---|
| Albemarle | NYSE: ALB | 49% of Talison (Greenbushes); Salar de Atacama brine; Wodgina interest | Headquartered in Charlotte, North Carolina; part-owner of the largest lithium mine |
| SQM | NYSE: SQM | Salar de Atacama (via NovaAndino Litio); 50% of Mount Holland | NovaAndino Litio formed December 2025 (INN, May 2026) |
| Tianqi Lithium | SZSE: 002466; HKEX: 9696 | 51% of Talison via its joint venture with IGO | Indirect majority owner of Greenbushes (INN, May 2026) |
| Ganfeng Lithium | SZSE: 002460; HKEX: 1772 | Goulamina (65%), Caucharí-Olaroz (51%), Mariana, 50% of Mount Marion | Mariana started February 2025 (INN, May 2026) |
| Rio Tinto | ASX, NYSE, LSE: RIO | Former Arcadium assets in Argentina; Rincon; 53.9% of Nemaska Lithium | Q1 2026 output 12,700 t LCE; target above 200,000 t LCE capacity by 2028 (INN, May 2026) |
| PLS | ASX: PLS | Pilgangoora | FY26 output 879,543 t concentrate (PLS, August 2026) |
| IGO | ASX: IGO | 24.99% indirect interest in Greenbushes | Greenbushes FY26 output 1.41 Mt (IGO, 2026) |
| Mineral Resources | ASX: MIN | Wodgina, Mount Marion, Bald Hill | POSCO 30% joint-venture deal, November 2025 (INN, May 2026) |
The largest lithium mining companies page has a longer list that includes developers.
Deals that changed the ranking
Rio Tinto completed its US$6.7 billion purchase of Arcadium Lithium in March 2025 and formed a Rio Tinto Lithium division. It also signed a joint venture with Codelco for the Maricunga project in Chile. In North America, Sayona Mining and Piedmont Lithium combined as Elevra Lithium in 2025. In October 2025 the US government took a 5% stake in Lithium Americas and its Thacker Pass project in Nevada; see our guide to lithium mines in Nevada.
Lithium production by country: where the tonnes come from
Australia remained the largest producer in 2025 with about 92,000 tonnes of contained lithium, followed by China (62,000 tonnes) and Chile (56,000 tonnes), according to the USGS (2026). Zimbabwe (28,000 tonnes) and Argentina (23,000 tonnes) were next. Mali jumped from 770 tonnes in 2024 to about 9,400 tonnes in 2025 as two new mines opened. The United States has one commercial brine operation in Nevada; the USGS withholds its output figure.
Chart
Lithium mine production by country, 2025
Thousand tonnes of contained lithium (estimates)
On reserves, Chile leads with 9.2 million tonnes, followed by Australia (8.4 million) and China (4.6 million). World reserves total about 37 million tonnes, and measured and indicated resources about 150 million tonnes (USGS, 2026). Batteries took an estimated 88% of lithium use worldwide.
Europe produces very little lithium today; Portugal mined about 380 tonnes in 2025. Projects in Germany, Serbia, Czechia and France are covered in our page on lithium mining in Europe.

▶ How satellite imagery is used to screen for lithium-bearing ground, with a Nigeria example · 10:49
Lithium price and what it means for new capacity
Price decides how much of the forecast actually gets built. The USGS gives an average battery-grade lithium carbonate price of about US$9,000 per tonne in 2025, down from US$63,700 in 2022. In China, lithium carbonate traded at 91,700 yuan per tonne on 5 November 2026, about 14% higher than a year earlier but down about 27% over the previous month, according to Trading Economics. The IEA notes that lithium prices more than doubled between early 2025 and April 2026 on demand from energy storage.
Chart
Battery-grade lithium carbonate price
Annual average, US$ per tonne (real)
The swing shows up in state accounts too: Western Australia’s lithium sales fell to A$4.3 billion in 2024-25, from A$8.5 billion in 2023-24 and a record A$21.5 billion in 2022-23, according to the WA Government Statistics Digest 2024-25. Higher prices bring idle capacity back first, because restarting a built plant is faster than building a new one. That is why Bald Hill and Ngungaju restarted before any new Australian mine was approved.
How to read a lithium supply forecast
- Check the unit. Contained lithium, LCE or spodumene concentrate tonnes. Convert before you compare.
- Check the basis. Mine output, chemical output or nameplate capacity are three different numbers.
- Check the date. A forecast made at a price peak usually overstates what gets built.
- Check the projects behind it. Ask which mines are under construction, which are funded and which are only studies.
- Check the owner’s own guidance. Company guidance in stock-exchange filings is the best near-term guide to a single mine.
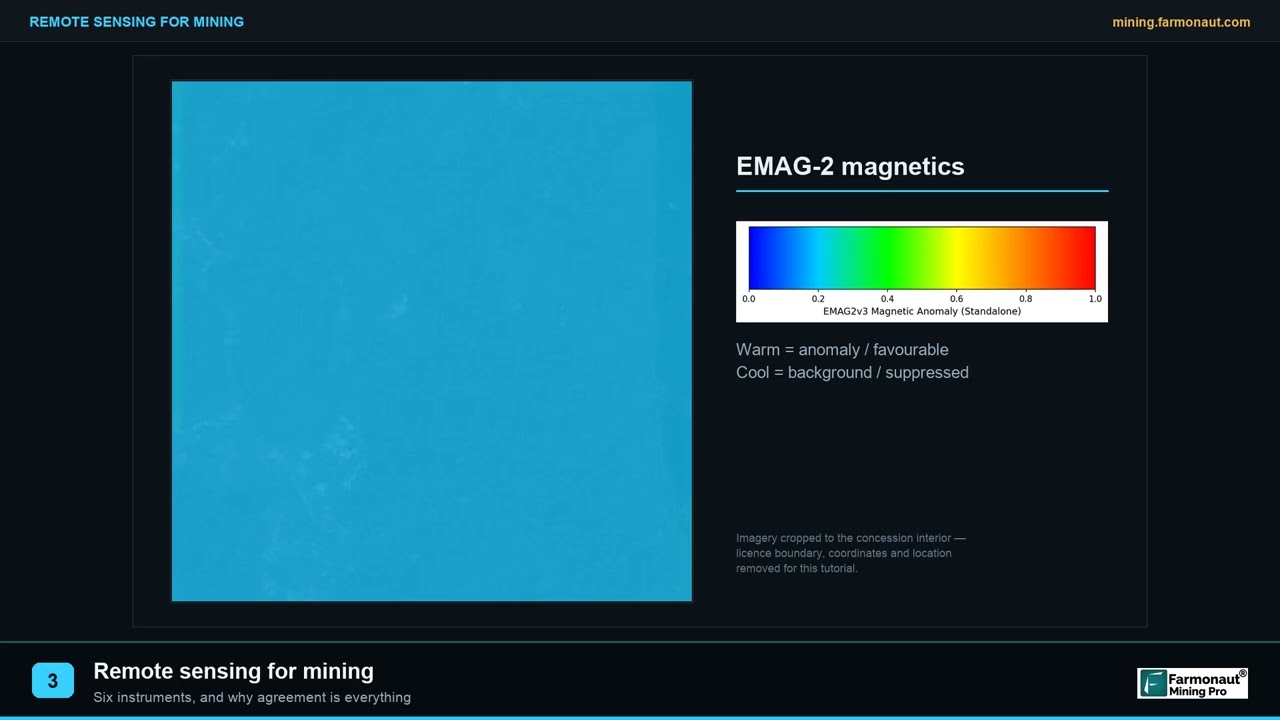
▶ Remote sensing for mining explained in plain terms · 2:01
For licence owners and consultants, the early step is the same everywhere: knowing whether ground has lithium-bearing pegmatites or brine before money is spent on drilling. Satellite imagery can help screen large areas for the rock types and alteration linked to pegmatites; Farmonaut’s satellite-based mineral detection service is one way to do this before field work. Questions about a specific area can go through the mining query form.
Calculator
How much lithium is in your spodumene concentrate?
Enter your own tonnes, grade, recovery and price.
- Contained lithium (before recovery), t: 278.7
- Gross value at your price, US$: $15,131,905
Example values only, not a benchmark. Conversion factors come from atomic weights: Li is 46.45% of Li2O by weight, and 1 t Li = 5.323 t lithium carbonate. Price is an input: example, use today’s price.
Frequently asked questions
What is the global lithium production forecast?
GlobalData forecasts 389,100 tonnes of contained lithium in 2026, up about 15%, and about 792,800 tonnes by 2035. The USGS put actual 2025 mine output at about 290,000 tonnes on its own basis.
What is the biggest lithium mine in the world?
Greenbushes in Western Australia. It produced 1.41 million tonnes of spodumene concentrate in the year to June 2026 (IGO).
Who owns the Greenbushes mine?
Talison Lithium operates it. Talison is 51% owned by Tianqi Lithium Energy Australia (Tianqi Lithium and IGO) and 49% by Albemarle.
What is the biggest lithium company?
By scale of lithium operations, Albemarle, SQM, Ganfeng Lithium, Tianqi Lithium and Rio Tinto are the leading groups. By market value, Rio Tinto is the largest company with lithium assets, but lithium is a small part of its business.
Which country produces the most lithium?
Australia, with about 92,000 tonnes of contained lithium in 2025, followed by China and Chile (USGS, 2026).
Who mines lithium in Africa?
Zimbabwe is Africa’s top producer, with mines such as Arcadia, Bikita and Kamativi. Mali’s Goulamina (Ganfeng) and Bougouni started output in late 2024 and ramped up in 2025 (USGS, 2026). Ghana’s Ewoyaa project is in development.
How much lithium is in spodumene concentrate?
Typical concentrate grades about 5.5-6% Li2O. At 6% Li2O, one tonne holds about 28 kilograms of lithium, or about 148 kilograms of LCE before processing losses.
Is there a lithium shortage coming?
The IEA’s 2026 outlook expects supply to trail demand through 2035 based on the current project pipeline, though the expected gap is smaller than in its previous outlook.
Where is Sigma Lithium’s mine?
Sigma Lithium operates the Grota do Cirilo hard-rock mine in Minas Gerais, Brazil. Brazil produced about 12,000 tonnes of lithium in 2025 (USGS, 2026).
What is lithium carbonate equivalent?
LCE is the weight of lithium carbonate that a given amount of lithium would make. One tonne of lithium equals about 5.32 tonnes of LCE.
More from Farmonaut: top 5 automation irrigation system automat drip solutions, contact us.
This page is for information only. It is not investment advice.
Farmonaut mining
Screen lithium ground from space
Licence owners can request a quote for a satellite screen of pegmatite and brine targets before drilling.
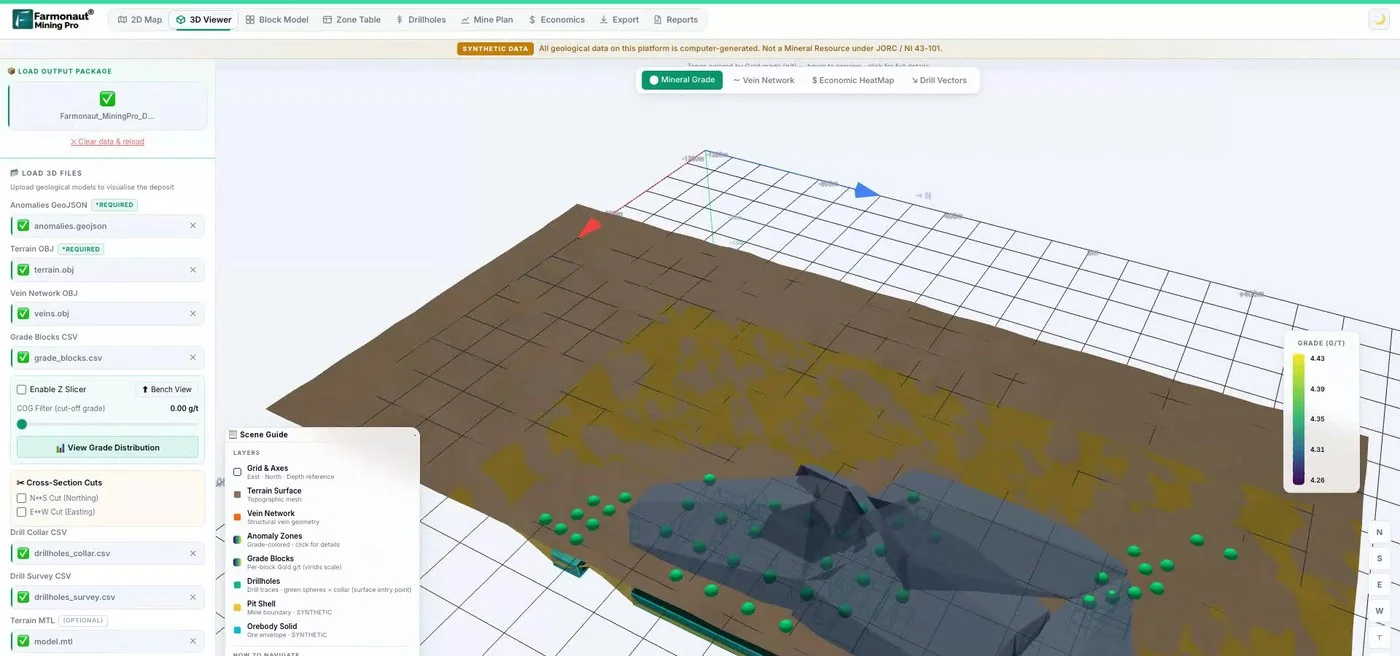
Mining Pro sample view, synthetic data
Keep reading
Sources
- USGS, Mineral Commodity Summaries 2026: Lithium: pubs.usgs.gov
- Mining Technology (GlobalData), Various project ramp-ups set to boost global lithium output (2026): mining-technology.com
- IEA, Global Critical Minerals Outlook 2026: Executive summary: iea.org
- IGO, 2026 Annual Report: igo.com.au
- IGO, Greenbushes CY25 Resource and Reserve Estimates (February 2026): igo.com.au
- PLS, 2026 Annual Report incorporating Appendix 4E: pls.com
- NovaAndino Litio, Codelco-SQM partnership: acuerdocodelcosqm.cl
- Investing News Network, 7 Biggest Lithium-mining Companies (May 2026): investingnews.com
- Reuters via MINING.COM, Zimbabwe spodumene exports up 11% in 2025 (February 2026): mining.com
- Trading Economics, Lithium carbonate price (November 2026): tradingeconomics.com
- Global Mining Review, Rio Tinto completes acquisition of Arcadium Lithium (March 2025): globalminingreview.com
- Government of Western Australia, Statistics Digest 2024-25: wa.gov.au
Discussion
Questions, corrections or field experience? Share them below. First-time comments are reviewed before they appear, and your email is never published.
No comments yet. Be the first to add a question or your experience.

 Alkimy SARL
 Double A Trading
 GemSprout Metals Limited
 Qader Group
 Ileys General Trading
 SG Gold Mining LLC
 VRV Global Pte Ltd
 Omsri International FZE
 G.I.T.T.
 Jaunita Erss Ltd
 Almosi SARL
 SRK Consulting
 Berks Gold Limited
 Mwerezi Minerals Company Limited
 Mining SARL
 SenGold Invest SAS
 Sean Mining Limited
 NTS Group (Pty) Ltd

 Client · Oregon, USA · Gold










