

Boddington gold-copper mine, Western Australia · Fact guide
Boddington Mine WA: Output, Reserves and Mine Life
Newmont’s Boddington mine made 565,000 oz of gold and 24,000 t of copper in 2025, down from 745,000 oz of gold in 2023. This guide gives reserves, costs, tailings limits and the mine-life approval, with charts and a calculator.
Key takeaways
- Newmont owns 100% of Boddington and produced 565,000 oz of gold and 24,000 t of copper there in 2025 (Newmont Form 10-K, 2025).
- Gold reserves were 10.2 million oz at 0.58 g/t on 31 December 2025, down 6% from 10.8 million oz a year earlier (Newmont 10-K).
- Gold output fell from 745,000 oz in 2023 to 565,000 oz in 2025 as the average milled grade dropped from 0.754 to 0.572 g/t.
- Approval runs to 2041; a five-year extension to 2046 and a second tailings dam are under assessment (WA EPA, assessment 2507; Newmont fact sheet).
- A December 2025 bushfire suspended operations; first-half 2026 gold was 271,000 oz against 273,000 oz a year earlier (Newmont Q2 2026 statistics).
In this article
- Boddington mine WA at a glance
- Where is the Boddington mine and who owns it
- Boddington mine history: closure and restart
- How much gold and copper does Boddington produce
- Boddington compared with Newmont's other Australian mines
- Ore grade, reserves and resources at Boddington
- How the Boddington plant turns rock into gold
- What it costs to run Boddington
- Tailings, leases and bushfire: what decides the mine life
- Environment, heritage and community at Boddington
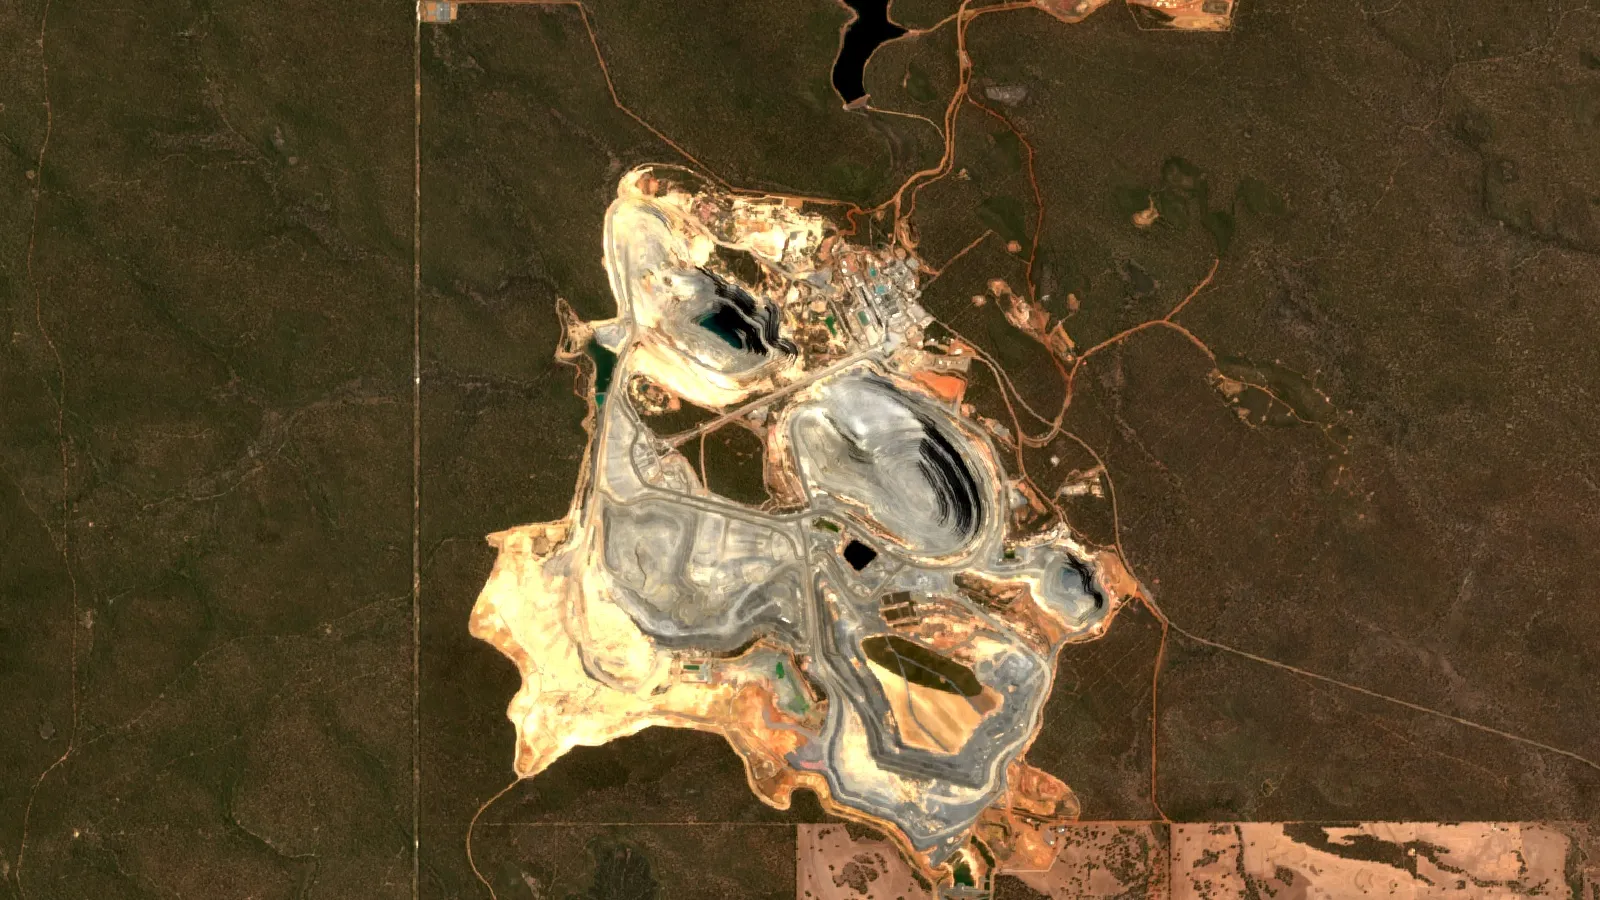
- Reading the Boddington belt from space
- Boddington gold output calculator
- Frequently asked questions
Boddington is a large open-pit gold and copper mine in Western Australia, about 130 km south-east of Perth, and Newmont owns all of it. It produced 565,000 ounces of gold and 24,000 tonnes of copper in 2025, down from 745,000 ounces of gold in 2023 (Newmont Form 10-K for 2025). Reserves stood at 10.2 million ounces of gold on 31 December 2025, and the state approval runs to 2041, with a five-year extension now under assessment. This page collects the figures from Newmont’s filings and the Western Australian regulator, so you can see what the mine makes, what it costs to run and what could change its life.
Boddington mine WA at a glance
The table gives the main facts. Every figure is from Newmont’s 2025 annual report on Form 10-K unless the row says otherwise. An ounce here is a troy ounce (31.1035 grams). Grade is shown in grams per tonne (g/t), which is the weight of gold in each tonne of rock.
| Item | Figure | Basis |
|---|---|---|
| Location | 130 km south-east of Perth, Western Australia | Newmont 10-K |
| Owner | Newmont, 100% | Since June 2009 |
| Mine type | Two adjacent open pits (North and South) | 10-K, 2025 |
| Gold produced | 565,000 oz | Year to 31 December 2025 |
| Copper produced | 24,000 tonnes (53 million lb) | Year to 31 December 2025 |
| Ore milled | 36.5 million tonnes at 0.572 g/t gold | Year to 31 December 2025 |
| Gold reserves | 10.2 million oz in 545 million tonnes at 0.58 g/t | 31 December 2025 |
| Copper reserves | 0.5 million tonnes at 0.09% copper | 31 December 2025 |
| Approved mine life | To 2041 (extension to 2046 proposed) | Newmont fact sheet; WA EPA |
Where is the Boddington mine and who owns it
The mine sits in the Peel region of Western Australia, roughly 130 km south-east of Perth and about 12 km north-west of the town of Boddington, according to the Western Australian Environmental Protection Authority (EPA) (EPA Western Australia, assessment 2507). The mine is reached mainly by paved road. Its coordinates are about 32.75 degrees south, 116.35 degrees east, in the Saddleback greenstone belt, an Archaean (more than 2.5 billion years old) rock belt in the south-western Yilgarn craton (Wikipedia, Boddington gold mine).
Newmont has owned 100% since June 2009, when it bought the last 33.33% interest from AngloGold Ashanti Australia. The land is a mix of tenure types. The project area has 52,065 acres (21,070 hectares) of mining leases from the State of Western Australia, and 26,910 acres (10,890 hectares) of that is subleased from the Worsley joint venture, which mines bauxite next door. Newmont also owns 74,474 acres (30,139 hectares) of freehold farmland, and most of the working area is on that freehold land. The state charges royalties of 2.5% of revenue on gold and 5% on copper. A cross-operation agreement gives the bauxite operations priority over the gold mine, so Newmont must take reasonable steps to conserve bauxite, including stockpiling it for the Worsley partners.
Boddington mine history: closure and restart
Mining began in 1987 and stopped on 30 November 2001, after the near-surface oxide ore had been processed (Wikipedia). A bedrock resource of almost 20 million ounces was identified, and an expansion to treat it was approved in 2002. Newmont took control of the project as it bought out its partners, taking Normandy’s share in 2002 and Newcrest’s in 2005, and finally AngloGold’s in 2009. The rebuilt plant started up on 23 July 2009 and was officially opened on 3 February 2010.
After the restart the mine works on scale. Its reserve grade of 0.58 g/t is about one-ninth of the 5.03 g/t reserve grade reported for Tanami in the same filing, so Boddington depends on moving and milling very large tonnages of rock.
How much gold and copper does Boddington produce
Output has fallen for two years. Gold production was 745,000 ounces in 2023, 590,000 in 2024 and 565,000 in 2025 (Newmont 10-K). Copper fell faster, from 98 million pounds in 2023 to 83 million in 2024 and 53 million in 2025 (24,000 tonnes). Newmont attributes the 2025 drop in other metals to a lower ore grade milled. The average gold grade milled slipped from 0.754 g/t in 2023 to 0.623 in 2024 and 0.572 in 2025, while the mill treated a similar 34.9 to 36.5 million tonnes a year. Because the mill tonnage was steady, the fall in ounces follows the fall in grade.
Chart
Boddington gold production by year
Thousand troy ounces produced, 100% Newmont
A bushfire that began in mid-December 2025 temporarily suspended operations and damaged parts of the site’s water supply infrastructure, although major infrastructure stayed safe (Newmont 10-K). The mine produced 111,000 ounces in the first quarter of 2026 and 160,000 in the second, a total of 271,000 ounces for the half-year against 273,000 a year earlier (Newmont Q2 2026 operating statistics). Newmont expects stronger output from Boddington in the second half of 2026 and kept its company-wide guidance of about 5.26 million attributable ounces (Kitco, 23 July 2026).
For scale, Australia’s gold mine output was estimated at 280 tonnes in 2025 (USGS Mineral Commodity Summaries, 2026). Boddington’s 565,000 ounces is about 17.6 tonnes, or roughly 6% of that national figure. The two numbers come from different reporters and years, so treat the share as a rough guide.
Boddington compared with Newmont’s other Australian mines
Newmont runs three gold operations in Australia: Boddington, Tanami in the Northern Territory and Cadia in New South Wales. In 2025 Boddington made more gold than either of the others, but at a much lower grade. Tanami is underground and averaged 5.189 g/t in the mill, and Cadia is an underground gold-copper mine averaging 0.524 g/t gold. Boddington averaged 0.572 g/t. The comparison shows why Boddington is a volume business: it moved 79.2 million tonnes of rock in 2025 and milled 36.5 million tonnes, against 2.3 million tonnes mined at Tanami. For how mine costs, grades and margins differ between gold and copper operations, see Gold vs Copper Mining: Costs, Grades and Margins.
Chart
Newmont’s Australian gold operations, 2025
Thousand troy ounces of gold produced in 2025
For a closer look at a related question, see our guide: Cripple Creek Gold Mine: Output, Reserves, Costs.
Ore grade, reserves and resources at Boddington
A mineral reserve is the part of a deposit that can be mined at a profit with current methods and prices. A resource is a wider estimate with less certainty about economics. At 31 December 2025 Newmont reported 10.2 million ounces of gold reserves at Boddington, in 545.1 million tonnes at 0.58 g/t, with a planned metallurgical recovery of 85%. That is 6% lower than the 10.8 million ounces reported a year earlier, which Newmont attributes to depletion (mining out the ore) and negative technical revisions. Copper reserves were 0.5 million tonnes in both years, at a grade of 0.09% copper and 81% recovery.
Chart
Boddington gold reserves and resources
Million troy ounces, Newmont share (100%)
Gold resources, which are counted separately from reserves in the filing, were 4.4 million ounces in 2025 against 4.3 million in 2024, and copper resources were 0.3 million tonnes in both years. Of the reserve, 5.4 million ounces are proven (the best-defined category) and 4.9 million ounces are probable. About 0.9 million ounces sit in stockpiles. Newmont says brownfield exploration, meaning drilling near the existing pits, is continuing to look for new reserves. A simple division of reserves by 2025 output gives about 18 years, but that is arithmetic, not a forecast, because grade, price and permits all move.
How the Boddington plant turns rock into gold
The plant combines two recovery methods because the ore holds gold and copper. Trucks bring ore from the North and South pits to a three-stage crushing plant. Newmont reports two primary crushers, six secondary crushers and four high-pressure grinding rolls, followed by four ball mills that grind the rock to powder. A flotation circuit then makes a gold-copper concentrate, which is sold. The remaining material goes to a carbon-in-leach (CIL) circuit, where cyanide dissolves the gold and carbon grains catch it. The gold is then stripped and poured as doré, an unrefined gold-silver bar, which a refinery finishes. Newmont reports a fleet of 41 autonomous haul trucks, two electric shovels and three excavators, with capacity to move roughly 200,000 to 250,000 tonnes of material per day. Power comes from the grid under a long-term contract with Bluewaters Power that runs to 2031 with an option to extend. For how autonomous haulage is changing other mines, see how autonomous vehicles are changing mining.
Infographic
From pit to gold bar in 5 steps
- 1MineTrucks haul ore and waste from the North and South open pits.
- 2Crush and grindCrushers and high-pressure grinding rolls feed four ball mills.
- 3FloatFlotation makes a gold-copper concentrate for sale.
- 4LeachCarbon-in-leach dissolves and captures the remaining gold.
- 5PourGold is poured as doré and sent to a refinery.
▶ Follows gold from rock through drilling, crushing, leaching on carbon, melting and refining. · 5:27
What it costs to run Boddington
Newmont reports two cost measures per ounce of gold sold. Costs applicable to sales (CAS) cover mining, processing and site overheads. All-in sustaining cost (AISC) adds sustaining capital, exploration at the site and other costs that keep a mine running. Both figures here are for Boddington gold on a co-product basis, meaning copper is treated as its own product and carries its own share of the costs. At Boddington CAS rose from $847 an ounce in 2023 to $1,244 in 2025, and AISC rose from $1,067 to $1,514 (Newmont 10-K).
Chart
Boddington gold costs per ounce sold
US$ per ounce, co-product basis
The costs matter because of the gap with the gold price. In the second quarter of 2026 Boddington’s co-product gold AISC was $1,622 an ounce, against $1,422 in the same quarter a year earlier (Newmont Q2 2026 operating statistics). Newmont’s company-wide gold AISC was $1,621 an ounce in the same quarter on a by-product basis, a different method, so the two figures should not be compared line by line (Kitco). The page does not give a gold price because prices change daily; use a live source such as the LBMA or Kitco and enter it in the calculator below.
Tailings, leases and bushfire: what decides the mine life
Three practical limits shape how long Boddington can run. The first is tailings, the finely ground waste left after processing. Newmont’s 10-K says the current tailings facility is expected to reach its permitted capacity in 2026, and the company decided to raise the F1/F3 residue disposal area (RDA) from 600 million to 750 million tonnes, which would give storage to 2029, subject to approvals. Beyond 2029 a new facility, RDA2, must be built on the Saddleback Treefarm area north-east of the current one. The fact sheet gives 2029 as the date the current facility fills up, so RDA2 has to be working by then.
The second is approval. The 2014 approvals set a permitted life to 2041. Newmont has asked to add footprint for RDA2 and other works, which would increase native vegetation clearing by 528 hectares to 5,963 hectares and total disturbance by 1,560 hectares to 8,483 hectares, and to extend the mine life by five years to 2046. The EPA decided to assess the proposal at the level of a Public Environmental Review and approved the scoping document on 28 October 2025 (EPA Western Australia, assessment 2507). The proposal also covers possible discharge of treated water to the Hotham River in years with excess water; Boddington has never discharged water before. The EPA page, last updated on 28 October 2025, shows the proposal at the scoping stage, so the extension is still a proposal.
The third is tenure and climate. The mining leases are in their third term and renewal is at the discretion of the State; the 10-K gives lease expiry dates between 2027 and 2046 and notes that the lease renewals and extra leases for tailings need agreement with third parties. The filing also lists drought in south-west Australia and heavy rain as risks to raw water supply and productivity. For more on how site data supports this kind of planning, see how data is used in gold mines and the main gold mining KPIs.
Environment, heritage and community at Boddington
The mine and its tailings plans sit on land that is under the custodianship of Aboriginal people, and Newmont has agreements with the Traditional Owner groups for Boddington. The EPA referral for RDA2 covers flora and vegetation, terrestrial fauna, inland waters, greenhouse gas emissions and social surroundings as the main environmental factors, and it includes studies on black cockatoo habitat and aquatic fauna in the nearby creeks and the Hotham River. Western Australia’s Aboriginal Cultural Heritage Act 2021 came into force in 2023 but was repealed later that year, and an amended Aboriginal Heritage Act 1972 applies again; the 10-K notes the announced repeal (Newmont 10-K).
Newmont’s 2025 sustainability report says cultural heritage surveys and workshops were held on the proposed second tailings site, and that over 950 Newmont employees at Boddington took part in one of 45 face-to-face cultural awareness training sessions (Newmont 2025 Sustainability Report). Boddington also took part in a mining-association sustainability self-assessment under the Minerals Council of Australia protocols. For water, land rehabilitation and emissions figures at Boddington, read the EPA assessment documents and Newmont’s annual reports directly, because those are the sources that carry audited or regulator-reviewed numbers. For a plain-language overview of mining’s effects on land, water and communities, the video below explains the seven main impacts.
▶ A plain-language claymation on the seven environmental impacts of mining. · 2:31
Reading the Boddington belt from space
A satellite cannot see gold, but it can map the rock and soil patterns that gold systems leave behind: iron-oxide staining, clay minerals and faults. Boddington is a good place to see why this is hard. The mine sits mainly on freehold land with some operations extending into State Forest (Newmont fact sheet), and the ore is low-grade gold in diorite-hosted rock, so surface clues are subtle. Public Sentinel-2 images (10 m pixels) show the pits, tailings facilities and cleared land well, and they let anyone track the footprint change from year to year. They do not show grade. Grade comes from drilling.
That is where exploration screening helps. Farmonaut turns a licence boundary into a satellite-based map of alteration and structure, which marks exploration targets ahead of any resource estimate and does not replace drilling or a formal resource report. If you hold ground in a greenstone belt and want to know where to drill first, you can start a request on the satellite mineral detection page or send details through the mining query form, or contact the team.
▶ Explains that satellites map the alteration halo around gold systems, not the gold itself. · 2:00
Boddington gold output calculator
Use the calculator below to test how mill tonnage, grade and recovery set the ounces from a mine like Boddington, and what a given price and cost do to the margin. The default numbers are the 2025 milled tonnes, grade and recovery from the 10-K and a round example price and cost, so they give about the reported ounces. The price is an example; enter today’s price.
Calculator
How many ounces and how much margin from a mine like Boddington?
Enter your own mill tonnes, grade, recovery, price and cost.
- Gold revenue at your price (US$): $1,711,669,105
- Sustaining cost at your AISC (US$): $855,834,552
- Margin before tax and royalties (US$): $855,834,552
Defaults are the 2025 milled tonnes (36.5 million) and milled grade (0.572 g/t) from Newmont’s 10-K, plus an 85% recovery, and round example numbers for price and cost. They are examples, not a forecast or a guide to profit. Prices are inputs: example, use today’s price. Margin ignores tax, royalties of 2.5% on gold, interest and copper income.
Frequently asked questions
Where is the Boddington mine in Western Australia
It is about 130 km south-east of Perth and about 12 km north-west of the town of Boddington, in the Peel region (EPA Western Australia).
Who owns the Boddington gold mine
Newmont owns 100% and has done since June 2009, when it bought AngloGold Ashanti Australia’s 33.33% interest. The mining leases are leased from the State of Western Australia, and part is subleased from the Worsley joint venture, which holds the bauxite rights.
How much gold does Boddington produce each year
It produced 565,000 ounces in 2025, 590,000 in 2024 and 745,000 in 2023 (Newmont 10-K). In the first half of 2026 it produced 271,000 ounces.
Does Boddington produce copper as well as gold
Yes. It produced 24,000 tonnes (53 million pounds) of copper in 2025. Newmont treats copper as a co-product at Boddington, together with Cadia, Red Chris and Peñasquito, because it makes up a large enough share of expected sales value.
Is Boddington the biggest gold mine in Australia
Newmont’s filings do not rank its mines against other companies’ mines. Within Newmont’s Australian portfolio, Boddington produced more than Tanami (391,000 ounces) or Cadia (385,000 ounces) in 2025. Wikipedia described it as Australia’s biggest producing gold mine as of 2022; rankings change from year to year, so look at the latest annual survey of Australian gold mines for the current order.
How much gold is left at Boddington
Reserves were 10.2 million ounces of gold at 31 December 2025, down from 10.8 million a year earlier, plus 4.4 million ounces of resources. At the 2025 production rate the reserves are equal to about 18 years, though that is simple division and not a mine plan.
How long will the Boddington mine operate
The current approval allows mining to 2041. Newmont has proposed an extension of five years to 2046, which the Western Australian EPA is assessing as assessment 2507.
What is RDA2 at Boddington
RDA2 is the planned second residue disposal area, which means a new tailings dam. Newmont says the existing facility fills up around 2029 and that RDA2 must be working by then. It would be built on the Saddleback Treefarm area.
Was Boddington affected by the December bushfire
Yes. A bushfire that started in mid-December 2025 temporarily suspended operations and damaged part of the water supply infrastructure, while major infrastructure stayed undamaged (Newmont 10-K). First-quarter 2026 gold output was 111,000 ounces, and second-quarter output rose to 160,000 ounces.
What does it cost Newmont to produce an ounce at Boddington
In 2025 the cost applicable to sales was $1,244 an ounce and the all-in sustaining cost was $1,514 an ounce, both on a co-product basis. In the second quarter of 2026 the co-product AISC was $1,622 an ounce.
This page is for information only. It is not investment advice and gives no price targets. Check Newmont’s latest filings before you rely on any figure.
Farmonaut mining
Map your mining site from space
Consultants can screen a licence area with satellite data and get exploration targets ahead of a resource estimate.

Mining Pro sample view, synthetic data
Keep reading
Sources
- Newmont Corporation, Form 10-K for 2025: s24.q4cdn.com
- Newmont, Q4 2025 operating statistics: s24.q4cdn.com
- Newmont, Q2 2026 operating statistics: s24.q4cdn.com
- EPA Western Australia, Newmont Boddington Mine Life of Mine Extension Amendment (assessment 2507): epa.wa.gov.au
- Newmont, Boddington Life of Mine Extension Amendment fact sheet: s24.q4cdn.com
- Newmont, 2025 Sustainability Report: s24.q4cdn.com
- USGS, Mineral Commodity Summaries 2026: Gold: pubs.usgs.gov
- Kitco, Newmont second-quarter results (23 July 2026): kitco.com
- Wikipedia, Boddington gold mine: en.wikipedia.org
- Wikipedia, AngloGold Ashanti: en.wikipedia.org
Discussion
Questions, corrections or field experience? Share them below. First-time comments are reviewed before they appear, and your email is never published.
No comments yet. Be the first to add a question or your experience.

 SMA Investments Ltd
 NTS Group (Pty) Ltd
 Mine4Africa
 Lithspo Minerals Limited
 Tintina Mining Group
 Dalgety Minerals Pty Ltd
 Vortex Minerals Pty Ltd
 Faith At Work (Pty) Ltd
 Geotech Mining Solutions plc
 Vulcan International Limited
 Kidepo Associates
 GKY Mining
 Alkimy SARL
 Double A Trading
 GemSprout Metals Limited
 Qader Group
 Ileys General Trading
 SG Gold Mining LLC
 VRV Global Pte Ltd
 Omsri International FZE
 G.I.T.T.
 Jaunita Erss Ltd
 Almosi SARL
 SRK Consulting
 Berks Gold Limited
