

Copper and uranium · Price outlook comparison
Copper Price Projections and Uranium Outlook Compared
The World Bank sees copper at US$12,000 a tonne for 2026 and US$11,000 for 2027; banks range up to US$14,675 for 2027. See each forecast with its date, the uranium spot and term record, and two calculators.
Key takeaways
- Copper forecasts for 2027 run from US$11,000 (World Bank, April 2026) to US$14,675 a tonne (BMO, reported 14 October 2026).
- LME cash copper settled at a record US$14,822 on 12 October 2026; the January to September 2026 average was US$13,431 (World Bank Pink Sheet).
- The split between forecasters is mostly about the US stockpile: US refined copper imports rose to 1.7 million tonnes in 2025 from 903,000 in 2024 (USGS, 2026).
- Uranium month-end spot was US$89.63 a pound and long-term US$96.50 at the end of September 2026 (Cameco industry averages).
- The World Bank forecast table has no uranium row; the dated broker forecasts (Stifel, Barrenjoey, UBS) are from late 2025.
In this article
- Copper price projections compared: World Bank, Cochilco and banks
- Why the copper forecasts disagree: the US stockpile, tariffs and China
- Copper price today versus the projections
- How a copper forecast changes a mine's margin
- Uranium forecasts: spot, term and broker views
- What moves uranium prices: supply, acid and utility buying
- How to test a uranium seller's average price
- How to use a price projection in a mining study: five steps
- Where satellite screening fits when prices rise
- Frequently asked questions
Copper is expected to average between US$12,000 and US$13,600 a tonne in 2026 and between US$11,000 and US$14,700 in 2027, depending on who you ask. The World Bank’s April 2026 outlook has US$12,000 for 2026 and US$11,000 for 2027. Three banks quoted by MINING.COM on 14 October 2026 put 2027 at US$12,750 (Macquarie), US$12,900 (BMI, a unit of Fitch Solutions) and US$14,675 (BMO Capital Markets). For uranium, there is no World Bank forecast: the useful numbers are the month-end spot and long-term prices that Cameco publishes (US$89.63 and US$96.50 per pound of U3O8 at the end of September 2026) and a handful of dated broker forecasts.
This page puts the copper projections side by side, explains why they differ, checks them against the actual price, and does the same for uranium. Two calculators let you test a copper mine’s margin and a uranium seller’s average price with your own numbers. A projection is an opinion with a date on it, so every figure below carries its publisher and date. Prices for copper are in US dollars per metric tonne unless stated (one tonne is 2,204.62 pounds, so US$1 per pound is US$2,204.62 per tonne).
Copper price projections compared: World Bank, Cochilco and banks
Five forecasters publish numbers that anyone can check. The World Bank issues its Commodity Markets Outlook twice a year, in April and October. Cochilco, the Chilean Copper Commission, publishes a quarterly market report with its own price view. Macquarie, BMO and BMI are banks and research houses whose quarterly price decks were summarised by MINING.COM. Deutsche Bank’s metals head gave one dated call for the second quarter of 2027. The table puts them in one place. Cochilco quotes US dollars per pound, so its tonne figures are our conversion at 2,204.62 pounds per tonne.
Chart
2026 average copper price: forecasts and the nine-month actual
US$ per tonne; Cochilco converted from US dollars per pound
| Forecaster | Published | 2026 average (US$/t) | 2027 average (US$/t) | Longer-term view |
|---|---|---|---|---|
| World Bank | April 2026 | 12,000 | 11,000 | Not in the table |
| Cochilco | 12 August 2026 | 13,117 (US$5.95/lb) | 11,244 (US$5.10/lb) | Not stated |
| Macquarie | Reported 14 October 2026 | 13,573 | 12,750 | US$10,500 in 2025 dollars |
| BMO Capital Markets | Reported 14 October 2026 | 13,619 | 14,675 | US$16,000 for 2028; long-term US$16,000 in real terms, US$18,000 nominal by 2030 |
| BMI (Fitch Solutions) | Reported 14 October 2026 | 13,500 | 12,900 | US$15,000 in 2029; US$17,000 in 2035 |
| Deutsche Bank | Reported 14 October 2026 | Not given | US$22,050 (US$10/lb) in the second quarter | Not given |
Sources: World Bank forecast table, April 2026; Reporte Minero on Cochilco’s second-quarter report; MINING.COM, 14 October 2026. “Nominal” means not adjusted for inflation; “2025 dollars” means the number is adjusted so it can be compared with today’s money. Do not put a real figure and a nominal figure in the same column of a model.
The 2026 column is tight: the four non-World Bank numbers sit within about US$500 of each other, because most of the year is already known. The 2027 column is where views split, from US$11,000 to US$14,675 for an annual average. That is a gap of one third of the lower figure, and it is the gap your mine plan has to live with. The World Bank’s own page for this table is covered in more detail in our guide to the World Bank copper price forecast.
Why the copper forecasts disagree: the US stockpile, tariffs and China
All the forecasters see the same tight mines. Cochilco expects refined supply of 23.5 million tonnes in 2026, held back by a slow recovery at Grasberg in Indonesia, problems at Kamoa-Kakula in the Democratic Republic of the Congo, and lower volumes at Codelco, Escondida and Spence. What splits them is the stock of metal that moved into the United States. USGS estimates that US refined copper imports rose to 1.7 million tonnes in 2025 from 903,000 tonnes in 2024, and that year-end US refined stocks reached 450,000 tonnes against 123,000 a year earlier (USGS Mineral Commodity Summaries, 2026). MINING.COM reports BMO putting the American hoard at close to 2 million tonnes, or about a year of US use.
Chart
2027 average copper price by forecaster
US$ per tonne; Cochilco converted from US$5.10 per pound
How you count that metal decides your price view:
- Surplus view (Macquarie). It expects a 223,000-tonne surplus in 2026 and surpluses above 700,000 tonnes a year from 2027, as mine supply grows 4.9% in 2027. It calls the market “very binary” because a US tariff decision could swing prices either way.
- Hidden-demand view (BMO). It argues the stock is a move from “not visible” to “visible” metal, not a build in total stocks, and that China has been running down its own reserve. It sees a near-balanced market (an 83,000-tonne surplus in 2026, then small deficits) and a long-term price 46% above consensus.
- Middle view (BMI). It sees a 43,000-tonne surplus this year, then deficits that widen to 1.7 million tonnes by 2035 as demand grows 3% to 4% a year.
- Cochilco and the International Copper Study Group. Cochilco sees surpluses of 225,000 tonnes (2026) and 179,000 tonnes (2027) and says they are not true oversupply because the stocks sit in the US. The study group, per MINING.COM, lifted its 2026 surplus estimate to 104,000 tonnes and kept 2027 at 368,000 tonnes.
The second split is policy. A possible US duty on refined copper (a Section 232 trade action) is still undecided. Macquarie rates “no announcement at all” by 1 January as its most likely case and says a decision against any duty would probably make the Comex price (the New York contract) “collapse” towards London. BMO expects no decision before the US midterm elections in November. Deutsche Bank’s call for US$10 a pound in the second quarter of 2027 rests on China and the US together holding about 71% of the world’s supply by the end of this year, which it says would leave users elsewhere short by the end of 2028. The third split is China, which used 58.9% of the world’s refined copper last year according to the Copper Journal figure quoted by MINING.COM. Macquarie sees no demand growth there in 2027; BMI sees global demand growing 3% to 4% a year.
▶ Explains why electric vehicles need more copper than petrol cars and follows copper from a Chilean mine to the car. · 6:03
Copper price today versus the projections
Forecasts are only useful if you know where the market is. On Monday 12 October 2026 cash copper on the London Metal Exchange settled at a record US$14,822 a tonne, and Tuesday’s settlement was US$14,741, with LME stocks down to 229,650 tonnes (MINING.COM, 14 October 2026). The World Bank’s monthly price file, updated 2 October 2026, shows the September 2026 average at US$14,474, the highest month in a series that starts in 1960. The average for January to September 2026 is US$13,431 (World Bank Pink Sheet), so the World Bank’s US$12,000 for the full year would need the last three months to average about US$7,700 (our arithmetic), which is far below any price seen in 2026.
Chart
LME copper by month against the World Bank 2026 forecast
US$ per tonne, monthly average; selected months
The same monthly file shows how fast the move was: US$9,984 in September 2025, US$11,785 in December 2025, US$13,012 in January 2026 and US$14,474 in September 2026. A forecast that was sensible in October 2025 looks low now. The World Bank’s October 2025 outlook had US$9,800 for 2026 and US$10,000 for 2027. Six months later it raised the 2026 figure by US$2,200 and the 2027 figure by US$1,000, to the numbers in the table above. The lesson for a project study is to treat any single forecast as a point on a range and to rerun the economics when the next edition appears.
How a copper forecast changes a mine’s margin
A copper mine sells payable metal, which is the share of the copper in the concentrate that the smelter pays for (the share is set in the sales contract). Revenue is payable tonnes times price, and the margin is what is left after cash costs, which miners quote in US dollars per pound. A rise from US$12,000 to US$14,000 a tonne is a 17% rise in revenue but a much larger rise in margin, because costs do not move with the price. The calculator below lets you test this. Enter your own tonnes, payable share, cost per pound and a price taken from any column of the table above. The prices in the box are examples, not forecasts.
Two reference points help you pick a cost. Cochilco’s cost observatory, which covers 21 Chilean operations making about 94% of the country’s copper, put their average net cost at about US$1.8 a pound in 2025, after credits for by-products such as gold, silver and molybdenum (Reporte Minero, 1 June 2026). A mine without by-products will have a higher figure. RBC Capital Markets, per MINING.COM, calculates that North American copper producers trading at 1.0 times net asset value (the value of their mines after costs, discounted) imply a copper price of US$5.03 a pound, against a futures price near US$6.70 on 14 October 2026. That is a market-implied “long-run” number, and it is lower than the BMO and BMI long-term views.
Project studies often use a lower, longer-run price than the spot price for the same reason. A mine lasts 15 to 30 years, and nobody expects a record to last. If you are screening ground for a copper discovery, our guides to copper deposit types and porphyry copper deposits explain what sort of deposit those prices need.
Calculator
What is your copper margin at a forecast price?
Enter your own tonnes, payable share, cost and a price from the table above.
- Revenue: $1,152,000,000
- Cash cost: $423,287,040
- Margin if the price is 20% lower: $498,312,960
- Break-even price per tonne: $4,409
- Price per pound: 5.44
Example values only, not benchmarks or forecasts. The price is an input: use today’s price or a forecast from the table. Cost is cash cost per payable pound after by-product credits. One tonne is 2,204.62 pounds (fixed in the formulas). Money in US$.
Uranium forecasts: spot, term and broker views
Uranium does not trade on an open exchange. As Cameco puts it on its price page, buyers and sellers negotiate contracts privately, and the company builds industry averages from the month-end prices published by UxC and TradeTech (Cameco, uranium price series). Those averages are the best public record. Spot means delivery within a few months; UxC’s spot definition considers deliveries up to three months out and lots of at least 50,000 pounds (UxC price indicator definitions). The long-term price is the level in contracts that deliver over several years.
Chart
Broker uranium forecasts made in late 2025
US$ per pound U3O8
Chart
Uranium spot and long-term price, month-end
US$ per pound U3O8, industry average of UxC and TradeTech; every six months
Both prices are higher than a year ago. Month-end spot was US$64.23 at the end of March 2025, US$82.63 in September 2025, US$94.28 in January 2026 and US$89.63 in September 2026. The long-term price climbed from US$80.00 in March 2025 to US$96.50 in September 2026, the highest value in Cameco’s long-term series, which starts in 1996. Spot was below the long-term price at every month-end from October 2024 to September 2026 except January 2026, so buyers signing multi-year contracts have been paying a premium to the quick-delivery price.
The uranium forecasts below are from brokers summarised by FNArena, an Australian market-news service, and they are older than the copper ones. They are dated, so you can see how they have fared:
- Stifel (28 October 2025): US$90 for 2026, US$100 for 2027, US$110 for 2028, and US$120 from 2029 (FNArena).
- Barrenjoey (16 December 2025): US$90 for 2026 and US$100 for 2027, the 2027 figure raised from US$90 (FNArena).
- UBS (16 December 2025): US$80 a pound for 2026, 2027 and 2028, US$85 for 2029, and a long-term US$81 in nominal terms for 2030 (same FNArena report).
- Macquarie (28 October 2025): long-term price raised to US$95 from US$85 (FNArena, 28 October 2025). Shaw and Partners assumed a peak of US$150 starting late 2026 and a return to US$90 by 2032 in 2025 money.
- Citi (9 June 2026): a “tactical” call that spot would trade above US$100 within three months (FNArena).
Checking them against Cameco’s data: the average of the nine 2026 month-end spot prices to September is US$87.4 (our arithmetic), between UBS’s US$80 and Stifel’s and Barrenjoey’s US$90. Spot month-end values from June to September 2026 ranged from US$85.00 to US$89.68, so Citi’s US$100 call had not appeared in those readings by the end of September. A month-end value can miss an intra-month high, so this is a check, not a verdict. The World Bank’s forecast table does not include uranium, so the broker numbers are the dated forecasts used on this page.
What moves uranium prices: supply, acid and utility buying
Citi gave the supply reasons in June 2026. It cut 2026 and 2027 supply by 3 to 4 million pounds because of a flooded McArthur River in Canada, weather and equipment problems in Australia and Africa, and slower Kazakh output. It also pointed to sulphuric acid: about 47% of the world’s supply moved through the Strait of Hormuz in 2025, and the acid price was up 60% on the level before the Middle East war began (FNArena, 9 June 2026). Acid is used in leaching, so it matters for Kazakhstan and for mines in Africa and Australia. Kazatomprom’s half-year report says the sulphuric acid plant at its TQZ project will now start between the third quarter of 2027 and the first quarter of 2028, a delay of 6 to 12 months, and that it expects no material effect on current mining, with the effect on 2027 production guidance still to be assessed (Kazatomprom, 1H2026 results).
Cameco, the second large producer, kept its 2026 production guidance at 19.5 to 21.5 million pounds (its share) and reported a lower planned delivery volume for 2026 because of what it calls contracting discipline. It also reported buying 2.8 million pounds of uranium in the second quarter at an average US$66.60 a pound (Cameco, second-quarter 2026 report). On demand, Citi expects 51 reactors to be built by 2030, 29 of them in China, lifting capacity by 45 GWe from 415 GWe.
The reason spot and term prices can differ is how the market works. The World Nuclear Association says most uranium is sold under contracts of 3 to 15 years, at prices usually above spot, and that spot is only about a quarter of trade. Citi said speculators made up 30% to 40% of spot volume in the first half of 2026. For the daily spot level, see our page on the uranium spot price; this page does not repeat it.

▶ A short clay-animation explainer on the Kanyemba uranium deposit in Zimbabwe and uranium in Africa. · 4:27
How to test a uranium seller’s average price
A producer rarely sells everything at spot. Its realised price blends old contracts, new term contracts and some spot sales, which is why a company’s average can lag the spot price in a rising market. The second calculator lets you set the share of pounds sold under term contracts, the term price and the spot price. The numbers it starts with are examples, not forecasts: use a term price and a spot price from the Cameco table, or from a forecast above.
Calculator
What is your average uranium price?
Enter your own pounds, contract share and prices.
- Revenue for the year: $407,500,000
- Average price if spot is 20% higher: 86.60
- Revenue from spot pounds: $127,500,000
Example values only, not benchmarks or forecasts. Both prices are inputs: use figures from the Cameco table or a forecast. The calculation ignores escalators, floors and ceilings that real contracts may have. Money in US$ per pound of U3O8.
How to use a price projection in a mining study: five steps
- Pick a published range, not a point. Use a low case and a high case from named sources, such as the World Bank and Cochilco on the low side and BMO on the high side.
- Check the date and the basis. Is it an annual average or a quarter? Cash or three-month price? Nominal or real dollars? Per pound or per tonne?
- Use a lower long-run price than the spot price. Banks quote long-term levels for this reason, as in Macquarie’s US$10,500 in 2025 dollars.
- Run the margin at several prices. The calculator above shows the margin at your price and at 20% lower.
- Rerun when new numbers arrive. The World Bank publishes in April and October, Cochilco every quarter, and uranium brokers change their numbers several times a year.
Where satellite screening fits when prices rise
A high copper or uranium price makes marginal ground worth looking at again, but the price does not tell you where the metal is. A satellite screen of your licence area can mark alteration and structure that guide where to sample first. Farmonaut offers this as an exploration target screen, not a resource estimate. See our page on satellite-based mineral detection, send an area through the mining query form, or contact us with a question.
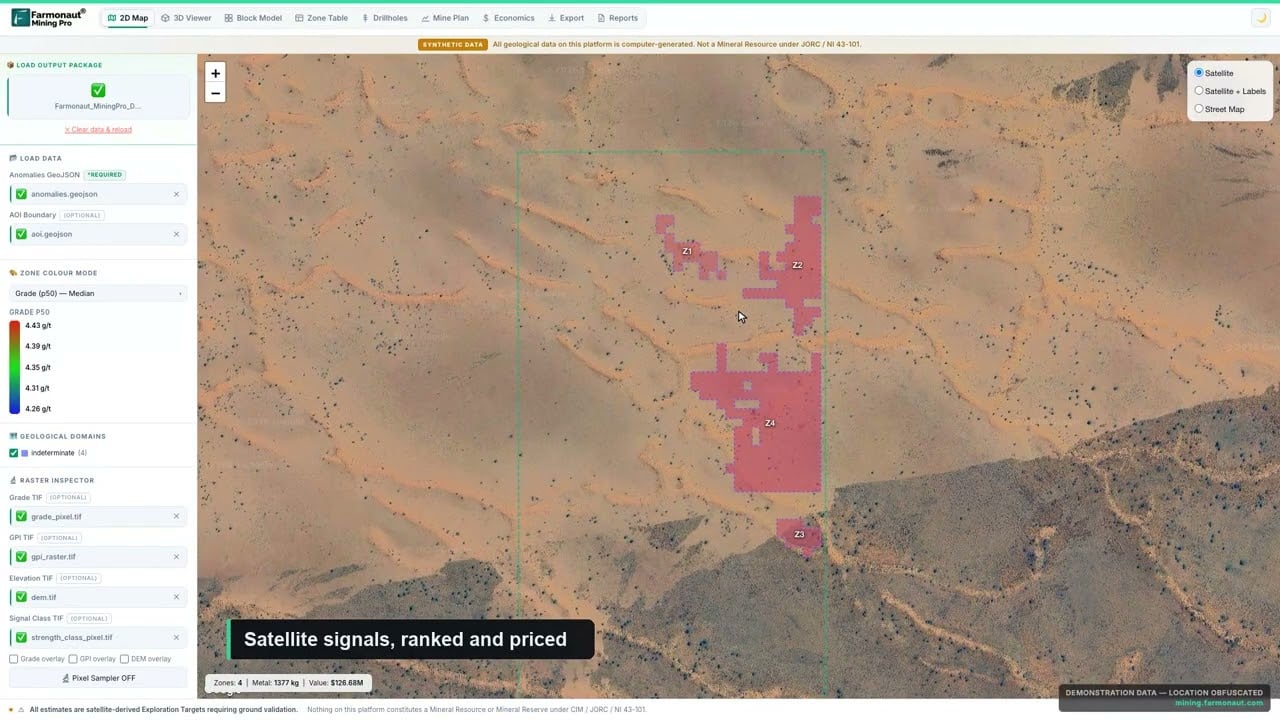
▶ A short look at Farmonaut Mining Pro, the satellite platform that turns a licence boundary into a geological and economic picture. · 4:56
Related reading on this site: Copper Mining Stocks: 13 Producers Compared.
We cover a connected topic in Best Metals to Invest In: 4 Compared by Price and Supply.
Frequently asked questions
What is the copper price forecast for next year?
For 2027 the World Bank has US$11,000 a tonne (April 2026), Cochilco US$5.10 a pound or about US$11,244 (August 2026), Macquarie US$12,750, BMI US$12,900 and BMO US$14,675 (all reported by MINING.COM on 14 October 2026).
Will copper prices increase from here?
The sources disagree. BMO and Deutsche Bank expect higher prices, while the World Bank, Cochilco and Macquarie have lower averages for 2027 than for 2026. Macquarie calls the outlook very binary because of the US tariff decision.
What is the highest copper price forecast?
Of the forecasts on this page, Deutsche Bank’s US$10 a pound (US$22,050 a tonne) for the second quarter of 2027 is the highest dated call. It is a single quarter, not an annual average.
Who publishes official copper price forecasts?
The World Bank publishes a forecast table twice a year, and Cochilco publishes a quarterly report with its own price view. The International Copper Study Group publishes supply and demand balances, such as the surplus estimates quoted above.
Why is the Comex copper price different from the LME price?
Comex is the New York contract and the LME is the London contract. A gap opens when traders expect a US import duty. MINING.COM reported on 14 October 2026 that the December Comex contract was about US$170 a tonne above the LME three-month price.
What copper price do mine studies use?
Most studies use a long-run price that is lower than the spot price and say whether it is in real or nominal dollars. Macquarie’s long-term view is US$10,500 in 2025 dollars, while BMO’s is US$16,000 in real terms.
What is the uranium price forecast?
Broker forecasts for 2027, made in late 2025: Stifel US$100, Barrenjoey US$100 and UBS US$80. The industry-average month-end spot price was US$89.63 and the long-term price US$96.50 at the end of September 2026 (Cameco).
What is the difference between spot and term uranium prices?
Spot is for delivery within months and makes up about a quarter of trade. Term contracts run for years and carry most of the volume (World Nuclear Association).
Is there a World Bank forecast for uranium?
No. The April 2026 forecast table covers energy, agriculture, fertilizers, base metals, iron ore and precious metals, but has no uranium row.
This page is for information only. It is not investment advice. Forecasts are opinions with dates and change often; prices are quoted from the sources shown. Bank forecasts are as reported by MINING.COM and FNArena.
Farmonaut mining
Get a quote to screen your project area from space
Send a KML, KMZ or polygon and Farmonaut screens the area from satellite images to rank exploration targets before field work.

Mining Pro sample view, synthetic data
Keep reading



Sources
- World Bank, Commodity Markets Outlook forecast table, April 2026: thedocs.worldbank.org
- World Bank, Commodity Markets Outlook forecast table, October 2025: thedocs.worldbank.org
- World Bank, Pink Sheet monthly prices (updated 2 October 2026): thedocs.worldbank.org
- MINING.COM, Copper price forecasts lifted for 2026 but tariff collapse still on the table (14 October 2026): mining.com
- Reporte Minero, Cochilco raises its 2026 average copper price projection (12 August 2026): reporteminero.cl
- Reporte Minero, Mining costs fall 5.7% in 2025 (Cochilco cost observatory, 1 June 2026): reporteminero.cl
- USGS, Mineral Commodity Summaries 2026: Copper: pubs.usgs.gov
- Cameco, Uranium price (industry averages of UxC and TradeTech month-end prices): cameco.com
- UxC, Nuclear fuel price indicator definitions: uxc.com
- FNArena, Uranium Week: Projecting US$150/lb Post 2026 (28 October 2025): fnarena.com
- FNArena, Uranium Week: Sprott Buying and ASX Upgrades (16 December 2025): fnarena.com
- FNArena, Uranium Week: Spot Above US$100/lb Soon? (9 June 2026): fnarena.com
- Cameco, Quarterly report, second quarter 2026: cameco.com
- Kazatomprom, 1H2026 financial results: kazatomprom.kz
- World Nuclear Association, Uranium markets: world-nuclear.org
Discussion
Questions, corrections or field experience? Share them below. First-time comments are reviewed before they appear, and your email is never published.
No comments yet. Be the first to add a question or your experience.

 Lithspo Minerals Limited
 Tintina Mining Group
 Dalgety Minerals Pty Ltd
 Vortex Minerals Pty Ltd
 Faith At Work (Pty) Ltd
 Geotech Mining Solutions plc
 Vulcan International Limited
 Kidepo Associates
 GKY Mining
 Alkimy SARL
 Double A Trading
 GemSprout Metals Limited
 Qader Group
 Ileys General Trading
 SG Gold Mining LLC
 VRV Global Pte Ltd
 Omsri International FZE
 G.I.T.T.
 Jaunita Erss Ltd
 Almosi SARL
 SRK Consulting
 Berks Gold Limited
 Mwerezi Minerals Company Limited
