

Copper mining stocks · Company comparison
Copper Mining Stocks: 13 Producers Compared
Thirteen copper producers listed on the NYSE, TSX, LSE and ASX, with their main mines, latest 2026 copper output and guidance, ETF facts and a margin calculator. Company releases, July to August 2026.
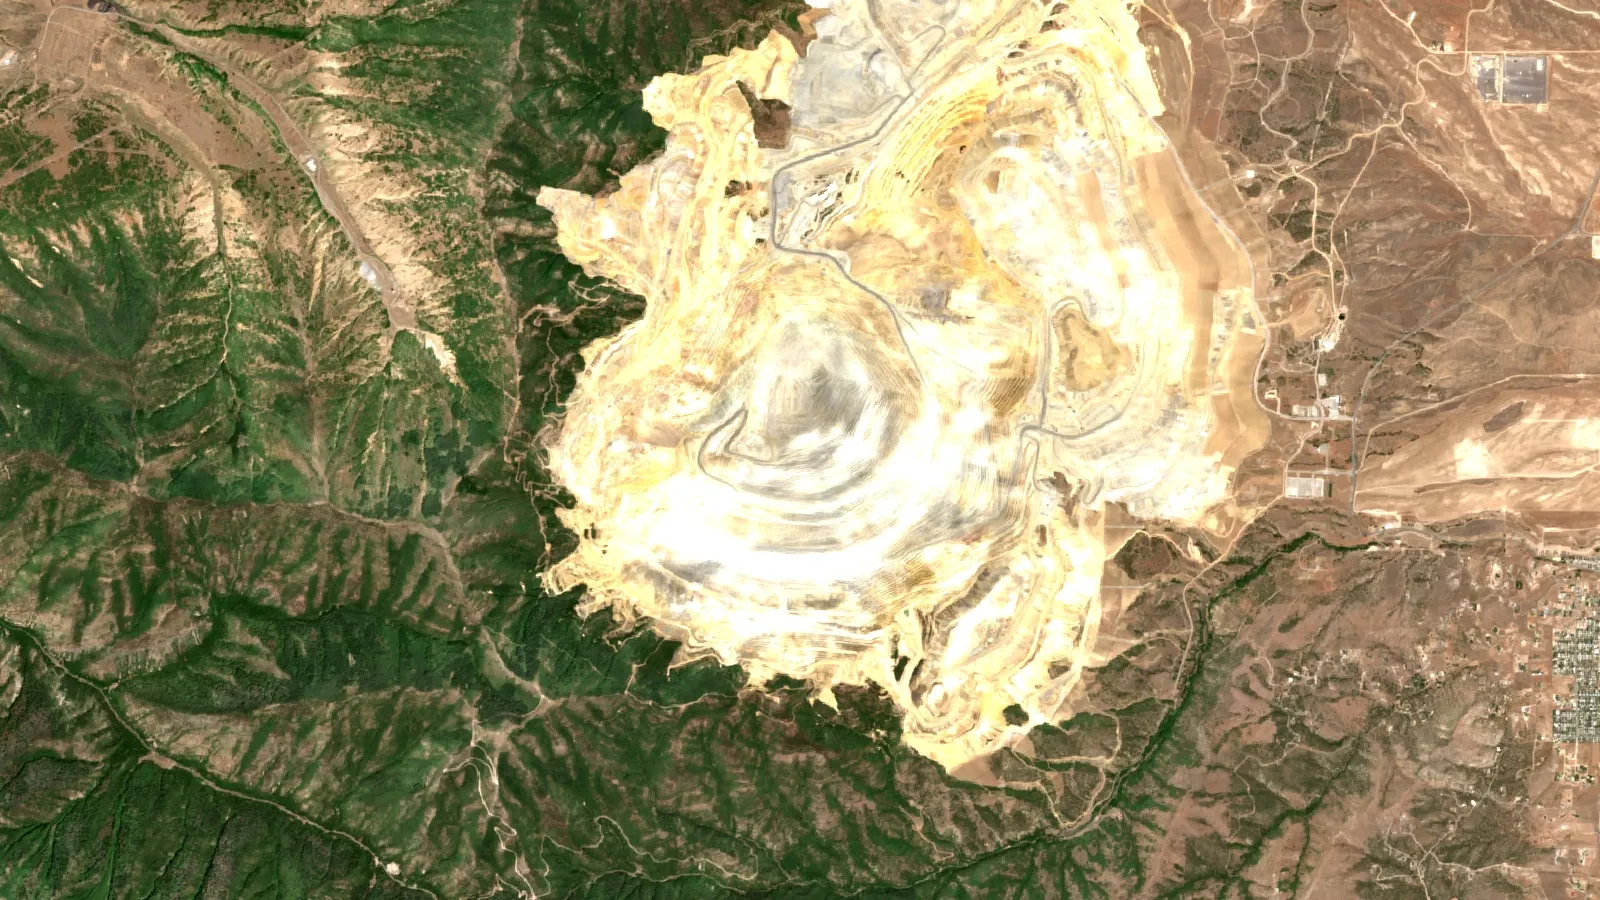
Key takeaways
- BHP produced 1,953 kt of copper in the year to 30 June 2026 and guides to 1,650-1,800 kt for the next year, mainly because Escondida’s feed grade is falling (0.90% Cu against 1.02% a year earlier; BHP, July 2026).
- Among calendar-2026 guidance ranges, Glencore (810-870 kt) and Rio Tinto (800-870 kt) lead, followed by Anglo American (700-760 kt) and Antofagasta (625-655 kt) (company releases, July to August 2026).
- Freeport’s second-quarter realized price rose to $6.17 per lb from $4.54, but sales fell about 30% to 710 million lb as Grasberg ramps back up (Freeport, 23 July 2026).
- Anglo American and Teck have not yet merged: China’s anti-trust approval is the last outstanding step, with completion expected between September 2026 and March 2027 (Anglo American, 23 July 2026).
- Chile holds an estimated 180 Mt of copper reserves, the most of any country; seven of the 13 companies operate mines there (USGS, February 2026).
In this article
- How we chose these copper mining stocks
- Copper mining stocks compared at a glance
- Diversified majors with large copper output
- Copper-led producers
- Guidance ranges for the copper mining stocks side by side
- Gold, molybdenum and other by-products
- Copper miners ETF: what a basket holds
- What moves copper mining stock results
- Operating risks seen in company reports
- Where the reserves sit behind copper mining stocks
- How much does a copper price change move a miner's margin
- What to check before reading a copper miner's results
- Checking a copper project from satellite data
- Frequently asked questions
Copper mining stocks are shares in listed companies that dig copper out of the ground, so their results move with the copper price, ore grade, unit costs and each mine’s operating record. This page compares 13 producers listed in New York, Toronto, London and Sydney: what each one mines, what it reported for copper in 2026, and what to check before reading its reports. It is a fact sheet, not advice. For the price itself, see our separate copper price outlook.
Terms used below. A tonne is 1,000 kg and kt means thousand tonnes. Grade is the share of copper in the rock, written as % Cu. Unit cost is the cash cost of producing a pound of copper, usually after credits from by-product metals such as gold and molybdenum; companies define it differently, so compare trends within one company, not across companies. Guidance is the output range a company expects for the year. Dollar amounts are US dollars unless marked C$ or A$.
How we chose these copper mining stocks
A company is included when it meets all four tests. Its main listing is on the NYSE, TSX, LSE or ASX. It reports copper output in tonnes in English-language releases. It guides to at least 100,000 tonnes of copper for 2026 (or for its 2026 fiscal year). And copper is either its main metal or one of the three largest metals of a diversified major. Figures come from each company’s own results or production release for the second quarter or first half of 2026, opened in October 2026.
These tests leave some well-known names out on purpose. Zijin Mining, Jiangxi Copper and MMG list in Hong Kong or Shanghai, KGHM lists in Warsaw and Codelco is state-owned, so none has a main listing in the four markets above. Barrick and Newmont mine copper but are gold-led. Sandfire Resources reports copper-equivalent output rather than copper alone. Vale’s base metals unit is not separately listed. Ero Copper and Taseko guide below 100,000 tonnes. The order below groups companies by type; it is not a performance ranking.
Copper mining stocks compared at a glance
The table shows the latest figure each company published for copper, with its period, and the 2026 guidance. Periods and reporting bases differ, as the notes under the table explain.
| Company | Main listing | Main copper assets | Latest reported copper output | Copper guidance |
|---|---|---|---|---|
| BHP | ASX: BHP | Escondida, Spence, Copper South Australia, Antamina | 1,953 kt, year to 30 June 2026 | 1,650-1,800 kt for the year to June 2027 |
| Rio Tinto | LSE / ASX / NYSE: RIO | Oyu Tolgoi, Kennecott | 442 kt, first half | 800-870 kt for 2026 |
| Glencore | LSE: GLEN | Collahuasi, Antamina, African Copper | 397 kt, first half | 810-870 kt for 2026 |
| Anglo American | LSE: AAL | Los Bronces, Collahuasi, Quellaveco | 173 kt, second quarter | 700-760 kt for 2026 |
| Teck Resources | TSX: TECK.A, TECK.B; NYSE: TECK | Quebrada Blanca, Highland Valley, Antamina | 136 kt, second quarter | 455-530 kt for 2026 |
| Freeport-McMoRan | NYSE: FCX | Grasberg, Morenci, Cerro Verde | 786 million lb (about 357 kt), second quarter | Sales of about 3.1 billion lb (about 1,400 kt) for 2026 |
| Southern Copper | NYSE: SCCO | Toquepala, Cuajone, Buenavista, La Caridad | 231 kt mined, second quarter | No range in its results release |
| Antofagasta | LSE: ANTO | Los Pelambres, Centinela | 285 kt, first half | 625-655 kt for 2026 |
| First Quantum Minerals | TSX: FM | Kansanshi, Sentinel, Cobre Panama | 100 kt, second quarter | 405-475 kt for 2026 |
| Lundin Mining | TSX: LUN | Candelaria, Caserones, Chapada | 77 kt, second quarter | 310-335 kt for 2026 |
| Ivanhoe Mines | TSX: IVN | Kamoa-Kakula | 64 kt, second quarter (whole mine) | 290-310 kt for 2026 (whole mine) |
| Capstone Copper | TSX: CS; ASX: CSC | Mantoverde, Mantos Blancos, Pinto Valley, Cozamin | 52 kt, second quarter | 200-230 kt for 2026 |
| Hudbay Minerals | TSX / NYSE: HBM | Constancia, Snow Lake, Copper Mountain | 28 kt, second quarter | 110-138 kt for 2026 |
Notes. BHP reports Escondida on a 100% basis and uses a financial year ending 30 June. Freeport reports consolidated production and sales in pounds; one tonne is 2,204.6 lb. Southern Copper’s figure is copper mined, and its release gives no guidance range. Ivanhoe reports Kamoa-Kakula for the whole mine, not Ivanhoe’s share. Sources are listed at the end of the page.
Diversified majors with large copper output
These four companies also earn money from iron ore, coal, aluminium or other metals, so copper moves their results less than it moves a copper-only miner’s.
BHP
What it is: An Australian-headquartered major whose copper comes from Escondida in Chile, Spence in Chile, Copper South Australia and a share of Antamina in Peru. Group copper output was 1,953 kt in the year to 30 June 2026, down 3%, with Escondida at 1,261 kt (100% basis).
Points to check: BHP expects 1,650-1,800 kt in the following year, mainly because Escondida’s concentrator feed grade keeps falling. It was 0.90% Cu in the year just ended against 1.02% a year earlier. Iron ore was 265 Mt in the same year, so copper is one of several earnings drivers.
Rio Tinto
What it is: A mining major that listed in London, Sydney and New York. Its copper comes mainly from Oyu Tolgoi in Mongolia and Kennecott in Utah. In the first half of 2026 it reported 442 kt of consolidated copper, up 1%, against guidance of 800-870 kt for the year.
Points to check: Oyu Tolgoi produced 198 kt of copper in concentrate, up 31%, as its underground mine ramps up. Kennecott made 54 kt of refined copper in the half, against 82 kt a year earlier. Rio holds 55% of the Resolution project in Arizona, with BHP holding the rest; underground development has started but the project has no production yet.
Glencore
What it is: A Swiss-based commodity producer and trader listed in London. Its own-sourced copper output in the first half of 2026 was 397,000 tonnes, 15% above the first half of 2025, driven by its African Copper operations and by Antamina.
Points to check: Glencore kept its 2026 copper guidance of 810-870 kt after selling the Kidd mine in Canada on 1 June 2026. It also mines coal and zinc, and its cobalt output fell sharply in the half, so the group result depends on more than copper.
Anglo American
What it is: A London-listed major whose copper comes from Chile and Peru, including the Los Bronces, Collahuasi and Quellaveco mines. Second-quarter copper output was 173,200 tonnes, flat on a year earlier, and 2026 guidance is 700-760 kt.
Points to check: Anglo American has agreed to combine with Teck. It calls anti-trust approval in China the final outstanding regulatory milestone and gives a completion window of September 2026 to March 2027. It is also selling its steelmaking coal business. Until the deal closes, the two companies keep separate listings and share structures; both said so in July 2026.
Copper-led producers
For these companies copper is the main product, so the share price tracks the copper price and the company’s own mine problems more closely.
Teck Resources
What it is: A Vancouver-based miner with copper at Quebrada Blanca in Chile, Highland Valley in British Columbia and a share of Antamina, plus zinc. Its shares trade on the TSX as TECK.A and TECK.B and on the NYSE as TECK. Second-quarter 2026 copper output was 135,900 tonnes, up 25%, and guidance for the year is 455-530 kt.
Points to check: Quebrada Blanca made 55,800 tonnes in the quarter and has run steadily for three quarters. Teck says the merger with Anglo American is still expected to close within its original 12 to 18 month window.
Freeport-McMoRan
What it is: A US-listed producer with Grasberg in Indonesia, Morenci and other mines in Arizona and New Mexico, and Cerro Verde in Peru. In the second quarter of 2026 it produced 786 million lb of copper, sold 710 million lb and realized $6.17 per lb.
Points to check: Output is below last year because the Grasberg block cave is ramping up again; Freeport expects about 65% of production rates in the second half of 2026, about 80% by mid-2027 and full capacity by the end of 2027. Unit net cash costs were $1.97 per lb in the quarter, against $1.13 a year earlier, because volumes at Grasberg are lower. Freeport also guides to about 650,000 oz of gold sales for 2026.
Southern Copper
What it is: A copper producer with mines in Peru and Mexico, listed on the NYSE. Second-quarter copper mined was 230,662 tonnes, down 3.5%, and first-half copper mined was 461,206 tonnes.
Points to check: The company reports reserves for Mexican projects such as El Pilar (317 million tons of ore at 0.249% Cu) and El Arco (more than 1,230 million tons of sulphide ore at 0.40% Cu). It declared a $1.10 per share cash dividend in July 2026, so dividend policy is part of its profile. Its release does not state a production range for 2026.
Antofagasta
What it is: A London-listed, Chile-focused producer with Los Pelambres, Centinela and Zaldivar. First-half 2026 copper output was 285,000 tonnes, down 9%, and full-year guidance is 625-655 kt.
Points to check: The 2026 range follows a weather-related shutdown at Los Pelambres, after which operations resumed. The company expects a 30% rise in copper output from projects at Centinela and Los Pelambres once commissioning completes in 2027. Cash costs before by-product credits were $2.85 per lb in the half, up 23%.
First Quantum Minerals
What it is: A Vancouver-based miner with Kansanshi and Sentinel in Zambia and the Cobre Panama mine in Panama. Second-quarter copper output was 100,487 tonnes, and 2026 guidance is 405-475 kt.
Points to check: Cobre Panama has been in preservation and safe management since November 2023. Panama authorized processing of stockpiled ore on 7 April 2026, and the mine made 3,216 tonnes of copper in the quarter against 2026 guidance of 30,000-40,000 tonnes. The release describes stockpile processing only.
Lundin Mining
What it is: A Vancouver-based miner with Candelaria and Caserones in Chile and Chapada in Brazil. Second-quarter copper output was 76,877 tonnes at a realized price of $6.51 per lb, and guidance is 310-335 kt.
Points to check: Chilean operations are exposed to weather and water supply; Lundin says winter storms put Caserones in the lower half of its 130-140 kt range. It also holds an interest in the Vicuna project through Vicuna Corp. alongside BHP.
Ivanhoe Mines
What it is: A Toronto-listed developer-operator whose main asset is Kamoa-Kakula in Congo. Kamoa-Kakula produced 64,328 tonnes of copper in the second quarter, from an on-site smelter and a toll smelter.
Points to check: Ivanhoe reports the whole mine, not its share, and copper reaches the market as anode and blister. On 29 July 2026 it tightened 2026 Kamoa-Kakula guidance to 290,000-310,000 tonnes from 290,000-330,000 (Ivanhoe Mines). Smelter performance and the production ramp-up are the main figures to follow in each release.
Capstone Copper
What it is: A Vancouver-based producer with Mantoverde (70% owned) and Mantos Blancos in Chile, Pinto Valley in Arizona and Cozamin in Mexico. Second-quarter copper output was 51,759 tonnes against 57,416 tonnes a year earlier; guidance is 200-230 kt.
Points to check: First-half output was 99,719 tonnes against 2026 guidance of 200-230 kt. The Santo Domingo project in Chile is a development project, not a mine, with a final investment decision targeted for the fourth quarter of 2026.
Hudbay Minerals
What it is: A Toronto-based producer with Constancia in Peru, Snow Lake in Manitoba and Copper Mountain in British Columbia, listed on the TSX and NYSE. Second-quarter copper output was 28,267 tonnes, and guidance is 110,000-138,000 tonnes of copper and 217,000-272,000 oz of gold.
Points to check: Hudbay’s Copper World project in Arizona is on track for a sanctioning decision later in 2026. It has also completed its purchase of Arizona Sonoran Copper. A project decision is not production, so it adds no output until a mine is built.
Guidance ranges for the copper mining stocks side by side
The chart below plots the low and high ends of each company’s own guidance for calendar 2026 for eight of the producers. It shows scale and also how wide a range each company allows itself. Glencore and Rio Tinto guide to ranges of 60 to 70 kt, while Lundin’s is 25 kt. BHP, Freeport, Southern Copper, Ivanhoe and Hudbay are left out because their guidance uses a different year, unit or basis.
Chart
2026 copper guidance ranges, eight producers
Thousand tonnes of copper; each company’s own range for calendar 2026
Gold, molybdenum and other by-products
Many copper mines also recover gold, silver or molybdenum, and the revenue from those metals lowers the reported cost of copper. Freeport guides to about 650,000 oz of gold and 93 million lb of molybdenum for 2026. Hudbay guides to 217,000-272,000 oz of gold, and Lundin to 134,000-149,000 oz. Antofagasta made 92,800 oz of gold and 6,100 tonnes of molybdenum in the first half.
This is why a copper miner can show a lower unit cost when gold is strong, even if its copper output is flat. It also means a copper stock carries some gold-price exposure that a copper-only reading misses. Teck, for example, linked its fall in copper unit cost to US$1.64 per lb in the second quarter partly to by-product revenue. Holders of gold stocks and copper stocks should check which metal drives each company’s revenue in its own results, since the split differs by mine and year.
Copper miners ETF: what a basket holds
Some investors use a fund instead of picking single companies. The Global X Copper Miners ETF (COPX) tracks the Solactive Global Copper Miners Total Return Index. On the fund’s own page for 14 October 2026, it showed 40 holdings, net assets of $6.97 billion and an expense ratio of 0.65%. Its largest holdings were Teck Resources (5.62%), Southern Copper (5.50%), Hudbay Minerals (5.45%), BHP (5.32%) and Freeport-McMoRan (5.13%). By country, Canada was the largest weight at 39.98%, then the United States (10.44%) and Australia (9.74%).
The page also shows that funds hold companies outside the table above, so a fund’s mix differs from a hand-picked list. Past returns and yields on a fund page change with each update.
What moves copper mining stock results
Three numbers explain most of a copper miner’s quarter: the price it received, the volume it sold, and the cost of each pound. Freeport shows all three in one release. Its realized price rose to $6.17 per lb from $4.54 a year earlier, yet sales volume fell about 30% and unit cost rose from $1.13 to $1.97, so profit rose less than the price alone suggests.
Chart
Annual average copper price, 2021 to 2025
US cents per pound; 2025 is a USGS estimate
On price, the Chilean Copper Commission’s daily bulletin showed a 2026 average to 31 August of 603.1 US cents per lb for LME cash copper (US$13,296 per tonne), about 40% above the same period a year earlier. Annual averages for the five years to 2025 are in the chart, and the price outlook is covered in our copper price analysis.
Trade policy matters for US-listed names. A July 2025 US proclamation put a 50% tariff on imports of semi-finished copper products and copper-intensive derivatives from 1 August 2025. The same text asked the Commerce Secretary to report on whether a phased duty on refined copper (15% from 1 January 2027 and 30% from 1 January 2028) was warranted. The proclamation text itself only asks for that report; it does not set a refined-copper duty.
Operating risks seen in company reports
Copper miners lose output to events as often as to prices. The second-quarter releases listed several. Freeport’s Grasberg ramp-up cut group volumes. Antofagasta reduced its 2026 range after a shutdown at Los Pelambres. Lundin placed Caserones in the lower half of its range after storms. Kennecott’s refined output fell by about a third in the half. Cobre Panama is still limited to stockpile processing. None of these tells you what a share price will do; each shows why a producer’s guidance deserves a second look every quarter.
The geography matters too. The USGS lists Chile with 180 million tonnes of copper reserves, more than any other country and ahead of Australia (100 million) and Peru (85 million). Seven of the 13 companies above operate mines in Chile: BHP, Glencore, Anglo American, Teck, Antofagasta, Lundin and Capstone. Each jurisdiction brings its own rules on royalties, water and permits.
Where the reserves sit behind copper mining stocks
The chart below shows USGS estimates of copper reserves, the part of the resource that can be mined profitably under current conditions. Production and reserves are different measures: Chile mined an estimated 5.3 Mt in 2025, and the US 1.0 Mt, per the USGS.
Chart
Copper reserves, eight leading countries
Million tonnes of copper in reserves; USGS also gives 27 Mt for Australia under the stricter JORC reporting code
How much does a copper price change move a miner’s margin
The calculator below shows how sensitive an operating margin is to the copper price. Enter output, a price and a unit cost, and read the margin and the effect of a 10% price move. It is a teaching tool with example inputs, not a forecast of any company. The method is simple: pounds sold times the gap between price and unit cost. Real results also depend on tax, royalties, interest, depreciation, timing of sales and by-product credits.
Calculator
How much does the copper price move an operating margin?
Enter your own output, price and unit cost.
- Copper sold (million lb): 220.5
- Margin per lb (US$): 4.00
- Margin if price is 10% higher (US$ m): 1,014.1
- Change from a 10% price rise (US$ m): 132.3
Example values only, not a forecast or any company’s numbers. Set your own copper price and the unit cost a company reports. One tonne is 2,204.62 lb (fixed in the formula). The margin is pounds sold times (price minus unit cost) and ignores tax, royalties, interest, depreciation and sales timing; enter a cost after by-product credits if you want credits included. Amounts are US dollars.
What to check before reading a copper miner’s results
- Basis of the numbers. Is output for the whole mine (100% basis), the company’s share, or consolidated? Is it mined copper, copper in concentrate or refined metal?
- Production against sales. Concentrate sold is priced weeks after shipment, so sales and production can differ in a quarter.
- Unit cost definition. C1 cash cost, net cash cost and cost after by-product credits are not the same measure.
- Guidance changes. Is the range unchanged, cut or narrowed, and what reason does the company give?
- Grade trend. A falling feed grade, such as Escondida’s, lowers output unless more ore is milled.
- Project stage. A feasibility study, a sanctioning decision and a mine in production are different things. Copper World and Santo Domingo are decisions pending, not output.
- Jurisdiction and permits. Check the licence, the royalty regime and the water supply for each mine named in the report.
- Merger and listing status. Share structures change when deals close, as with Anglo American and Teck.
Checking a copper project from satellite data
Company releases tell you what a miner reports, not what the ground looks like. Satellite imagery can show a mine’s footprint, new pits and stockpiles over time, and it can map clay, mica and iron-oxide minerals that often surround copper systems. It cannot measure grade or reserves, and it is not a substitute for drilling or a resource estimate. Our guide to porphyry copper alteration and grades shows what those mineral maps mean, and the copper deposits guide covers deposit types and where they occur.
▶ Explains remote sensing for mining in plain words: what the six instrument families measure and why agreement between them matters. · 2:01
For a licence of your own, Farmonaut can screen a boundary supplied as a KML, KMZ or polygon and return satellite-derived exploration targets, ahead of any resource estimate. See the satellite mineral detection page, send a request through the mining query form or contact us. A related page covers copper stock price trends.
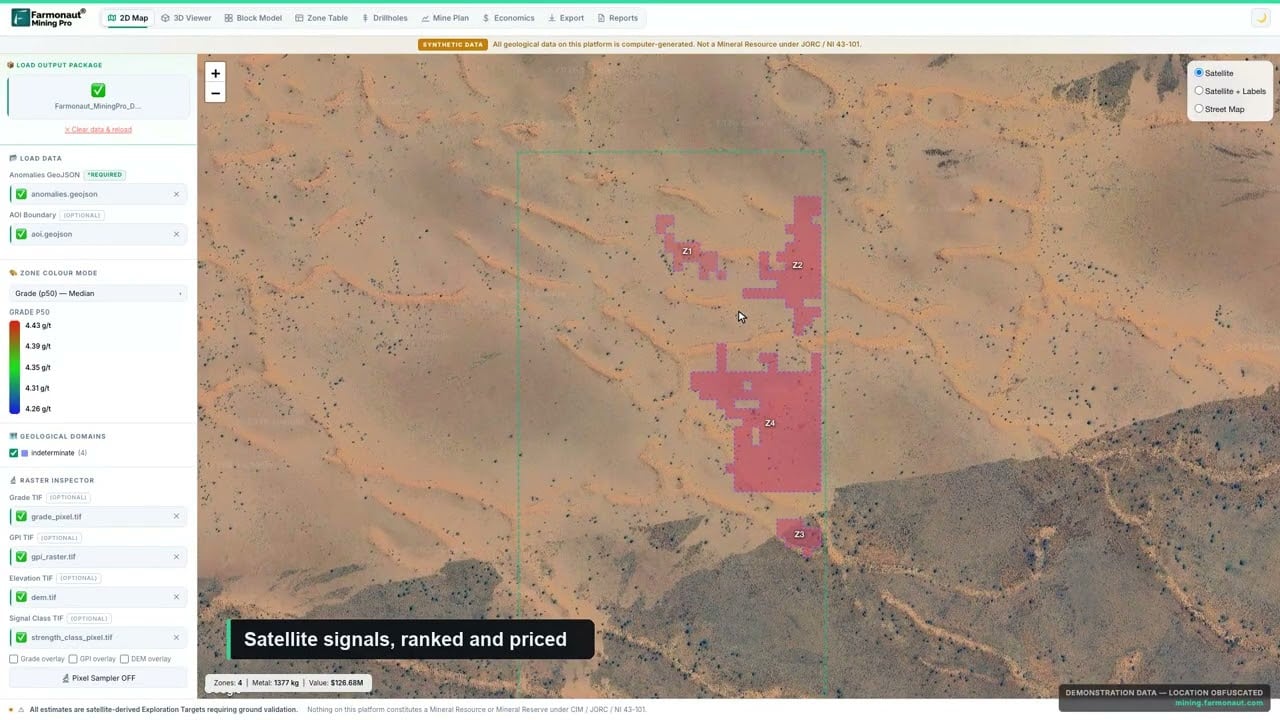
▶ A short tour of Farmonaut Mining Pro, which turns a licence boundary into satellite-derived exploration targets (de-identified demo data). · 4:56
For a closer look at a related question, see our guide: Emerging Market Gold Producers Compared by Output.
If this topic matters to you, read Scandium Suppliers Compared: Producers and Prices next.
Frequently asked questions
What are the biggest copper mining stocks?
By reported copper volume, the diversified majors lead the table above: BHP produced 1,953 kt in the year to June 2026, Rio Tinto 442 kt in the first half and Glencore 397 kt in the first half. Among copper-led companies, Freeport-McMoRan, Southern Copper and Antofagasta are the largest by volume. Reporting periods differ, so the list is a guide, not a ranking.
Which copper stocks trade on the NYSE?
Freeport-McMoRan (FCX), Southern Copper (SCCO), Teck Resources (TECK) and Hudbay Minerals (HBM) list on the NYSE. BHP and Rio Tinto list there as well, as American depositary receipts. Lundin Mining, First Quantum, Ivanhoe and Capstone have their main listing on the TSX.
Is copper a good investment?
This page does not give investment advice. It gives dated facts so readers can compare companies. Copper miners’ results depend on price, grade, costs and operating events, and past returns do not predict future ones.
What is the difference between copper stocks and a copper ETF?
A single stock is one company’s shares. A copper miners ETF such as COPX holds a basket of miners, and the fund’s page shows 40 holdings and a 0.65% expense ratio at the date quoted above. Neither holds physical copper.
Do copper mining stocks follow the copper price?
They are linked, but not one for one. A miner’s profit depends on volume and cost as well as price. Freeport’s second-quarter price rose 36% year on year ($4.54 to $6.17 per lb) while its sales volume fell about 30%.
Why do some copper miners also report gold?
Many copper deposits, especially porphyry deposits, contain gold and molybdenum. Companies sell them as by-products. Freeport guides to about 650,000 oz of gold for 2026 and Hudbay to 217,000-272,000 oz.
What is a unit cost, and why do companies differ?
It is the cost per pound of copper sold. Some firms report cost before by-product credits (Antofagasta, $2.85 per lb in the first half), others after (Teck, $1.64 per lb in the second quarter). Compare a company with its own earlier periods.
What happened to Teck and Anglo American?
They agreed a merger of equals. Anglo American says China’s anti-trust approval is the final outstanding regulatory step, with completion expected between September 2026 and March 2027. Until it closes, both companies report and trade separately.
Is Codelco a copper stock?
No. Codelco, Chile’s state-owned producer, is not listed on a stock exchange. Its output is not in this table.
Where do I find a company’s copper production figures?
Use its quarterly production report or results release on the company’s investor page, or the regulator’s filing system (SEC EDGAR for NYSE names, SEDAR+ for Canadian companies, the LSE and ASX announcement services). Read the notes on basis and units before comparing.
This page is for information only. It is not investment advice. It names companies for comparison and does not recommend buying or selling any share or fund. Check each company’s latest filings before relying on a figure.
Farmonaut mining
Screen a copper project from space
Investors and analysts can ask for a satellite screen of a licence area, giving exploration targets ahead of any resource estimate.

Mining Pro sample view, synthetic data
Keep reading
Sources
- USGS, Mineral Commodity Summaries 2026: Copper (February 2026): pubs.usgs.gov
- Freeport-McMoRan, second-quarter 2026 results (8-K exhibit 99.1, 23 July 2026): sec.gov
- Southern Copper, second-quarter 2026 results (8-K exhibit 99.1, 21 July 2026): sec.gov
- BHP, operational review for the year ended 30 June 2026 (ASX, 16 July 2026): announcements.asx.com.au
- Rio Tinto, second-quarter 2026 operations review (6-K, 15 July 2026): sec.gov
- Glencore, Half-Year Production Report 2026: glencore.com
- Anglo American, Production Report for the second quarter 2026 (23 July 2026): angloamerican.com
- Antofagasta plc, Half Year Results for the six months ended 30 June 2026: data.fca.org.uk
- Teck Resources, Reports Unaudited Second Quarter Results for 2026 (press release, 23 July 2026): seekingalpha.com
- Teck Resources, final court approval for merger with Anglo American (December 2025): teck.com
- First Quantum Minerals, second quarter 2026 results: first-quantum.com
- Lundin Mining, second quarter 2026 results: thelundingroup.com
- Ivanhoe Mines, Kamoa-Kakula second quarter 2026 production: newsfilecorp.com
- Capstone Copper, second quarter 2026 results: capstonecopper.com
- Hudbay Minerals, second quarter 2026 results (29 July 2026): s23.q4cdn.com
- Global X, Copper Miners ETF (COPX) fund page: globalxetfs.com
- Cochilco, La Rueda daily bulletin, 31 August 2026: cochilco.cl
- The White House, Adjusting Imports of Copper into the United States (July 2025): whitehouse.gov
- Ivanhoe Mines, second-quarter 2026 results (29 July 2026): newsfilecorp.com
Discussion
Questions, corrections or field experience? Share them below. First-time comments are reviewed before they appear, and your email is never published.
No comments yet. Be the first to add a question or your experience.

 Congo Mining Solutions
 Mining SARL
 SenGold Invest SAS
 Sania Corporation
 Sean Mining Limited
 NTS Group (Pty) Ltd
 Mine4Africa
 Lithspo Minerals Limited
 Tintina Mining Group
 Dalgety Minerals Pty Ltd
 Vortex Minerals Pty Ltd
 Faith At Work (Pty) Ltd
 Geotech Mining Solutions plc
 Vulcan International Limited
 Kidepo Associates
 GKY Mining
 Alkimy SARL
 Double A Trading
 GemSprout Metals Limited
 Qader Group
 Ileys General Trading
 SG Gold Mining LLC
 VRV Global Pte Ltd











