

Exploration geophysics · Methods guide
Geophysical Survey Methods for Mining: What Each One Sees
A geophysical survey measures magnetism, density, conductivity, chargeability or radioactivity to map what lies under cover. Here is what each method sees, what published surveys specify and cost, and how to plan ground geophysics.
Key takeaways
- A geophysical survey maps rock properties (magnetic, density, conductivity, radioactivity) to infer geology beneath cover; it ranks drill targets, it does not prove ore.
- Line spacing sets the cost: Geoscience Australia notes surveys before 1990 mostly used 1,500 m or wider spacing, and surveys since 1990 usually 400 m or less.
- USGS Earth MRI surveys in 2023-2024 flew 200-250 m lines with tie lines ten times wider, at nominal heights of 120-200 m above ground.
- A Wyoming State Geological Survey proposal put a statewide airborne magnetic and radiometric survey near US$20 million; adding EM and gravity gradiometry raised it to about US$200 million.
- Check public data first, such as Ireland’s finished Tellus airborne survey (over 440,000 km flown), before paying for a new survey.
In this article
- How a geophysical survey works: physical properties and contrasts
- Potential-field methods: magnetic and gravity surveys
- Radiometric surveys: mapping the surface chemistry from the air
- Electrical and electromagnetic methods: EM, MT, resistivity and IP
- Geophysical seismic surveys and ground-penetrating radar
- Planning a geophysical survey program: from satellite to drill
- What drives geophysical survey cost, and how satellite screening cuts it
- Frequently asked questions
Rocks differ in how magnetic, dense, conductive, chargeable and radioactive they are. A geophysical survey measures those differences from the air or the ground and turns them into maps and 3D models of what lies beneath cover. Below: each major method (magnetics, gravity, radiometrics, electromagnetics, resistivity and induced polarisation, seismic and ground-penetrating radar), what it can and cannot see, how to plan a program, what drives the cost, and where satellite data fits before the first line is flown.
Methods Mag · Gravity · Rad · EM · IP · Seismic
Markets Australia · Canada · MENA
Audience Explorers, owners, investors
A geophysical survey measures a physical property of the Earth over an area: magnetism, density, electrical conductivity, chargeability, natural radioactivity or seismic velocity. Geologists use the result to infer the rocks, structures and possible mineralisation hidden below soil, sand, water or younger rock. In mineral exploration it is the bridge between surface mapping and drilling. It tells you where the geology changes underground and which of those changes deserve a drill hole.
No single method finds every deposit. Gold in a shear zone, copper in a porphyry, nickel sulphide in a mafic intrusion and a heavy-mineral sand all show up in different physical properties. Choosing the right geophysics for mineral exploration starts with a clear idea of the target, the host rocks and the cover. Geophysics sits in the middle of the wider mineral exploration sequence, after mapping and before drilling. We take each method in turn, then show how to build a program that spends money only where it matters.
“Airborne radiometric surveys read gamma rays from roughly the top 30 centimetres of soil and rock.”
Geophysics measures contrasts, not minerals. A magnetic survey finds rocks with more or less magnetite than their neighbours; an IP survey finds rocks that hold charge. Whether that contrast is ore, barren pyrite, graphite or clay is a geological interpretation, and it has to be tested.
How a geophysical survey works: physical properties and contrasts
Every geophysical survey follows the same logic. A sensor measures a field or a response at many points, along flight lines, on a ground grid or down a borehole. The data are corrected for known effects such as aircraft height, terrain, daily variation or instrument drift. What remains is an anomaly map: the places where the property is higher or lower than expected. Geophysicists then model those anomalies in 2D or 3D to estimate the shape, depth and strength of the source.
Methods fall into two families. Passive methods measure natural fields: the Earth’s magnetic field, gravity, natural gamma radiation, and the natural electric and magnetic variations used in magnetotellurics. Active methods put energy into the ground and measure the response: electrical current for resistivity and IP, a transmitted electromagnetic signal for EM, sound waves for seismic, and radar pulses for GPR. Active methods usually cost more per kilometre but can be tuned to the target.
- Magnetic: measures variations in the Earth’s magnetic field caused mainly by magnetite in the rocks.
- Gravity: measures small changes in gravitational acceleration caused by density differences.
- Radiometric: measures natural gamma rays from potassium, uranium and thorium at the surface.
- Electromagnetic (EM): induces currents in conductive rocks and measures the secondary field.
- Resistivity and IP: injects current to measure how easily rocks conduct and how much charge they hold.
- Seismic: times sound waves reflected or refracted by layers and structures.
- Ground-penetrating radar: sends radar pulses into the shallow subsurface and records the echoes.
Geophysical mapping and non-intrusive exploration
Geophysical mapping is the step that turns thousands of readings into a gridded image, so the property can be read across the whole block at once. The US Geological Survey’s Earth MRI programme describes airborne magnetic and radiometric mapping as measurements taken from an aircraft with a sensor mounted underneath, used to infer rock types, structures and what lies below the surface (USGS Earth MRI). Because the sensors only record fields and rays, these are non-intrusive methods: no trenches, no drilling and little ground disturbance. That helps on claims where access, permits or landholder consent limit what can be dug. A geophysical map shows anomalies, not orebodies; every anomaly still needs sampling.
Potential-field methods: magnetic and gravity surveys
Magnetic surveys
The magnetic method is usually the first geophysical survey flown over a new district. It is fast, relatively cheap per line-kilometre and very good at mapping geology under cover. The US Geological Survey describes aeromagnetic anomalies as variations in the Earth’s field caused by the uneven distribution of magnetic minerals, primarily magnetite, in the upper crust. The patterns reveal buried faults, magnetite-bearing rocks and the thickness of generally non-magnetic sedimentary cover. Our guide to geomagnetic survey specifications covers line spacing, flying height and map products.
Chart
Flight-line spacing in magnetic surveys
Metres between flight lines
For explorers, that means magnetics maps the architecture: greenstone belts, intrusions, dykes, shear zones and folds. Hydrothermal alteration can destroy or create magnetite, so a magnetic “low” along a fault can be as interesting as a “high”. Surveys are flown by fixed-wing aircraft, helicopters or drones, and walked on the ground with a magnetometer for detailed follow-up.
Line spacing is the specification that matters most. Geoscience Australia’s magnetics page notes that before 1990 most Australian surveys were flown at 1,500 m spacing or wider, while surveys since 1990 have usually used 400 m or less, at under 100 m above ground. Its national grids draw on 33.5 million line-kilometres from more than 1,200 surveys (figures as published on that page; check it for newer grid editions). Its airborne EM page gives the two extremes for EM: about 200 m for targeted company surveys, and 20 km for the national AusAEM program.
Spacing converts directly into line-kilometres, and line-kilometres are what contractors price. The estimator below turns an area and a spacing into flown kilometres, then applies your own quoted rate. The rate in it is only an example; rates move with fuel, aircraft availability and terrain, so replace it with a current quote.
Gravity surveys
A gravity survey measures tiny changes in the pull of gravity caused by differences in rock density. The US EPA’s gravity-method page explains that it records how subsurface density variations affect gravitational acceleration, measured with a gravimeter in Gal units (0.01 m/s²); practical surveys work in milliGal or microGal because the anomalies are so small. After corrections for latitude, elevation and terrain, the result is usually shown as a Bouguer anomaly map.
How small is small? A University of British Columbia course note on gravity puts the Earth’s total pull at about 978,000 mGal at the equator, and says ore bodies in mineral exploration may cause anomalies of around 1 mGal. Latitude alone changes gravity by roughly 5,000 mGal from equator to pole, and Earth tides by up to 0.3 mGal. That is why gravity survey geophysics lives or dies on its corrections.
Dense bodies such as massive sulphides, iron ore and mafic intrusions produce gravity highs, while sedimentary basins and some altered zones produce lows. A ground gravity survey collects readings at stations, and each station needs a very precise elevation, which is why gravity is slower on the ground than magnetics. Airborne gravity and gravity gradiometry cover larger areas faster. Geoscience Australia’s national gravity grid combines 1,430,447 ground observations with 451,000 line-km of airborne gravity and gradiometry (as stated on its gravity page; the grid is updated as surveys are added).
Don’t treat a gravity or magnetic model as a unique answer. The EPA notes that a distribution of small masses at shallow depth can produce the same gravity effect as a large mass at depth. Potential-field models are non-unique; they need geology, other methods or a drill hole to pin them down.
Airborne gravity gradiometry
Airborne gravity gradiometry (AGG) measures how gravity changes from point to point rather than gravity itself, which suits a moving aircraft. A BHP paper on the method records that Sander Geophysics flew the first AGG survey in October 1999 over the Bathurst camp in New Brunswick, and that a commercial full-tensor system flew its first survey in early 2003 (Dransfield, Advances in Airborne Geophysics). The same paper explains that filtering to cut noise also removes short-wavelength detail. So when you compare AGG providers, ask which system flew, the noise level after filtering and how close to the ground it flew, not only the price per line-kilometre.
Calculator
How many line-kilometres will my survey need?
Enter your own block size, spacing and quoted rate.
- Line-km per square kilometre: 5.50
- Total at your rate, with mobilisation: $2,355,000
- Cost per square kilometre: $287
Example values only, not a benchmark. Line-km equals area divided by line spacing, plus tie lines at the multiple you set; the default 200 m and ten times ties follow the USGS Earth MRI Idaho-Montana release, 2023-2024 (about 46,000 line-km reported over about 8,200 km2). Turns, ferry flights and reflights are excluded. Rate and mobilisation are examples; use your contractor’s quote.
Radiometric surveys: mapping the surface chemistry from the air
A radiometric, or gamma-ray spectrometric, survey is passive. A crystal detector in an aircraft counts natural gamma rays and splits them by energy into potassium, uranium and thorium channels. Geoscience Australia describes radiometrics as estimating the concentrations of these three radioelements. Gamma rays travel only a short distance through rock, so the signal comes from roughly the top 30 centimetres of soil and rock. Surveys are typically flown 40–150 metres above the ground.
- Potassium highs can outline potassic alteration around porphyry and some gold systems.
- Thorium and potassium ratios help separate granite phases and map regolith.
- Uranium channel is a direct first-pass tool in uranium exploration.
- ⚠ Limitation: it is a surface method. Transported cover, water and dense vegetation mask the signal from bedrock.
Magnetics and radiometrics are usually flown together on the same aircraft, which is why many geological surveys publish them as a pair.
Radiometric measurement: why flight height matters
Government surveys show how much height varies. USGS Earth MRI flew a nominal 120 m above ground in Florida and Georgia (USGS data release) and 200 m in the mountains of Idaho and Montana, with populated areas at 330 m for safety (USGS data release). Gamma-ray counts fall as the sensor rises, so ask for the height actually flown, the detector crystal volume and the survey date before comparing two radiometric maps.
Electrical and electromagnetic methods: EM, MT, resistivity and IP
Electromagnetic surveys
Geoscience Australia describes airborne electromagnetics (AEM) as transmitting a signal from a system on a plane or helicopter; a secondary field is induced in conductive rocks and measured from the same aircraft. Conductors include massive sulphides, graphite, saline groundwater and clay-rich regolith. Time-domain and frequency-domain systems exist in the air and on the ground, and downhole EM tests whether a drill hole narrowly missed a conductor. For system choice and depth of investigation, see our guide to TEM, VTEM and CSAMT surveys.
Magnetotellurics
Magnetotellurics (MT) is passive. It uses natural time variations of the Earth’s magnetic and electric fields to measure resistivity at depth. It sees much deeper than most EM systems and is used to map crustal-scale structures that may have channelled mineralising fluids.
Resistivity and induced polarisation
Resistivity and IP are the workhorses of ground-based sulphide exploration. Current is injected through electrodes, and the voltage is measured while the current flows (resistivity) and after it switches off (chargeability, the IP effect). Finely disseminated sulphides produce strong IP responses, which is why the method has been central to porphyry copper exploration since the 1950s and is widely used for intrusion-related gold and IOCG targets. Clays and graphite can respond too, a common source of false targets. Modern DCIP surveys are often inverted in 3D. Our resistivity and IP survey guide goes through arrays, chargeability and SP.
Before you pay for a ground IP grid, narrow the area. A satellite alteration map can show where clay, iron-oxide and other alteration minerals are concentrated at surface, so the IP lines cross the most prospective ground first. Draw your licence on mining.farmonaut.com: Map Your Mining Site to start.
Geophysical survey instruments at a glance
Most of what a contractor brings to site falls into a handful of instrument types. Knowing them helps you read a proposal and ask the right questions about sensitivity and data quality.
- 🧲 Magnetometers measure the strength of the magnetic field. A second, stationary base-station magnetometer records daily variation so it can be removed from the survey data.
- ⚖ Gravimeters measure tiny differences in gravitational acceleration. Readings are tied to base stations and paired with high-precision GPS elevations.
- ☢ Gamma-ray spectrometers are large detector crystals that count gamma rays and sort them into potassium, uranium and thorium energy windows.
- 📡 EM transmitters and receivers are loops or coils that send a signal and record the ground’s secondary response, on aircraft, on the ground or down a drill hole.
- 🔌 Resistivity/IP systems pair a transmitter that drives current through electrodes with multichannel receivers that record voltage and decay.
- 📶 Seismographs and GPR units use geophones for seismic waves and antennas of a chosen frequency for radar.
Geophysical seismic surveys and ground-penetrating radar
A seismic survey sends sound waves into the ground and times their return from layers and structures. Geoscience Australia calls seismic (refraction, reflection and passive methods) the principal geophysical method it uses to image the Earth’s crust at depth; its 2015 Boulia land survey alone acquired 700 km of deep crustal seismic in Queensland. In mineral exploration, reflection seismic is expensive and used mainly for deep structural targets and mine-scale planning. Refraction is cheaper and useful for cover thickness and bedrock depth. Passive seismic uses ambient noise to estimate depth to bedrock quickly.
Ground-penetrating radar works at the other end of the depth scale. The US EPA’s GPR page notes typical systems operate between 25 and 1,500 MHz and that penetration can reach tens of metres in ideal materials such as dry sand and gravel. In conductive ground (saturated clays or saline water) the depth of investigation can shrink to centimetres. GPR is valuable for mapping shallow layers and old channels, not for finding ore at depth.
“In saturated clay or saline ground, radar penetration can shrink to centimetres, according to the US EPA.”
Planning a geophysical survey program: from satellite to drill
The most efficient programs are staged, moving from cheap, wide coverage to expensive, focused work. Each stage narrows the ground so the next, costlier method is used only where it is justified.
- Desktop and satellite screening. Compile public geological maps (our guide to geological mapping methods and scales covers how to read them) and any government geophysics, then screen the whole area with satellite imagery for alteration and structure.
- Regional airborne survey. Magnetics and radiometrics, sometimes EM, at wide line spacing to map geology under cover.
- Target-scale ground geophysical surveys. Detailed ground magnetics, gravity, IP or EM grids over the best anomalies.
- Integrated 3D modelling. Joint interpretation of geophysics, geochemistry and geology to rank targets.
- Drill testing. Holes designed to intersect the modelled source, often followed by downhole EM or other borehole geophysics.
| Method | Platform | Relative coverage speed | Main cost drivers | Best stage |
|---|---|---|---|---|
| Satellite multispectral / hyperspectral | Orbit | Very fast, whole licence | Area, data type, analysis depth | First pass, before any survey |
| Magnetics + radiometrics | Aircraft, drone, ground | Fast (airborne) | Line-km, line spacing, mobilisation | Regional mapping |
| Gravity | Ground stations, airborne | Slow on ground, faster airborne | Station count, precise elevation survey | Density targets, basin depth |
| Electromagnetics | Aircraft, ground loops, downhole | Moderate | System type, line-km, terrain | Conductive sulphide targets |
| Resistivity / IP | Ground electrodes | Slow | Line-km, crew days, access | Disseminated sulphide targets |
| Seismic | Ground lines | Slow | Line-km, sources, processing | Deep structure, cover depth |
| GPR | Ground, handheld or towed | Moderate, very shallow | Area, antenna frequency | Shallow layers, placer channels |
Borehole geophysics
Once holes are drilled, probes lowered down the hole measure the same properties at close range: natural gamma, density, magnetic susceptibility, resistivity and downhole EM. Borehole data calibrate the surface geophysical survey, showing what a given anomaly actually corresponds to in the rock. Downhole EM can also detect a conductor that a hole passed close to but missed.
Choosing geophysics for mineral exploration by deposit type
The table above is organised by method. Owners usually think the other way round, starting from the commodity. These pairings are common starting points, but the host geology always decides the final program.
- Orogenic gold: magnetics for shear zones and folds, IP for associated sulphides, radiometrics for potassic alteration; satellite mapping for iron-oxide and clay alteration at surface.
- Porphyry copper-gold: magnetics for the intrusive centre, IP for the sulphide shell, radiometrics for potassic cores; satellite SWIR data for clay-sericite zoning.
- Massive sulphides (VMS, nickel): EM for conductive bodies, gravity for dense lenses, downhole EM around drill holes.
- Iron ore: magnetics and gravity, since magnetite and hematite ores are dense and often strongly magnetic.
- Uranium: radiometrics first, then EM or resistivity to map the host structures and conductors.
- Placer and paleochannel gold: passive seismic, GPR or resistivity to map channel geometry and depth to bedrock.
A company that “has geophysics” has not proven a deposit. Ask what method was used, what contrast it detected, whether the anomaly was modelled, and whether it has been drilled. An untested anomaly is an exploration target, not a resource. The same applies when a vendor lists old survey results as a selling point; our checks before buying a gold claim cover what to ask.
3D geophysical surveys and inversion
A 3D geophysical survey usually means a survey designed and processed to produce a volume model rather than a flat map. Inversion software searches for a distribution of physical properties underground that would reproduce the measured data. The output, a block of predicted susceptibility, density, conductivity or chargeability, can be sliced, contoured and loaded into the same 3D environment as the geology and drill holes.
Inversion is powerful but it is still a model. Different starting assumptions give different answers, and the results are most reliable near the survey lines and at shallow to moderate depth. Constrain inversions with known geology, rock-property measurements from core and, where available, drill intersections.
Reading a geophysical map
Most owners first meet their geophysical map as a colourful image in a report. A few habits make these maps far more useful. Check the colour stretch and legend; a strong-looking red spot can be a small absolute change. Look for linear breaks and offsets, which often mark faults. Compare the anomaly with topography and cultural features such as power lines, fences and roads, which can create false responses. Then ask whether the anomaly has been modelled and at what depth its source sits.
Ground geophysical surveys: when to leave the aircraft
Ground geophysical surveys give the sharpest picture of a single target but are slow, so they come after airborne work. Typical follow-up is a ground magnetic or gravity grid, an IP line, a ground EM loop or a short seismic line across the anomaly. Plan it as a second phase that covers only the airborne anomalies you rank highest.
What public airborne surveys actually specify
Government data releases are a useful benchmark when you read a contractor’s proposal. Two recent USGS Earth MRI magnetic and radiometric surveys show typical choices.
| Survey | Platform | Line / tie-line spacing | Nominal height | Data collected |
|---|---|---|---|---|
| East-central Idaho and Montana, 2023-2024 | Helicopter (mountains) | 200 m / 2,000 m | 200 m (330 m near people) | About 46,000 line-km over about 8,200 km2 |
| Central and northern Florida and southeastern Georgia, 2023-2024 | Fixed-wing | 250 m / 2,500 m | 120 m (330 m near people) | 121,182 line-km |
Source: USGS data releases. In the Idaho and Montana release, 200 m lines with tie lines ten times wider work out at 5.5 line-km for every square kilometre (the release’s own totals, 46,000 line-km over 8,200 km2, give about 5.6), and 5.5 is the ratio the calculator further down uses.
3D geophysical survey design
A 3D model can only resolve what the sampling can see. A body narrower than the line spacing can slip between flight lines, so tighten the spacing, or add a ground grid, over the anomalies you plan to invert in 3D. Specialist packages such as Seequent Oasis montaj are sold for processing and interpreting magnetic, gravity, EM and other geophysical data; ask any contractor which software and version produced the final models.
Geophysical survey in Ireland
Ireland’s Tellus programme, run by Geological Survey Ireland, flew its final airborne line in 2026 after 16 years and more than 440,000 km, collecting magnetic, electromagnetic and natural radioactivity data across the country (Government of Ireland, 24 June 2026). Tellus data can be viewed through the survey’s Tellus data viewers, so check what is already mapped over your ground before paying for a new survey.
▶ Remote sensing for mining in about two minutes: the instrument families and why agreement between them matters. · 2:01
What drives geophysical survey cost, and how satellite screening cuts it
Contractors quote a geophysical survey per line-kilometre (airborne and most ground methods), per station (gravity) or per crew-day, plus mobilisation, processing and reporting. Prices move with fuel, aircraft availability, terrain, remoteness and the specification, so check any published rate against current quotes. The biggest lever you control is how much ground each expensive method has to cover.
Chart
Public price points for airborne surveys
US$ million, Wyoming State Geological Survey proposal
Chart
Line-kilometres needed for a 100 km2 block
Calculated from line spacing; tie lines at ten times the spacing, as in the USGS Idaho-Montana survey
- Area and line spacing: halving line spacing roughly doubles line-kilometres (the estimator above shows it).
- Terrain and access: mountains, forest and swamps slow ground crews and raise airborne costs.
- Mobilisation: getting aircraft or crews to remote sites is a fixed cost that favours doing more in one campaign.
- Processing and 3D inversion: worth paying for, but scope it clearly.
- ✔ Targeting first: a ranked target map lets you fly or walk detailed surveys only over the best zones.
That last point is where we fit. Our satellite-based mineral detection analyses multispectral and hyperspectral imagery of your boundary to flag likely mineralised target zones, alteration halos and structures such as faults and fractures. It does not replace magnetics, gravity or IP. It tells you where to point them.
- ✔ Input: coordinates, KML/KMZ or a polygon, plus country and target mineral.
- ✔ Turnaround: 5–20 business days depending on size and mineral complexity.
- 📊 Deliverables: prospectivity heatmaps, high-potential zones with estimated location and depth ranges, geological interpretation, and PDF plus georeferenced GIS files your geophysicist can overlay on survey data.
- Premium+: TargetMax™ drilling intelligence with drilling-angle recommendations and 3D subsurface models.
- 📊 Economics: timelines from months to days, and up to 80–85% lower early-exploration cost.
See a sample of the satellite-driven 3D mineral prospectivity mapping output, or request a price through our mining query form. We have scanned 100,000+ hectares for 20+ mineral types across 25+ countries.
Airborne and satellite methods disturb nothing on the ground. Ground IP and seismic need line access and electrodes or sources, so narrowing their footprint with remote data first reduces vegetation clearing, vehicle tracks and community disruption.
Plan your geophysical survey around the best targets.
Send us your licence boundary. We’ll return a satellite prospectivity read (alteration, structure and ranked zones) so your survey lines cross the ground most likely to matter.
Start with public government geophysics
Before commissioning any new work, check what already exists. Geoscience Australia and the Australian state and territory geological surveys publish regional magnetic, radiometric, gravity and airborne EM data, and many other national surveys do the same. Regional grids are usually too coarse for drill targeting, but they show the big structures and help you decide where a new, tighter geophysical survey will add the most.
Geophysical testing and investigation outside exploration
The same tools are used for geophysical testing and geophysical investigation in engineering and environmental work: finding bedrock depth for foundations, locating voids and karst, mapping groundwater and landfills, and checking tailings dams. The US EPA lists bedrock depth, void detection, landfill mapping and site characterisation among typical gravity applications, and the UBC notes put a geotechnical gravity target at around 20 microGal. For a mine, this matters at the development stage, when geotechnical and hydrogeological consultants reuse exploration geophysics for infrastructure siting.
Choosing geophysical survey companies
Need geophysical survey services in Australia, Canada or the Middle East and North Africa? The same checks apply to any firm offering geophysical surveying and mapping services. Ask for comparable surveys in similar terrain and target type, the exact instrument specifications, the QA/QC procedure (repeat lines, base-station records, noise levels), the processing and inversion deliverables, and who will interpret the data. Separate the acquisition contract from interpretation if you want an independent read, for example from one of the mining consultants who sign CP and QP reports.
- Specify the deliverables: raw and processed data in open formats, grids, profiles, inversion models and a logistics report.
- Define line direction and spacing based on the strike of the target geology.
- ⚠ Check permits: low-level flying, drone operations and ground access usually need approvals and landholder consent.
The best geophysical maps are the ones interpreted alongside geology and surface data. Overlay magnetics, gravity or IP on satellite alteration and structure maps, and targets that line up in two or three independent datasets rise to the top of the drill list.
Guides in this series
Four guides take single methods from this geophysical survey overview further.
- Geomagnetic survey specs: ground and aeromagnetic grids, line spacing, flying height and the maps you should get back.
- Electromagnetic survey methods: TEM, VTEM and CSAMT systems and how deep each one sees.
- Electrical resistivity geophysics: electrode arrays, IP chargeability and self potential.
- Airborne geophysical survey platforms and contractors: helicopter, fixed-wing and drone options, survey specs and how to pick a contractor.
Published survey price points
Public price figures are rare, and contractor rates vary. One dated reference is a Wyoming State Geological Survey proposal to the state legislature. It says airborne surveys are priced by flight-line distance, that a radiometric and magnetic survey of the whole state at about 200 m spacing would cost about US$20 million, and that adding electromagnetics and airborne gravity gradiometry would raise it by an order of magnitude to about US$200 million. It also notes that per-kilometre cost falls on large surveys, and that a smaller USGS-contracted survey in the Medicine Bow Mountains was priced at US$500,000 (Wyoming State Geological Survey, proposal). Treat these as scale markers, not quotes: they are public-agency programmes of a different size to a single licence.
For a licence-sized block, the main numbers to request are line-kilometres, the rate per line-kilometre, mobilisation, processing and the interpretation fee. The calculator below turns your spacing and area into line-kilometres so you can check a quote against your own block.
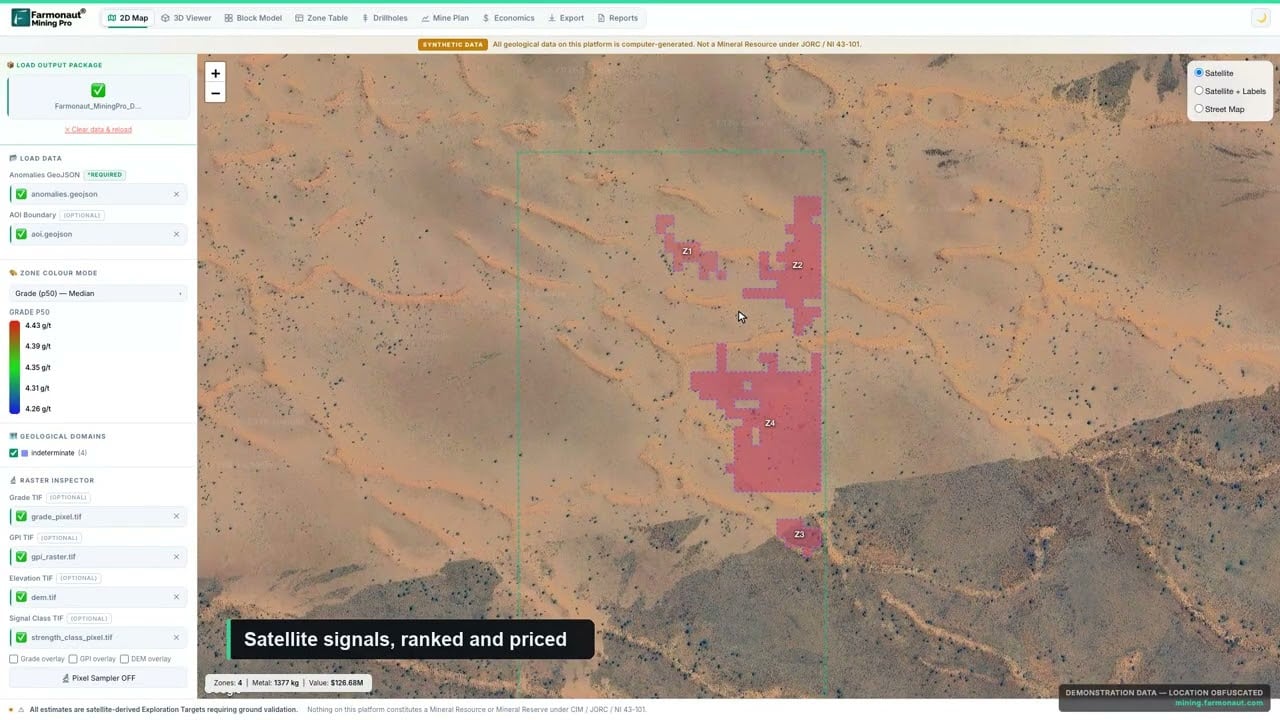
▶ A quick look at Farmonaut Mining Pro, which turns a licence boundary into a geological and economic picture. Demo data only. · 4:56
Frequently asked questions
What is a geophysical survey in mineral exploration?
A geophysical survey measures a physical property of the ground, such as magnetism, density, conductivity, chargeability or natural radioactivity, across an area to map rocks, structures and possible mineralisation beneath the surface. It helps decide where to drill.
What is a gravity survey used for in geophysics?
A gravity survey maps differences in rock density. Dense bodies such as massive sulphides, iron ore or mafic intrusions create gravity highs, while basins and some altered zones create lows. Ore bodies may give anomalies of only about 1 mGal, so careful corrections are essential. It is also used to estimate the depth of sedimentary cover.
What do ground geophysical surveys add after an airborne survey?
Detail. Airborne magnetics and radiometrics map the geology across a district; ground magnetics, gravity, IP or EM grids are then laid over the best anomalies to resolve their shape and depth. A ground gravity survey, for example, reads individual stations with precise elevations, which is slower than flying but sharper over a single target.
Which geophysical method is best for finding gold?
There is no single gold method, because gold rarely creates a strong geophysical signal on its own. Magnetics maps the faults and shear zones that often host gold, IP can detect associated disseminated sulphides, and radiometrics can show potassic alteration. Satellite alteration mapping helps choose where to run them.
How much does a geophysical survey cost?
Costs depend on the method, area, line spacing, terrain, mobilisation and processing. Contractors usually quote per line-kilometre, per station or per crew-day. Narrowing the survey area with satellite targeting first is one of the most effective ways to lower the total.
Can ground-penetrating radar find ore bodies?
GPR is a shallow method. The US EPA notes penetration can reach tens of metres in dry sand and gravel but only centimetres in saturated clay or saline ground. It is useful for mapping shallow layers and old channels, not deep ore bodies.
Does satellite mineral detection replace geophysics?
No. Satellite analysis maps surface and near-surface alteration and structure over a whole licence quickly and without ground disturbance. Geophysics then images the subsurface over the best targets. Used together, they reduce the area each costly method must cover.
Survey pricing varies with market conditions, terrain and specification; obtain current quotes from contractors. National data volumes and line spacings are as published by Geoscience Australia when checked. Anomalies from any geophysical or satellite survey are exploration targets, not mineral resources, and must be tested by sampling and drilling.
What does geophysical mapping mean?
Geophysical mapping is the process of turning survey readings (magnetic, gravity, radiometric, EM or resistivity) into gridded maps and sections that show how rock properties change across an area. Geologists then interpret the patterns as rock units, faults and possible mineralised zones.
What public prices exist for airborne geophysical surveys?
It depends on method, area, line spacing, terrain, mobilisation and processing, and contractors quote per line-kilometre, per station or per crew-day. A Wyoming State Geological Survey proposal put a statewide airborne magnetic and radiometric survey at about US$20 million and the same survey with EM and gravity gradiometry at about US$200 million, so ask for a written quote for your own block.

▶ How satellites help find gold when they cannot see it: they map the rock around it. · 4:25
This page is for information only. It is not investment advice. Survey prices change with fuel, aircraft availability, terrain and specification; get written quotes. Anomalies from any geophysical or satellite survey are exploration targets, not mineral resources, and must be tested by sampling and drilling. Confirm permits for flying, drones and ground access with the regulator and landholders.
Farmonaut mining
Screen your ground before you fly it
Request a quote for a satellite prospectivity read of your licence boundary, so survey lines cross the ground most likely to matter.

Mining Pro sample view, synthetic data
Keep reading
Sources
- Geoscience Australia, Magnetics: ga.gov.au
- Geoscience Australia, Gravity: ga.gov.au
- Geoscience Australia, Airborne electromagnetics: ga.gov.au
- USGS Earth MRI, Geophysical mapping: usgs.gov
- USGS, Airborne magnetic and radiometric survey, east-central Idaho and Montana, 2023-2024: usgs.gov
- USGS, Airborne magnetic and radiometric survey, Florida and southeastern Georgia, 2023-2024: usgs.gov
- Wyoming State Geological Survey, Statewide airborne geophysical survey proposal: wyoleg.gov
- Government of Ireland, Ireland completes airborne geophysics survey (24 June 2026): gov.ie
- Geological Survey Ireland, Tellus data guidance note: gsi.geodata.gov.ie
- Dransfield (BHP), Airborne gravity gradiometry in the search for mineral deposits: 911metallurgist.com
- US EPA, Electrical resistivity: epa.gov
- US EPA, Seismic reflection: epa.gov
- Seequent, Oasis montaj: seequent.com
Discussion
Questions, corrections or field experience? Share them below. First-time comments are reviewed before they appear, and your email is never published.
No comments yet. Be the first to add a question or your experience.

 Mulopwe Metals Mining Ltd
 Tintina Mining Group
 Dalgety Minerals Pty Ltd
 Vortex Minerals Pty Ltd
 Faith At Work (Pty) Ltd
 Geotech Mining Solutions plc
 Vulcan International Limited
 Kidepo Associates
 GKY Mining
 Alkimy SARL
 Double A Trading
 GemSprout Metals Limited
 Qader Group
 Ileys General Trading
 SG Gold Mining LLC
 VRV Global Pte Ltd
 Omsri International FZE
 G.I.T.T.
 Jaunita Erss Ltd
 Almosi SARL
 SRK Consulting
 Berks Gold Limited
 Mwerezi Minerals Company Limited

 Exploration consultancy · South Africa · Gold










