

Ore deposit types · Geology guide
Types of Ore Deposits: Grades, Tonnages and Examples
Ore deposits fall into four families: magmatic, hydrothermal, sedimentary and weathering. Porphyry copper, the largest hydrothermal type, has a median grade of 0.44% copper (USGS, 2008); epithermal gold can exceed 40 g/t.
Key takeaways
- Four families cover about a dozen deposit types, each with a typical size, grade and set of by-products (USGS deposit models).
- Porphyry copper deposits supply about 60% of world copper at a median grade of only 0.44% (USGS, 2008).
- Big hydrothermal deposits tend to have lower grades: IOCG breccia ores have a median of 120 Mt at 1.1% Cu, vein ores 3.5 Mt at 2.3% Cu (USGS).
- Brines hold 58% of world lithium resources and pegmatites 26% (USGS Professional Paper 1802-K, 2017).
- The Witwatersrand paleoplacer has produced more than 52,000 t of gold, about 32% of all gold ever mined (Frimmel and Hennigh, 2015).
In this article
- The four families of ore deposits
- How deposit type changes mining returns
- Magmatic ore deposits: layered intrusions, kimberlites and pegmatites
- Hydrothermal ore deposits: porphyry, VMS, epithermal, orogenic, IOCG, skarn and MVT
- Sedimentary ore deposits: sediment-hosted copper, iron formations, placers and brines
- Weathering deposits: laterites and supergene enrichment
- Which type of deposit is most valuable to mine?
- Screening ground by deposit type from space
- Frequently asked questions
Ore deposits fall into four families: magmatic (metal concentrated by cooling magma), hydrothermal (metal dropped by hot fluids), sedimentary (metal gathered by water at the surface) and weathering deposits (metal enriched by rain and heat). Inside those families sit about a dozen deposit types (a deposit type is a recurring recipe of rock, fluid and structure), and each has a typical size and grade. A porphyry copper deposit has a median grade of only 0.44% copper, yet it can hold hundreds of millions of tonnes. A Merensky-type platinum reef grades roughly 4 to 6 grams per tonne but is only centimetres to metres thick.
This guide goes through each type in turn, with real example deposits and typical grades and tonnages from US Geological Survey (USGS) deposit models. It then shows how the type changes mining returns, because a deposit’s family tells you its likely size, grade, depth, by-products and mining method before a single drill hole is logged. Two terms first: grade is the share of valuable metal in the rock (per cent, or grams per tonne for gold and platinum), and tonnage is how much rock holds that grade. “Mt” means million tonnes.
The four families of ore deposits
A deposit becomes ore only when the metal is concentrated far above its average in the crust and the rock can be mined at a profit. Geologists group the ways that happens by process. The table below lists the main types, the metals each one yields and one famous example. Figures are medians or averages from the USGS model named in the last column, so a single deposit can sit far above or below them.
| Family | Deposit type | Main metals | Example | Typical figure (USGS) |
|---|---|---|---|---|
| Magmatic | Layered intrusion | Platinum-group metals, chromium, nickel | Bushveld Complex, South Africa | Merensky Reef about 6 g/t in the west, 4.2 g/t in the east |
| Magmatic | Nickel-copper sulfide | Nickel, copper, platinum-group metals | Sudbury, Canada | 19.8 Mt of contained nickel in the district |
| Magmatic | Kimberlite and lamproite | Diamonds | Argyle (lamproite), Australia | Diamonds carried up from the mantle |
| Magmatic | Lithium pegmatite | Lithium, tantalum, caesium | Greenbushes, Australia | 6.16 Mt of ore at 1.9% Li2O mined in 2025 |
| Hydrothermal | Porphyry copper | Copper, molybdenum, gold | Bingham Canyon, Utah | Median 0.44% Cu (2008, 422 deposits) |
| Hydrothermal | Volcanogenic massive sulfide (VMS) | Copper, zinc, lead, silver, gold | Rio Tinto, Spain | Felsic type: median 3.0 Mt, 1.2% Cu, 3.2% Zn |
| Hydrothermal | Epithermal | Gold, silver | Hishikari, Japan | About 7.4 Mt at 46 to 47 g/t gold |
| Hydrothermal | Orogenic gold | Gold | Gold belts in mountain ranges worldwide | Total of just over 1 billion oz of gold in Phanerozoic deposits (production plus resources, not a grade) |
| Hydrothermal | Iron oxide copper-gold (IOCG) | Copper, gold, uranium, iron | Olympic Dam, Australia | Breccia type: median 120 Mt at 1.1% Cu |
| Hydrothermal | Skarn | Copper, zinc, molybdenum, tungsten | Antamina, Peru | Skarn zone up to 1,000 m wide |
| Hydrothermal | Mississippi Valley-type (MVT) | Zinc, lead | Navan, Ireland | Median 7.0 Mt, 1.9% Pb, 6.0% Zn |
| Sedimentary | Sediment-hosted copper | Copper, cobalt, silver | Central African Copperbelt | 2.59% Cu average (reduced-facies type) |
| Sedimentary | Banded iron formation | Iron | Hamersley Province, Australia | Giant hematite deposits in iron formation |
| Sedimentary | Placer and paleoplacer | Gold, tin, heavy minerals | Witwatersrand, South Africa | More than 52,000 t gold mined |
| Sedimentary | Brine and evaporite | Lithium, potash, salts | Salar de Atacama, Chile | Brines hold 58% of lithium resources (USGS, 2017) |
| Weathering | Nickel-cobalt laterite | Nickel, cobalt | Tropical ultramafic belts | Median 56 Mt at 1.3% Ni |
Sources for each row are given in the sections below. Gold-specific types (Carlin, greenstone, epithermal and others) are covered in more depth in our guide to types of gold deposits, and the lithium pegmatite family has its own page on pegmatite deposits, so this page keeps those short.
How deposit type changes mining returns
Deposit type sets four things that drive returns: how much metal is in the ground, how rich it is, how deep and hard it is to reach, and which by-products pay part of the bill. Large, low-grade bodies such as porphyry copper, the source of about 60% of world copper production (USGS), are mined in huge open pits at low cost per tonne. Small, rich bodies such as epithermal veins or VMS lenses are mined underground or in small pits, where each tonne costs more but pays more.
Chart
Typical copper grade by deposit type
Per cent copper; medians for porphyry, IOCG and VMS, averages for sediment-hosted copper outside the Central African Copperbelt
The USGS grade-tonnage models show the trade-off clearly. Within the IOCG model, the bigger deposits carry lower grades. In the IOCG model, the breccia-hosted group has a median size of 120 Mt at 1.1% copper, while the vein-hosted group has a median of 3.5 Mt at 2.3% copper (USGS Open-File Report 2007-1155). The report suggests that large, lower-grade ore can be mined more cheaply by bulk methods, which is why a lower grade can still pay.
By-products also change the picture. About two-thirds of porphyry copper deposits recover gold, with a median by-product grade of 0.21 g/t, and about one-third recover silver at a median of 2.0 g/t (USGS Scientific Investigations Report 2010-5070-B). Sediment-hosted copper ranks first among all deposit types in world cobalt production and fourth in silver (USGS Scientific Investigations Report 2010-5070-M). A cost-per-tonne comparison that ignores by-products can rank two deposits the wrong way round.
Three more type effects matter for a licence owner or investor:
- Continuity. Layered intrusions and sediment-hosted beds continue for kilometres along strike, so a good drill hole at one end predicts the other. Epithermal veins and skarns are patchy, so drilling needs tighter spacing.
- Metallurgy. The same grade can be easy or hard to recover. Oxide copper from a weathered zone is leached cheaply, while a sulfide ore needs a concentrator.
- Decline in grade. The median porphyry grade fell from 0.49% copper in 2002 to 0.44% in 2008 which the USGS model says likely reflects smaller mined tonnages of supergene (enriched) ore. Deposit type tells you the starting grade, but not how long it lasts.
Cut-off grade, the lowest grade a mine treats as ore, then sets how much of the deposit counts as a resource. A cut-off falls when prices rise, which is why a deposit that is waste at one price becomes ore at another. For the economics of a whole mine, see our guide to mining profitability.
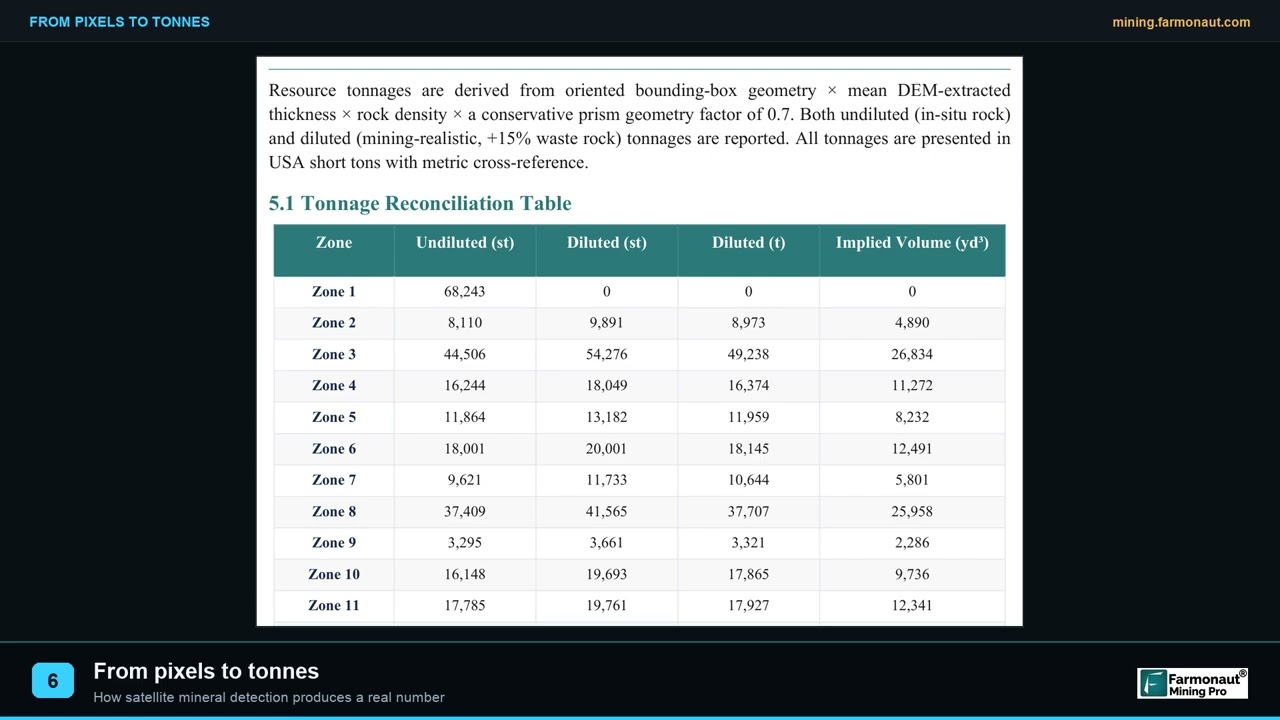
▶ How a satellite map becomes a tonnage and a grade, and which inputs are measured or assumed. · 2:54
Magmatic ore deposits: layered intrusions, kimberlites and pegmatites
Magmatic deposits form when molten rock sorts its own metal as it cools, or when it carries metal-rich minerals up from depth. Many are hosted by dark, iron- and magnesium-rich rocks such as layered intrusions and kimberlites; pegmatites are the light-coloured exception.
Layered intrusions: platinum-group metals and chromite
A layered intrusion is a giant sheet of magma that cooled slowly and settled into stacked layers. The Bushveld Complex in South Africa is the biggest, covering about 69,000 km2 and about 2,054 million years old. Its two reefs, the Merensky Reef and the UG2 Chromitite, run continuously along the western and eastern limbs. The USGS gives the UG2 grade as about 5 g/t of platinum-group metals and gold, the Merensky Reef as about 6 g/t in the west and 4.2 g/t in the east, and the contact-type Platreef as 0.55 to 3.7 g/t (USGS Professional Paper 1802-N).
Almost all reported platinum-group production and resources sit in three places: the Bushveld Complex, the Great Dyke in Zimbabwe and the Noril’sk-Talnakh area of Russia. Mining at Bushveld has recovered about 7,200 t of platinum-group metals since the 1920s, out of world resources of about 104,000 t. Layered intrusions return less per tonne than a gold vein, but a reef that can be traced along the whole strike of the complex gives a mine a long, predictable ore supply.
Magmatic nickel-copper sulfide
Where magma becomes saturated in sulfur it separates a heavy sulfide liquid that sinks and collects at the base of the intrusion. As of 2004, these deposits supplied about 60% of the world’s nickel production, with most of the rest coming from laterites; laterite output has grown since, and the USGS now puts nickel resources at 54% laterite and 35% magmatic sulfide (USGS Scientific Investigations Report 2010-5070-I; USGS Mineral Commodity Summaries 2026). The Sudbury district in Canada holds 19.8 Mt of contained nickel and the Noril’sk-Talnakh district in Russia holds 23.1 Mt. In the United States, the Duluth Complex in Minnesota has about 8 Mt of nickel but at low grades of about 0.2% nickel and 0.66% copper, so it is still being tested for economics. That contrast, huge metal but thin grade, is typical of magmatic sulfides outside the very best districts.
Kimberlites and lamproites: diamonds
Diamonds reach the surface in only three rare magma types: kimberlite, lamproite and lamprophyre. Kimberlites are by far the most important, with several hundred diamond-bearing examples known, while the Argyle mine in Australia sits in a lamproite (Gems & Gemology, GIA). The diamonds themselves are up to billions of years older than the magma that carried them up, and the host pipes occur in old continental cores called cratons. Grades are measured in carats per tonne, and value depends on gem quality more than on volume, so two pipes with the same grade can be worth very different amounts.
Pegmatites: lithium, tantalum and caesium
Pegmatites are coarse-grained granitic veins and dikes that crystallise last from a granite magma and concentrate rare elements. The USGS (2017) puts pegmatites (including lithium-enriched granites) at 26% of world lithium resources, against 58% in closed-basin brines (USGS Professional Paper 1802-K). Greenbushes in Western Australia is the standard example: in calendar 2025 it milled 6.16 Mt of ore grading 1.9% Li2O and made 1.35 Mt of spodumene concentrate, and its 2025 mineral resource stands at 457 Mt at 1.6% Li2O (IGO, Greenbushes resources and reserves, calendar 2025). Pegmatites are small compared with a porphyry, which is why they are better mapped on the ground than from orbit. Our pegmatite guide covers the two main families in full: LCT (lithium-caesium-tantalum) and NYF (niobium-yttrium-fluorine) pegmatites.
Hydrothermal ore deposits: porphyry, VMS, epithermal, orogenic, IOCG, skarn and MVT
Hydrothermal deposits form when hot, salty water dissolves metal at depth and drops it in cracks or reactive rock as it cools. This is the largest family by number of types and by metal supplied, and it is where most copper, zinc, lead and gold is found.
Chart
In the IOCG model, the bigger group grades lower in copper
Median tonnage against median grade for five USGS models
Porphyry copper
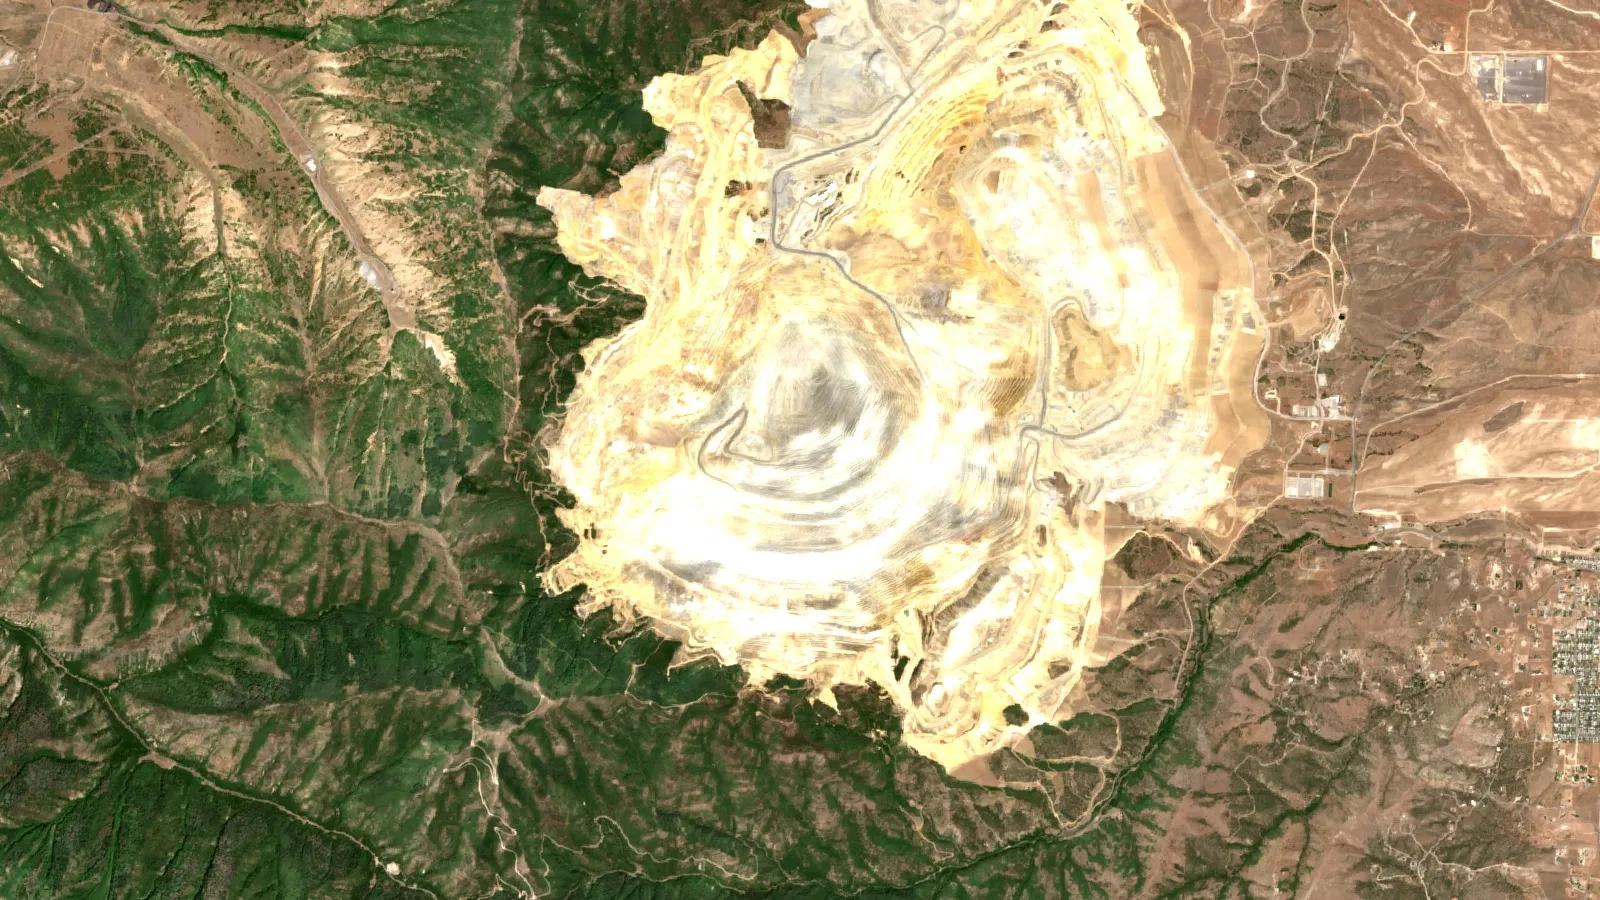
Porphyry deposits form around small granitic intrusions in volcanic arcs. They are low in grade but vast: the USGS describes them as commonly hundreds of millions to billions of tonnes, with copper grades of about 0.3% to 2%. In the 2008 compilation the median grade of 422 deposits was 0.44% copper, with a median of 0.013% molybdenum (USGS Scientific Investigations Report 2010-5070-B). Bingham Canyon in Utah is the best-known US example; its open pit is more than 0.75 mile (1,210 m) deep and 2.5 miles (4 km) wide (Kennecott). Alteration around a porphyry system is wide and colourful, which is why porphyries are among the best targets for multispectral satellite mapping. Our porphyry copper guide covers alteration zones and discovery.
Volcanogenic massive sulfide (VMS)
VMS deposits are lenses of sulfide that formed on or just below the seafloor, near hot vents. The USGS global database (867 deposits used for the models) splits them by host rock: felsic means silica-rich volcanic rock such as rhyolite, and mafic means dark, iron- and magnesium-rich rock such as basalt. Felsic VMS has a median of 3.0 Mt with 1.2% Cu, 3.2% Zn and 25 g/t Ag; bimodal-mafic has a median of 1.9 Mt with 1.4% Cu and 1.7% Zn; and mafic has 0.74 Mt with 1.7% Cu (USGS Open-File Report 2009-1034). Mafic deposits are the most copper-rich, and felsic ones are richer in zinc, lead and silver. A few reach huge size: the USGS lists Rio Tinto in Spain at 1.5 billion tonnes (USGS Scientific Investigations Report 2010-5070-C). VMS lenses are small and rich, so they are mined underground and need close-spaced drilling.
Epithermal gold and silver
Epithermal deposits form within about 1.5 km of the surface in volcanic terrain. They are usually small but high in grade. Hishikari in Japan has about 7.4 Mt at 46 to 47 g/t gold (1985 to 2010 production plus reserves), and Midas in Nevada produced about 5 Mt at 15 g/t gold and 204 g/t silver (USGS Scientific Investigations Report 2010-5070-Q). The same report gives Peñasquito in Mexico as an intermediate-sulfidation example (a middle chemistry between the acid, high-sulfidation and neutral, low-sulfidation styles) with mill reserves of 547 Mt at 0.55 g/t gold (December 2014 company figures), showing that the type can also be bulk and low in grade. The silver content is often as valuable as the gold.
Orogenic gold
Orogenic gold deposits form in quartz veins and shear zones in mountain belts, where metamorphic fluids move through faults. The USGS estimates production and resources from economic Phanerozoic (younger than 539 million years) orogenic deposits (including placers) at just over 1 billion ounces of gold, with Precambrian concentrations about half that, excluding the Witwatersrand (Goldfarb, Groves and Gardoll, 2001). Orogenic veins can be narrow but continue to depth, and grades are uneven, so sampling design matters more than in a disseminated deposit.
Iron oxide copper-gold (IOCG)
IOCG deposits are iron-oxide-rich bodies with copper, gold and often uranium. Olympic Dam in South Australia holds more than 3.8 billion tons of ore, and La Candelaria in Chile holds about 470 million tons. In the USGS data, the 21 breccia-hosted deposits have a median of 120 Mt at 1.1% copper, while the 12 vein-hosted ones have a median of 3.5 Mt at 2.3% copper (USGS Open-File Report 2007-1155). Our guide on gold versus copper deposits compares how IOCG, porphyry and other types split their value between the two metals.
Skarn
A skarn forms where a hot intrusion meets limestone and replaces it with calcium-rich minerals such as garnet. Antamina in Peru, a copper-zinc-molybdenum mine, is skarn-hosted, with mineralisation up to 1,000 m wide and a zoned garnet-and-pyroxene skarn on either side of the central intrusion (Teck Annual Information Form). Skarns often lie next to porphyry systems, so finding one is a clue that a porphyry may be nearby.
Mississippi Valley-type (MVT) lead and zinc
MVT deposits fill voids in carbonate rock far from any obvious volcano, deposited by basin brines. The USGS median is 7.0 Mt of ore with 1.9% lead, 6.0% zinc, 0.23% copper and 32.5 g/t silver. Deposits often cluster in districts: most Pine Point deposits in Canada hold 0.2 to 2 Mt of ore, while Navan in Ireland holds 95.3 Mt at 2.1% lead and 8.3% zinc and is the largest active mine linked to an MVT deposit (USGS Open-File Report 2009-1213). The metal is in sulfide that is easy to concentrate, so even modest tonnage can pay.
Sedimentary ore deposits: sediment-hosted copper, iron formations, placers and brines
Sedimentary deposits form at or near the surface, where water sorts, carries or evaporates metal. They tend to be flat, continuous and large, which makes them well suited to systematic drilling.
Chart
Iron in reserve, selected countries
Million tonnes of contained iron (selected countries, not the full list)
Sediment-hosted copper
These deposits are layers of copper sulfide in sandstone, shale or carbonate, deposited where metal-bearing brines met reducing rock. The USGS gives average grades outside the Central African Copperbelt of 1.38% copper for reduced-facies deposits (formed in oxygen-poor grey or black beds), 1.08% for sandstone and 2.09% for red-bed types (copper in red, oxidised sandstones); inside the Copperbelt the figures are higher, at 2.59% and 2.20%. Reduced-facies deposits can contain tens of millions to over a billion tonnes of ore, while red-bed deposits rarely reach 10 Mt (USGS Scientific Investigations Report 2010-5070-M). The type is also the top source of world cobalt. For mines of this type in Congo, see our ranking of DRC copper mines.
Banded iron formations
Banded iron formations are ancient seafloor layers of iron-rich and silica-rich bands. The layers are sedimentary, but the ore is a later enrichment: weathering and fluid flow removed the silica and left hematite ore. The giant hematite deposits of the Hamersley Province in Western Australia are hosted by these rocks; a 2024 dating study in the Proceedings of the National Academy of Sciences places their formation at 1.4 to 1.1 billion years ago (University of Western Australia). Australia’s iron-ore reserves are 59,000 Mt of crude ore containing 27,000 Mt of iron, ahead of Brazil and Russia (USGS Mineral Commodity Summaries 2026). Iron is a low-value metal per tonne, so only huge, flat deposits near a railway and port pay. This is the sedimentary family’s clearest example of scale beating grade.
Placers and paleoplacers
A placer forms when flowing water sorts heavy minerals such as gold, tin or diamonds into gravel. A paleoplacer is the same process preserved in ancient rock. The Witwatersrand Basin in South Africa is the world’s largest gold source: historic production exceeds 52,000 t of gold, about 32% of all gold ever mined (Frimmel and Hennigh, Mineralium Deposita, 2015). Modern river placers are far smaller and need no deep shafts, so claims can be worked with simple equipment. Check the claim rules first; our gold deposit types guide covers the host rocks. Always get landowner permission and a licence before digging, and never use mercury.
Evaporites and brines
Evaporite deposits form where dry basins concentrate dissolved salts. The USGS (2017) counts closed-basin brines as 58% of world lithium resources. The Clayton Valley brine in Nevada (average 160 ppm lithium) began production in 1966 and is pumped into nine ponds covering 16 km2. The Salar de Atacama in Chile averages 1,400 ppm and is called the world’s most significant lithium district (USGS Professional Paper 1802-K). Brine projects are measured in concentration of lithium in water, not in grams per tonne of rock, and returns depend on evaporation rates and pumping rather than on blasting and crushing.
Weathering deposits: laterites and supergene enrichment
Weathering deposits form when long rainfall and heat leach some elements away and leave others behind. Two kinds matter commercially.
Laterites. In humid tropical climates, ultramafic rocks weather to a red soil profile that concentrates nickel and cobalt. The USGS database covers 117 nickel-cobalt laterite deposits with 12,585 Mt of ore. The median deposit is 56 Mt at 1.3% nickel and 0.08% cobalt. The iron-oxide subtype holds 61% of tonnage at a median of 1.14% nickel, the magnesium-silicate subtype holds 32% at a higher 1.44% nickel, and the clay-silicate subtype is smaller, at 1.27% nickel (USGS Open-File Report 2011-1058). Laterites are shallow and can be mined in a thin open pit over a wide area, but the ore is wet and needs costly processing.
Supergene enrichment. Near the surface, rain oxidises a sulfide deposit and carries copper downward, where it forms a richer blanket of secondary copper sulfide above the primary ore. The USGS notes that supergene copper-sulfide grades are usually higher than the primary (hypogene) grades because of this enrichment (USGS Scientific Investigations Report 2010-5070-B). It is a reason a porphyry can look better in its first years of mining than its long-run average. For oxidised gold ores, see our page on oxidized gold ore.
Which type of deposit is most valuable to mine?
No type is best in every case. Measured by metal contained in the ground, the largest single concentrations are the Witwatersrand for gold, the Bushveld Complex for platinum-group metals, the Sudbury and Noril’sk-Talnakh districts for nickel, and Olympic Dam for copper. Measured by profit per tonne of ore, high-grade epithermal and orogenic veins often lead, but they run out faster. Measured by life of mine, the continuous bodies (layered intrusions, banded iron formations, sediment-hosted copper beds and porphyries) last longest.
A fair comparison needs the same unit. The calculator below turns grade, recovery and an example price into metal produced and margin per tonne of ore, so you can enter the numbers for any metal sold by the tonne. For gold or platinum, divide grams per tonne by 10,000 to get per cent, and convert a price per troy ounce to a price per tonne of metal by multiplying by 32,150.7. Prices are examples; use today’s price from the LME, LBMA or your own source. By-product credits and cost per tonne are yours to set, because they differ most between types.
Calculator
What could one tonne of this ore earn?
Enter grade, recovery, price and cost for the deposit type you are weighing.
- Revenue per tonne of ore (US$): $42
- Margin per tonne of ore (US$): $18
- Total margin (US$): $17,500,000
- Break-even grade (% metal): 0.29
Example values only, not a benchmark: 0.5% grade is near the low end of a porphyry copper deposit (USGS median 0.44%). Price is an example, use today’s price; money is in US$ and costs are examples.
Screening ground by deposit type from space
Satellites cannot see ore at depth, but several deposit types leave a surface signature that multispectral images can map. Porphyry copper and epithermal gold both sit in wide zones of altered rock containing clay, iron oxides and silica, as the USGS notes for porphyry systems. Skarns show up where carbonate rock meets an intrusion. Laterites cover broad, flat areas that images separate from fresh rock. Iron-oxide colour and salt crusts are also visible from orbit, which helps in screening iron formations and brine basins.
That is why the first step in a licence review is to decide which deposit types the geology allows, then map the matching signatures. A satellite screening report from Farmonaut maps those signatures across a licence as exploration targets, ahead of drilling and well short of a resource estimate.

▶ What satellites can and cannot see: the alteration around a deposit rather than the metal itself. · 4:25
For a live example of a laterite nickel-cobalt operation, see Ambatovy in the Madagascar mining industry guide.
Frequently asked questions
What are the main types of ore deposits?
The four families are magmatic, hydrothermal, sedimentary and weathering (residual). Within them, the common types are layered intrusions, magmatic nickel sulfides, kimberlites and pegmatites; porphyry, VMS, epithermal, orogenic, IOCG, skarn and MVT deposits; sediment-hosted copper, banded iron formations, placers and brines; and laterites.
What is the difference between magmatic and hydrothermal deposits?
A magmatic deposit forms inside or directly from cooling magma, so the ore is part of the igneous rock. A hydrothermal deposit forms when hot water carries metal out of a magma or from surrounding rock and deposits it in cracks or reactive layers.
Which type of deposit has the highest grade?
Epithermal and orogenic gold veins are usually the richest per tonne; Hishikari, at 46 to 47 g/t gold, is an exceptional epithermal example. Large porphyry copper deposits have the lowest, with a median of 0.44% copper.
Which deposit type holds most of the world’s copper?
Porphyry copper deposits. The USGS calls them the world’s largest source of copper, about 60% of production and about 65% of resources, with molybdenum, gold and silver as co-products or by-products. Sediment-hosted copper and IOCG deposits follow.
Where does lithium come from?
Mostly from brines and pegmatites. The USGS (2017) puts closed-basin brines at 58% and pegmatites at 26% of world lithium resources.
What is a placer deposit?
A placer is a loose accumulation of heavy minerals, such as gold, in river or beach gravel. The same process in ancient rock gives paleoplacers such as the Witwatersrand.
What is a supergene deposit?
It is an ore zone enriched by weathering. Rain oxidises the top of a sulfide body and carries copper down to form a richer secondary layer below the water table.
How does deposit type affect mining returns?
It sets the likely tonnage, grade, depth, by-products and metallurgy. Big, low-grade deposits need scale and cheap bulk mining, and small, rich ones need high prices per tonne. Our calculator on this page compares them using your own inputs.
What is the difference between ore and a mineral deposit?
A mineral deposit is any natural concentration of a mineral. It is ore only if it can be mined at a profit under current prices, costs and technology, so the same rock can switch between the two as prices move.
Can satellites identify the type of deposit?
They cannot name it directly, but they can map the alteration, colour and structure that go with certain types. Geologists then check the targets on the ground.
This page is for information only. It is not investment advice. Grades and tonnages are USGS medians or averages from published deposit models; individual deposits differ widely. Always get landowner permission and a licence before prospecting, and never use mercury.
Farmonaut mining
Screen your licence for the right deposit type
Send a boundary and get a satellite screening report that maps alteration and surface signatures as exploration targets in 5 to 20 business days.

Mining Pro sample view, synthetic data
Keep reading
Sources
- USGS, Porphyry Copper Deposit Model (SIR 2010-5070-B): pubs.usgs.gov
- USGS, Sediment-Hosted Stratabound Copper Deposit Model (SIR 2010-5070-M): pubs.usgs.gov
- USGS, Descriptive and Grade-Tonnage Models incl. IOCG (OFR 2007-1155): pubs.usgs.gov
- USGS, Mississippi Valley-Type Lead-Zinc Deposit Model (OFR 2009-1213): pubs.usgs.gov
- USGS, Volcanogenic Massive Sulfide Deposits of the World (OFR 2009-1034): pubs.usgs.gov
- USGS, Volcanogenic massive sulfide occurrence model (SIR 2010-5070-C): pubs.usgs.gov
- USGS, Ni-Co Laterite Deposits of the World (OFR 2011-1058): pubs.usgs.gov
- USGS, Magmatic Sulfide-Rich Nickel-Copper Occurrence Model (SIR 2010-5070-I): pubs.usgs.gov
- USGS, Critical Mineral Resources: Platinum-Group Elements (PP 1802-N): pubs.usgs.gov
- USGS, Critical Mineral Resources: Lithium (PP 1802-K): pubs.usgs.gov
- USGS, Descriptive Models for Epithermal Gold-Silver Deposits (SIR 2010-5070-Q): pubs.usgs.gov
- Goldfarb, Groves and Gardoll, Orogenic gold and geologic time (Ore Geology Reviews, 2001): pubs.usgs.gov
- Frimmel and Hennigh, First whiffs of the Witwatersrand paleoplacer (Mineralium Deposita, 2015): novoresources.com
- GIA, Recent Advances in Understanding the Geology of Diamonds (Gems & Gemology): gia.edu
- IGO, Greenbushes resources and reserves, calendar 2025: igo.com.au
- USGS, Mineral Commodity Summaries 2026: Iron Ore: pubs.usgs.gov
- University of Western Australia, A billion-year shift in the formation of Earth’s largest ore deposits (PNAS, 2024): research-repository.uwa.edu.au
- Teck Resources, Annual Information Form (Antamina): teck.com
- Kennecott, The Bingham Mine national historic landmark: kennecott-groundbreakers.com
- USGS, Mineral Commodity Summaries 2026: Nickel: pubs.usgs.gov
Discussion
Questions, corrections or field experience? Share them below. First-time comments are reviewed before they appear, and your email is never published.
No comments yet. Be the first to add a question or your experience.

 Process Metrology LLC
 Dalgety Minerals Pty Ltd
 Vortex Minerals Pty Ltd
 Faith At Work (Pty) Ltd
 Geotech Mining Solutions plc
 Vulcan International Limited
 Kidepo Associates
 GKY Mining
 Alkimy SARL
 Double A Trading
 GemSprout Metals Limited
 Qader Group
 Ileys General Trading
 SG Gold Mining LLC
 VRV Global Pte Ltd
 Omsri International FZE
 G.I.T.T.
 Jaunita Erss Ltd
 Almosi SARL
 SRK Consulting
 Berks Gold Limited
 Mwerezi Minerals Company Limited

 Exploration consultancy · South Africa · Gold










