

Silver · Production data
Global Silver Production by Country: Data and Trends
Mines produced 846.6 million troy ounces of silver in 2025, up 3% (World Silver Survey 2026). Mexico, Peru and China led, and three quarters of the metal came from lead-zinc, copper and gold mines.
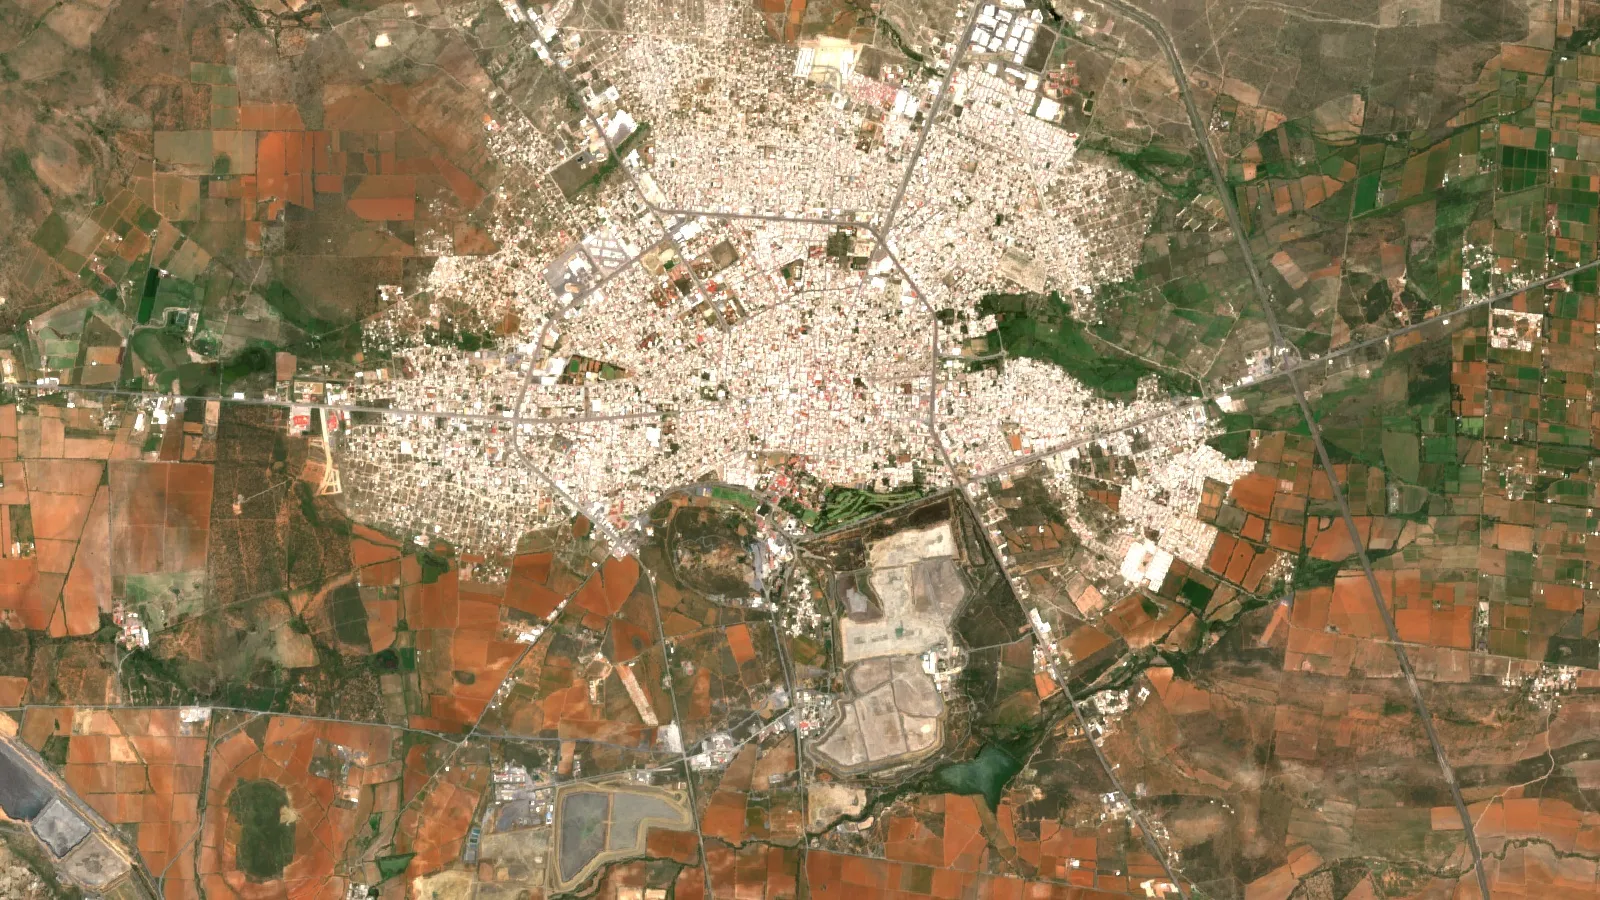
Key takeaways
- World mine output was 846.6 Moz (26,331 t) in 2025, up 3% (Metals Focus, World Silver Survey 2026); USGS estimates about 26,000 t.
- Mexico led with 172.9 Moz, then Peru (130.6 Moz) and China (112.8 Moz) in 2025.
- Only 26% of mined silver came from primary silver mines in 2025; lead-zinc mines supplied 29.4% and copper mines 28%.
- The market had a 40.3 Moz deficit in 2025, its fifth in a row; Metals Focus forecasts 46.3 Moz in 2026.
- Spot silver was US$52.40 per ounce on 10 November 2026 (Fortune); the 2025 average was US$40.03.
In this article
- Global silver production at a glance
- Silver production by country
- How world silver mine production has changed
- Where mined silver comes from: by-product vs primary mines
- Largest silver producing companies
- Silver supply, demand and the market deficit
- Silver prices and production costs
- Silver reserves by country
- Calculator: value of silver in your ore
- Outlook: what to watch in silver production
- Environmental and permitting checks for silver projects
- Frequently asked questions
Mines worldwide produced 846.6 million troy ounces (Moz) of silver in 2025, about 26,300 tonnes and 3% more than in 2024, according to the World Silver Survey 2026 prepared by Metals Focus for the Silver Institute. The US Geological Survey puts the same year at about 26,000 tonnes. Mexico, Peru and China mined almost half of it, and only about a quarter came from mines where silver is the main product. Below are the country and company tables, the supply split by host metal, the market balance and a calculator for the value of silver in your own ore.
A troy ounce is 31.1035 grams, and one tonne equals about 32,150.7 troy ounces. Mining reports give ore grade in grams per tonne (g/t): the grams of silver in each tonne of rock. Silver mining is reported in both units, so this page gives ounces first and tonnes in brackets where it helps.
Global silver production at a glance
Silver supply has two parts: new metal from mines and recycled metal from scrap. In 2025, mine production was 846.6 Moz and recycling added 197.6 Moz (6,145 tonnes), the highest recycling total in 13 years (World Silver Survey 2026). With small amounts of producer hedging and official-sector sales, total supply reached 1,090.4 Moz.
- Mine output, 2025: 846.6 Moz (26,331 t), up 3% from 823.6 Moz in 2024 (Metals Focus).
- US Geological Survey estimate, 2025: 26,000 t, up from 25,300 t in 2024 (USGS Mineral Commodity Summaries 2026).
- Largest producer: Mexico, with 172.9 Moz in 2025, despite a third year of decline.
- Share from primary silver mines: 26%, a record low.
- Forecast for 2026: 844.1 Moz, a 0.3% dip (Metals Focus forecast, April 2026).
The two data sets differ slightly because they use different sources and revision cycles. Metals Focus builds its numbers mine by mine from company reports, while the USGS compiles government statistics and rounds its world total. For a consultant’s model, pick one basis and stay with it.
Silver production by country
The ranking below uses the Metals Focus mine-by-mine totals for 2025 and lists the ten largest producing countries. Together they mined about 698 Moz, about 82% of world output.
Chart
Top 8 silver producing countries
Mine production, million troy ounces, 2025
| Rank | Country | 2024 (Moz) | 2025 (Moz) | Change |
|---|---|---|---|---|
| 1 | Mexico | 181.1 | 172.9 | -5% |
| 2 | Peru | 121.6 | 130.6 | +7% |
| 3 | China | 109.7 | 112.8 | +3% |
| 4 | Russia | 45.5 | 56.0 | +23% |
| 5 | Bolivia | 47.8 | 49.9 | +4% |
| 6 | Chile | 39.4 | 42.7 | +8% |
| 7 | Poland | 42.5 | 42.6 | +0.2% |
| 8 | United States | 34.0 | 35.7 | +5% |
| 9 | Australia | 33.6 | 32.9 | -2% |
| 10 | Argentina | 23.4 | 22.1 | -5% |
Source: World Silver Survey 2026, Top 20 Silver Producing Countries (Metals Focus). Kazakhstan, Sweden, Morocco, Uzbekistan and Canada follow further down the list.
Mexico
Mexico has led world silver mining for years, but its output fell for a third straight year in 2025. Metals Focus links the drop to operating disruptions, policy changes and reserve depletion. At Newmont’s Peñasquito, silver output fell 15% on lower head grades, and Fresnillo’s San Julián mine produced less after its disseminated ore body was finished. Pan American Silver’s La Colorada grew after a ramp expansion. The USGS lists Mexico’s 2025 mine output at about 6,300 tonnes.
Peru and Chile
Peru’s silver comes mostly from copper and lead-zinc mines. Output grew for a third year in 2025, helped by higher grades at Antamina and record ore milled at Las Bambas. Peru also holds the largest silver reserves listed by the USGS, about 110,000 tonnes. Chile rose 8%, partly on record concentrate output at BHP’s Escondida, a copper mine that yields silver as a by-product.
China, Russia and Bolivia
China mined 112.8 Moz in 2025, much of it from lead-zinc mines. Russia had the largest gain among big producers (+23%) as Polymetal’s Prognoz silver project ramped up. In Bolivia, the San Cristobal lead-zinc-silver mine increased output.
United States
US mines produced about 1,100 tonnes of silver in 2025, worth an estimated US$1.4 billion. Silver came from 4 silver mines and from 31 base- and precious-metal operations as a by-product, in 12 states. Alaska was the leading state, followed by Nevada (USGS, 2026). Metals Focus credits higher output at Coeur Mining’s Rochester mine in Nevada and Hecla’s Greens Creek and Lucky Friday mines. For the US picture in more detail, see our guide to new silver mines and US production trends.
How world silver mine production has changed
Annual mine output has moved in a narrow band for a decade. It was 862.7 Moz in 2017, fell to 790.3 Moz in 2020 and has climbed back since. The 2025 total of 846.6 Moz is the highest since 2018 (World Silver Survey 2026, ten-year table).
Chart
World silver mine production
Million troy ounces per year
The flat trend matters for anyone valuing a silver asset. Prices rose sharply in 2025, yet supply barely moved, because most silver comes as a side product of other metals and new primary mines take many years to permit and build. Earlier articles on this site cover the 800 Moz production outlook and mined silver and ore trends.
Where mined silver comes from: by-product vs primary mines
A primary silver mine earns most of its revenue from silver. A by-product mine is built for another metal, such as zinc, copper or gold, and recovers silver along the way. By-product silver now dominates supply.
Chart
Mined silver by host metal
Million troy ounces, 2025
| Host metal | 2025 output (Moz) | Share of mine supply |
|---|---|---|
| Lead-zinc mines | 249.1 | 29.4% |
| Copper mines | 237.3 | 28.0% |
| Primary silver mines | 221.1 | 26.1% |
| Gold mines | 134.7 | 15.9% |
| Other | 4.5 | 0.6% |
Source: World Silver Survey 2026, Silver Mine Production by Source Metal (Metals Focus). By-product silver from copper mines grew 6% in 2025 to 237.3 Moz, with Peruvian and Chilean copper mines leading the gain. Silver from gold mines rose 5%, supported by new mines such as Artemis Gold’s Blackwater in Canada. The USGS notes the same pattern: polymetallic deposits hold more than two-thirds of world silver resources. Our page on silver as a by-product of copper, lead and zinc mining explains the host deposit types.
For a project owner, this means silver output often follows copper and zinc prices, not silver prices. A copper mine will not mine more ore just because silver is up. This is one reason supply responds slowly.
Largest silver producing companies
The seven largest producers by 2025 silver output, from the company table in the World Silver Survey 2026, are listed below. Figures are company-reported or Metals Focus estimates.
Chart
Silver output of the largest producers
Million troy ounces
| Company | Main silver sources | 2024 (Moz) | 2025 (Moz) |
|---|---|---|---|
| Fresnillo plc | Primary silver and gold mines, Mexico | 54.3 | 47.6 |
| KGHM Polska Miedź | Copper mines, Poland and abroad | 43.1 | 43.3 |
| Polymetal JSC | Gold and silver mines, Russia | 17.3 | 28.0 |
| Newmont | Peñasquito and other gold mines (payable) | 33.0 | 28.0 |
| Southern Copper | Copper mines, Peru and Mexico | 21.0 | 24.2 |
| Pan American Silver | Silver and gold mines in the Americas | 21.1 | 22.8 |
| Glencore | Copper and zinc mines | 19.3 | 20.4 |
Fresnillo’s figure excludes its Silverstream contract; the company’s 2025 annual report gives 48.7 Moz of attributable silver including Silverstream. Pan American reported 6.47 Moz of attributable silver in the second quarter of 2026. Only two of the seven are mainly silver companies; the rest are copper or gold miners. Readers comparing smaller firms can use our list of silver exploration companies. This table states production facts only and is not investment advice.
Silver supply, demand and the market deficit
Demand fell 2% in 2025 to 1,130.6 Moz, the lowest since 2021. Industrial use slipped 3% to 657.4 Moz, and silver used in solar panels (photovoltaics) fell 6% to 186.6 Moz as makers cut silver per cell. Coin and bar buying rose 14% to 217.7 Moz (World Silver Survey 2026).
Because demand still exceeded supply, the market posted a deficit of 40.3 Moz in 2025, the fifth deficit in a row. Metals Focus forecasts a sixth deficit of 46.3 Moz in 2026. In the US, the USGS estimates domestic use in 2025 was 25% electrical and electronics, 15% photovoltaics and 18% bars for investment.
Silver prices and production costs
The silver price averaged US$40.03 per ounce in 2025, up from US$28.27 in 2024 (World Silver Survey 2026); the USGS estimate is US$38. On 10 November 2026 at 7:15 a.m. ET, spot silver was US$52.40 per ounce (Fortune). The daily benchmark used in many contracts is the LBMA Silver Price, set by auction at noon London time.
Costs went the other way. All-in sustaining cost (AISC: the cash cost of producing an ounce plus sustaining capital and overheads) at primary silver mines fell 1% in 2025 to US$12.21 per ounce, mainly because higher gold by-product credits offset other costs (Metals Focus). Margins over AISC reached US$27.81 per ounce in 2025.
Silver reserves by country
The USGS estimates world silver reserves at about 610,000 tonnes (2026 edition). Peru leads with about 110,000 tonnes, followed by Russia (92,000 t), Australia (91,000 t), China (67,000 t) and Poland (59,000 t). Mexico, the top producer, has about 37,000 tonnes. Reserves are the part of a resource that can be mined at a profit with today’s technology and prices, so they change with prices and new studies. Metals Focus reports that reserves at primary silver mines fell slightly in 2025 as extraction outran new discoveries.
Calculator: value of silver in your ore
Use this to turn tonnes and grade into recovered ounces and a gross value. Enter your own figures; a by-product mine can use its own silver grade and recovery.
Calculator
How much silver is in your ore, and what is it worth?
Enter your own ore tonnage, grade, recovery and today’s price.
- Recovered silver (oz): 1,366,406
- Payable value (US$): $64,904,271
Example values only, not a benchmark or a valuation. 31.1035 grams per troy ounce is fixed in the formula. Gross value is before mining, processing, smelter terms, royalties and tax. Prices are inputs: example, use today’s price (US$ per troy ounce).
Outlook: what to watch in silver production
Metals Focus expects mine supply to dip by 2.5 Moz in 2026 to 844.1 Moz. Growth should come from Mexico, as Peñoles’ Tizapa recovers after a strike and Endeavour Silver’s Terronera reaches higher grades, and from Morocco, where Aya Gold and Silver’s Zgounder mine is expanding. Lower output from Peruvian lead-zinc mines and from SSR Mining’s Puna in Argentina should offset these gains. Newmont expects Peñasquito’s silver output to rise by more than 10% in 2026.
- Copper and zinc projects: new by-product silver depends on base-metal investment.
- Grades in Mexico: several large mines are moving into lower-grade zones.
- Recycling: forecast to reach its highest level since 2012 in 2026, as high prices pull out more scrap.
- Solar demand: photovoltaic use is forecast to fall 19% in 2026 to 151.0 Moz as cells use less silver.
▶ Remote sensing for mining in three minutes: what satellites can see in rocks. · 2:01
Environmental and permitting checks for silver projects
Most silver comes from large open pits and underground polymetallic mines, so water use, tailings storage and acid drainage from sulphide rock are the main environmental issues. Permits, community agreements and tailings plans often take longer than construction. For a consultant screening ground, satellite imagery can map alteration, old workings and land cover before any drilling. Farmonaut offers satellite-based mineral detection for early-stage targeting; results are exploration targets, not a resource estimate. Questions about a specific area can go through the mining query form or the contact page.
If you are looking at an operating asset, our guide to silver mines for sale lists the checks to run before you buy, and the overview of the largest silver producers covers the leading countries in more depth.
▶ The seven main environmental impacts of mining, explained in clay animation. · 2:31
Frequently asked questions
How much silver is mined each year?
About 846.6 million troy ounces (26,331 tonnes) were mined in 2025, according to the World Silver Survey 2026. The USGS estimate for the same year is about 26,000 tonnes.
Which country produces the most silver?
Mexico, with 172.9 Moz in 2025, followed by Peru (130.6 Moz) and China (112.8 Moz), per Metals Focus.
Which company produces the most silver?
Fresnillo plc, with 47.6 Moz in 2025 excluding its Silverstream contract, followed by KGHM Polska Miedź with 43.3 Moz (World Silver Survey 2026).
What share of silver comes from primary silver mines?
About 26% in 2025, a record low. Lead-zinc, copper and gold mines supplied the other three quarters.
Is silver mine production rising or falling?
It rose 3% in 2025, but Metals Focus forecasts a 0.3% dip to 844.1 Moz in 2026. Output has stayed between about 790 and 863 Moz since 2017.
How much silver does the United States produce?
About 1,100 tonnes in 2025, worth about US$1.4 billion, from 12 states led by Alaska and Nevada (USGS).
How big are world silver reserves?
About 610,000 tonnes, with Peru holding the largest share at about 110,000 tonnes (USGS, 2026).
Why is there a silver deficit?
Demand from industry, jewelry and investment has exceeded mine output plus recycling for five years running. The 2025 deficit was 40.3 Moz.
What does it cost to mine an ounce of silver?
Primary silver mines had an average all-in sustaining cost of US$12.21 per ounce in 2025, on a by-product accounting basis (Metals Focus).
How many grams are in a troy ounce of silver?
31.1035 grams. A tonne of silver is about 32,150.7 troy ounces.
This page is for information only. It is not investment advice.
Farmonaut mining
Map your silver project area from space
Screen alteration, old workings and land cover across your licence before you plan drilling.
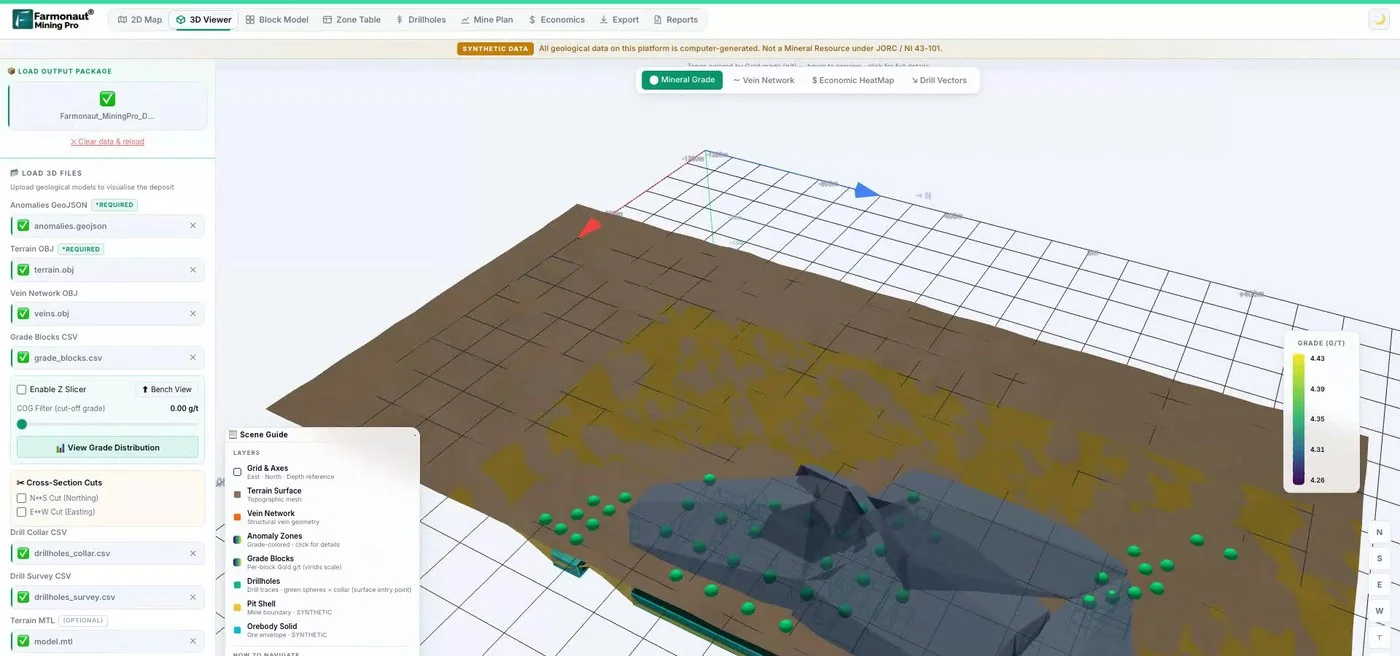
Mining Pro sample view, synthetic data
Keep reading
Sources
- Silver Institute / Metals Focus, World Silver Survey 2026: silverinstitute.org
- USGS, Mineral Commodity Summaries 2026: Silver: pubs.usgs.gov
- USGS, Mineral Commodity Summaries 2025: Silver: pubs.usgs.gov
- Fortune, Current price of silver, 10 November 2026: fortune.com
- LBMA, Precious metal prices (LBMA Silver Price): lbma.org.uk
- Fresnillo plc, Annual Report 2025: fresnilloplc.com
- Pan American Silver, Q2 2026 report: panamericansilver.com
- Newmont, Q4 and full year 2025 results and 2026 guidance: seekingalpha.com
- Silver Institute, Silver supply and demand: silverinstitute.org
- Silver Institute, Mine production: silverinstitute.org
Discussion
Questions, corrections or field experience? Share them below. First-time comments are reviewed before they appear, and your email is never published.
No comments yet. Be the first to add a question or your experience.

 Energy and Resources Ltd
 Mwerezi Minerals Company Limited
 Congo Mining Solutions
 Mining SARL
 SenGold Invest SAS
 Sania Corporation
 Sean Mining Limited
 NTS Group (Pty) Ltd
 Mine4Africa
 Lithspo Minerals Limited
 Tintina Mining Group
 Dalgety Minerals Pty Ltd
 Vortex Minerals Pty Ltd
 Faith At Work (Pty) Ltd
 Geotech Mining Solutions plc
 Vulcan International Limited
 Kidepo Associates
 GKY Mining
 Alkimy SARL

 Licence holder · Nigeria · Gold + lithium
 Client · Somalia · Gold










