

Gold stock facts · Company guide
Harmony Gold Mining Stock: Tickers, Results, Dividends
Harmony trades as HAR on the JSE and HMY on the NYSE. In FY26 it produced 1,429,551 oz of gold and 18,207 t of copper and declared a record 1,280-cent dividend. Sourced facts, charts and a margin calculator.
Key takeaways
- Harmony Gold is listed on the JSE as HAR and on the NYSE as HMY, an ADR programme (Harmony, shareholder information).
- FY26 gold output was 1,429,551 oz, down 3%, at an all-in sustaining cost of US$2,195/oz against an average price received of US$3,811/oz (Harmony, 27 August 2026).
- The FY26 dividend totals 1,280 SA cents per share, about R8.1 billion, including a 750-cent final dividend with a payment date of 12 October 2026.
- Copper is now part of the story: CSA made 18,207 t in FY26 and Eva Copper targets first production in the second half of 2028.
- Named risks include a R9.65 billion realised hedge loss, an Eva Copper approval process and the Wafi-Golpu special mining lease that has not yet been issued (Miningmx, March 2026).
In this article
- Harmony at a glance: listings, shares and key dates
- Harmony's FY26 results in numbers
- Gold output and where it comes from
- Guidance for the year ahead and the production trend
- How Harmony fits into world gold supply
- Copper: CSA, Eva Copper and the 100,000-tonne target
- Dividends: what was paid and how the policy works
- Harmony's gold margin at different gold prices
- Risks the company and the press have named
- Where to check the next set of numbers
- How satellite data helps with gold exploration
- Screening a licence area with Farmonaut
- Frequently asked questions
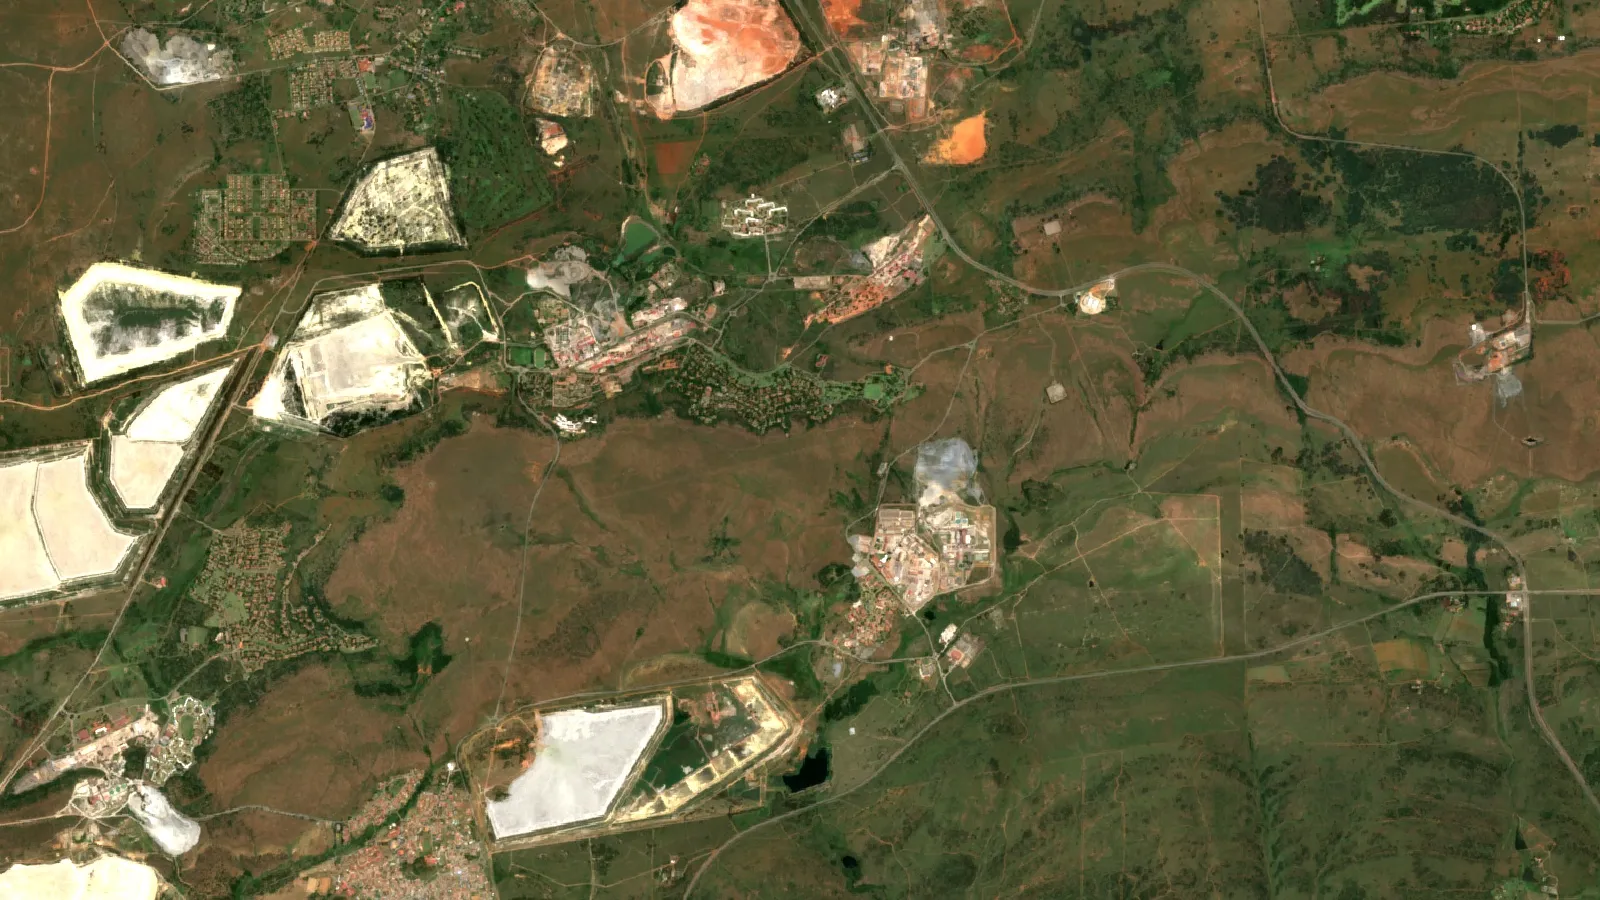
Harmony Gold Mining Company Limited has its primary listing on the Johannesburg Stock Exchange (JSE) under the code HAR, and an American depositary receipt (ADR) programme on the New York Stock Exchange (NYSE) under the ticker HMY (Harmony shareholder information). In the year to 30 June 2026 (FY26) it produced 1,429,551 ounces of gold and 18,207 tonnes of copper, and its headline earnings per share rose 87% to 4,363 South African cents (Harmony results announcement, 27 August 2026). Since the MAC Copper purchase, it is also a copper miner in Australia.
This page collects the facts a shareholder or researcher usually looks up: where the company is listed, what it produced, what it paid out, which mines matter, what the copper projects are, and which risks the company and the press have named. Every figure carries a source and a date, and the page was checked on 16 October 2026. It gives no share price, no price target and no buy or sell view.
Harmony at a glance: listings, shares and key dates
The table below lists the basic stock facts. Financial amounts are in South African rand (R) unless the source gave US dollars. A hedge is a contract that fixes a future gold price; it comes up again in the risk section.
| Item | Fact | Source |
|---|---|---|
| Primary listing | JSE, code HAR; headquarters in Randfontein, South Africa | Harmony shareholder information |
| US listing | NYSE, ticker HMY, an ADR programme; the dividend notice gives an ADR equivalent of 46.87 US cents at an assumed R16.00 per US$, and ADR holders should confirm details with the depositary bank | Harmony results announcement, 27 August 2026 |
| Ordinary shares in issue | 636,798,966, including 11,821,538 treasury shares (shares the company holds itself) | Harmony results announcement, 27 August 2026 |
| Where it operates | South Africa, Papua New Guinea and Australia | Harmony operations page |
| Age and history | Describes itself as having shaped South African mining for the past 75 years; first listed on Nasdaq in 1996 and moved to the NYSE in November 2002 | Harmony history page |
| Next events | Annual report due 23 October 2026; annual general meeting 24 November 2026 | Harmony shareholder information |
The dividend notice shows the ADR equivalent as the rand amount divided by an assumed exchange rate of R16.00 per US$; the actual US dollar amount depends on the rate on the conversion date. The calculator further down uses a different, simpler idea: how much margin the gold business leaves at a gold price you choose.
Harmony’s FY26 results in numbers
FY26 ran from 1 July 2025 to 30 June 2026. The company’s results announcement of 27 August 2026 gives these headline numbers (Harmony FY26 results):
Chart
Gold price received against Harmony’s cost measures
US$ per ounce, years ended 30 June (FY25 as restated by Harmony)
- Gold production fell 3% to 44,464 kg (1,429,551 oz) from 46,023 kg (1,479,671 oz), which met production guidance for the eleventh year in a row.
- Underground recovered grade, the amount of gold recovered per tonne of ore, was 5.83 grams per tonne (g/t), down from 6.27 g/t.
- The average gold price received rose to US$3,811 per ounce from US$2,620.
- All-in sustaining cost (AISC), the cost of producing an ounce including the capital needed to keep the mines running, rose to US$2,195 per ounce from US$1,804, or to R1,191,698 per kg from R1,053,189 in rand.
- Revenue grew 34% to R99,238 million (US$5,876 million).
- Adjusted cash flow after capital spending (the company’s adjusted measure) rose 54% to a record R17,148 million (US$1,015 million).
- The group moved from net cash of R11,148 million to net debt of R852 million (US$52 million) after paying for MAC Copper.
The chart compares the price Harmony received with its cost measures. The price rose by US$1,191 an ounce, while AISC rose by US$391. The rand was stronger on average (R16.89 per dollar against R18.15), which raises the dollar value of rand-based wages and supplies. That is why AISC rose 22% in dollars but 13% in rand.
Gold output and where it comes from
Harmony says its South African operations are the backbone of the gold portfolio: nine underground mines, one open-pit mine and surface retreatment of old tailings. The mines it lists are Doornkop, Kusasalethu, Mponeng and Savuka in Gauteng; Kalgold (the open pit), Mine Waste Solutions and Moab Khotsong in North West; and Central Plant Reclamation, Joel, Masimong, Phoenix, Target 1, Tshepong North and Tshepong South in a third group listed on Harmony’s page (Harmony South Africa operations). The company’s history page names Mponeng and Moab Khotsong as the high-grade mines it bought in 2020 and 2018 (Harmony history).
By revenue and cash flow, the two mines that matter most are Mponeng and Moab Khotsong, which together brought in R30.3 billion of revenue in FY26, and Mponeng alone delivered adjusted cash flow after capital spending of R9.44 billion, up 34%. Tshepong North, Tshepong South, Doornkop, Kusasalethu, Joel, Target 1 and Masimong together supplied 38% of group gold (TimesLive, 29 August 2026). Harmony also reports that the life of mine at Tshepong North was extended to 15 years from six (Harmony FY26 results).
In Papua New Guinea, Hidden Valley is the company’s only operating mine in that country. Harmony also holds a 50% stake in the Wafi-Golpu copper-gold project in Morobe Province (Harmony Papua New Guinea page).
The video below follows one nugget through the steps that every underground gold mine uses, from drilling to refining.

▶ A gold nugget followed from rock to ring: found, drilled, crushed, dissolved, melted and refined. · 5:27
Guidance for the year ahead and the production trend
For FY27 Harmony guides to 1.3 to 1.4 million ounces of gold at an AISC of R1,300,000 to R1,395,000 per kg, with an underground recovered grade above 5.60 g/t. Copper guidance is 28,000 to 30,000 tonnes at a C1 cash cost of US$2.55 to US$2.65 per pound (Harmony FY26 results). C1 cash cost is the direct cost of mining and processing a pound of copper, before capital spending and corporate costs. The chart shows that the gold guidance sits below the FY26 actual output. Harmony says the assumptions behind it are deliberately conservative and use a gold price of R1,850,000 per kg (Miningmx, 27 August 2026).
Chart
Harmony gold production and FY27 guidance
Thousand ounces; FY27 shows the low and high end of guidance
Guidance is a company forecast, not a result. The sections below list what could move the numbers.
How Harmony fits into world gold supply
The US Geological Survey (USGS) estimates world gold mine production at 3,300 tonnes in 2025, with South Africa at 90 tonnes and reserves of 5,000 tonnes (USGS Mineral Commodity Summaries 2026, gold). Harmony’s 44.5 tonnes in FY26 includes its Papua New Guinea output and covers a different twelve months, so the two numbers show scale only, not a share. For context, the World Gold Council reports that the LBMA PM gold price averaged US$4,506.29 an ounce in the second quarter of 2026, 37% above the second quarter of 2025 (World Gold Council, Gold Demand Trends Q2 2026). Harmony’s full-year average received price was US$3,811 an ounce. That covers a different period and is net of hedge losses, so the two figures do not compare directly.
Chart
Gold mine production, selected countries
Tonnes of gold, 2025 estimate; selected countries; Harmony’s FY26 output was 44.5 t
For investors who compare gold producers, our guides on Barrick’s gold price and mine trends and on gold and uranium stocks show how other producers report the same measures, and mining royalties explains a different way to hold gold exposure.
Copper: CSA, Eva Copper and the 100,000-tonne target
Harmony bought MAC Copper, which owns the CSA copper mine in New South Wales, for US$1.01 billion; the deal completed in October 2025 (Miningmx, 27 August 2026). In its first year under Harmony, CSA produced 18,207 tonnes of copper at a recovered grade of 3.75% and a C1 cash cost of US$2.47 per pound (Harmony FY26 results). CSA’s mineral reserve was reported at 577,000 tonnes of contained copper and its resource at 1.1 million tonnes (TimesLive, 29 August 2026). A reserve is the part of a resource that can be mined at a profit with today’s technology; a resource is a larger, less certain estimate.
Chart
Harmony copper output, guidance and targets
Tonnes of copper per year; only the first bar is actual output
Eva Copper is a project in north-west Queensland that Harmony acquired in December 2022. The board approved construction in November 2025. The company page lists it as fully permitted, but the same page carries an EPBC Act notice for a Stage 1 referral that is under assessment. The plan is for six open pits, a conventional concentrator, a planned life of more than 15 years and first production expected in the second half of 2028 (Harmony Eva Copper page). Reported capital cost is US$1.55 to US$1.75 billion, with an expected output of 50,000 to 60,000 tonnes of copper a year (Miningmx, 30 June 2026). Management’s stated target is at least 100,000 tonnes of copper a year within three years, made up of 40,000 tonnes from CSA by 2029 and 60,000 tonnes from Eva (TimesLive, 29 August 2026). That is a target, not guidance. Investors who want to see how copper miners are screened can read our copper stock screen.
Harmony’s financial director has said the portfolio would probably be around 30% copper and 70% gold from South Africa (TimesLive, 29 August 2026).
Dividends: what was paid and how the policy works
Harmony declared a final dividend of 750 SA cents per share (about 46.9 US cents), with a payment date of 12 October 2026 for holders on the register at close of business on 9 October 2026. With an interim dividend of 530 cents, the FY26 total is 1,280 cents per share, a record payout of about R8.1 billion (US$503 million) (Harmony FY26 results; Miningmx, March 2026). The final dividend for FY25 was 155 cents.
The dividend policy, as reported in March 2026, sets a base dividend of 30% of cash flow after all capital spending including growth projects, up from a previous range of 20% to 30%. The board pays a further 20% of that cash flow if net debt is below one times EBITDA (Miningmx, March 2026). Analysts quoted in that article warned that future payouts could be squeezed by the Eva Copper spend.
South African dividend withholding tax is 20%, so the net final dividend for a holder who pays it is 600 cents per share. Non-resident holders may qualify for a lower rate under a tax treaty if they file the right forms through their broker (Harmony FY26 results). Ask a tax adviser about your own position.
Harmony’s gold margin at different gold prices
Margin is the gap between what an ounce sells for and what it costs to produce, using AISC as the cost. The calculator below takes Harmony’s FY26 ounces and AISC as starting values and lets you test any gold price. For reference, Kitco showed spot gold at US$4,157.70 an ounce at 2:51 pm New York time on 15 October 2026 (bid price) (Kitco gold chart); the default in the calculator is a round example, not today’s price.
The result is simple arithmetic on averages. It is not Harmony’s reported profit, which also depends on tax, interest, copper, the timing of sales and the hedge book. The company’s own measure, group gold production profit, was R48,184 million (US$2,853 million) in FY26 (Harmony FY26 results).
Calculator
What margin is left at your gold price?
Enter a gold price and cost. Starting values are Harmony’s FY26 averages.
- Margin on all ounces, before hedge loss: 2,580.3 US$ m
- Margin after the hedge loss you entered: 2,009.3 US$ m
- Margin as a share of the price: 45.1 %
Example values only, not a forecast. Ounces, AISC and the hedge loss are Harmony’s FY26 figures (results announcement, 27 August 2026). The gold price is an input: example, use today’s price. The result is arithmetic on averages in US$, not reported profit; tax, copper, interest and sales timing are left out.
Risks the company and the press have named
Gold hedges
Harmony reported a realised loss of R9.65 billion (US$571 million) on its gold hedge book in FY26, which lowered the average price it received. Outstanding hedge liabilities fell to R2.14 billion at year end from R12.24 billion at the half-year. Management says it hedges to lock in margins while it funds growth projects, and expects the realised loss to shrink as older hedges mature (Miningmx, 27 August 2026).
Eva Copper approvals
In June 2026 Harmony paused land clearing at Eva after finding a protected species, the Northern Blue-tongued Skink. Construction continues in approved areas, including the copper concentrator. Harmony is seeking environmental approval in two stages and has kept both the first-copper date in the second half of 2028 and its capital guidance (Miningmx, 27 August 2026). Approval for the affected areas was still being sought when the FY26 results came out.
Wafi-Golpu in Papua New Guinea
Wafi-Golpu holds close to half of Harmony’s mineral resources, according to Miningmx. Harmony and Newmont signed a non-binding framework memorandum with the PNG government in April 2023 (Harmony history), but the special mining lease, the permit that lets a mine be built, has not been issued. In March 2026 the chief executive said talks were not yet reaching a favourable outcome, and the article estimated that production could not start before 2031 even if a lease were granted that year. The state also has an option to buy up to 30% of the project (Miningmx, March 2026).
Costs, safety and capital spending
AISC rose 22% in dollars in FY26, and the underground recovered grade fell from 6.27 to 5.83 g/t. Capital spending was R17.1 billion against R10 billion the year before, and the company plans R14.4 billion for its gold assets in FY27, R2.1 billion for CSA and an estimated US$650 million to US$680 million for Eva Copper, subject to approvals (TimesLive, 29 August 2026). TimesLive reports six fatalities in FY26 against eleven a year earlier, and Harmony’s announcement calls the loss of life tragic while reporting its lowest ever lost-time injury frequency rate (Harmony FY26 results).
Gold price
Harmony’s earnings move with the gold price and the rand. The World Gold Council noted that gold exchange-traded funds saw outflows of 45 tonnes in the second quarter of 2026 as prices softened, and that it expects investment to drive demand in the second half (World Gold Council, 30 July 2026). Prices change daily, so check a live source such as Kitco before using any figure.
Where to check the next set of numbers
- The annual report, due 23 October 2026, and the annual general meeting on 24 November 2026 (Harmony shareholder information).
- The JSE announcements service (SENS) and the investor pages on harmony.co.za for production updates; Harmony has met its production guidance in each of the last eleven years.
- Gold production, grade, AISC, copper output and C1 cost against the FY27 guidance above.
- The Eva Copper environmental approval and the timing of first copper.
- The size of the realised hedge loss in each half-year.
How satellite data helps with gold exploration
A large part of what Harmony reports is the result of exploration that happened years earlier. The company says it is working in terrain in Papua New Guinea that is under-explored for copper-gold porphyry and epithermal gold (Harmony Papua New Guinea page). Satellites cannot see gold itself. They map the rock around it: iron-stained surfaces, clay minerals and fault lines. The European Copernicus Sentinel-2 satellites, for example, carry a 13-band imager with 10 m resolution and a revisit time of about five days (European Space Agency, Sentinel-2), which is enough to map alteration over a large licence area before any drilling.
The video explains what a satellite can and cannot tell you about a gold target.
▶ What satellites can map around a gold system, and what they cannot see. · 4:25
Screening a licence area with Farmonaut
Farmonaut is a satellite data company. Its mineral detection service takes an area of interest as a KML, KMZ or polygon, picks the satellite data, and delivers a report in 5 to 20 business days. Farmonaut states that this moves early exploration from months to days and can lower early-exploration cost by up to 80 to 85%. The results are exploration targets that sit ahead of a resource estimate; they are not a JORC or NI 43-101 resource. Licence owners can request a quote and investors can read about the satellite mineral detection service.
We cover a connected topic in Predictive Analytics in Mining: Use Cases and Results.
Frequently asked questions
What are the tickers for Harmony Gold stock?
The JSE code is HAR, which is the primary listing, and the NYSE ticker is HMY for the American depositary receipt (Harmony shareholder information).
Where is Harmony Gold headquartered and where does it mine?
The headquarters is in Randfontein, South Africa. It mines gold in South Africa and Papua New Guinea, and copper in Australia (Harmony operations).
How much gold did Harmony produce in FY26?
1,429,551 ounces (44,464 kg), 3% less than the 1,479,671 ounces of FY25 (Harmony FY26 results).
What is Harmony’s all-in sustaining cost?
US$2,195 per ounce (R1,191,698 per kg) in FY26, up from US$1,804 per ounce. AISC adds sustaining capital and some corporate costs to the direct cost of mining.
Does Harmony pay a dividend?
Yes. The FY26 total was 1,280 SA cents per share, made of an interim dividend of 530 cents and a final dividend of 750 cents with a payment date of 12 October 2026. Past dividends do not guarantee future ones.
Is Harmony a copper company as well?
Partly. CSA in New South Wales produced 18,207 tonnes of copper in FY26, and Eva Copper in Queensland is under construction with first production expected in the second half of 2028 (Harmony Eva Copper page).
What is Wafi-Golpu?
A copper-gold project in Papua New Guinea owned 50% by Harmony and 50% by Newmont, which still needs a special mining lease before construction can start (Miningmx, March 2026).
Why did Harmony report a hedging loss?
Some of its gold was sold forward at prices below the spot price. The realised loss was R9.65 billion (US$571 million) in FY26 (Miningmx, 27 August 2026).
What is Harmony’s FY27 guidance?
Gold of 1.3 to 1.4 million ounces at an AISC of R1,300,000 to R1,395,000 per kg, and copper of 28,000 to 30,000 tonnes (Harmony FY26 results).
Can satellite data show whether a mine will keep its grade?
No. Satellite data screens surface clues such as alteration and faults to rank exploration targets. Grade and reserves come from drilling and sampling.
This page is for information only. It is not investment advice. It gives no share price or price target, and company forecasts and targets may not be met. Check Harmony’s filings before you decide anything.
Farmonaut mining
See satellite exploration for gold
Read how satellite screening ranks exploration targets on a licence area, ahead of a resource estimate.

Mining Pro sample view, synthetic data
Keep reading
Sources
- Harmony Gold, results for the year ended 30 June 2026 and final dividend declaration (27 August 2026): harmony.co.za
- Harmony Gold, Shareholder information: harmony.co.za
- Harmony Gold, Operations: harmony.co.za
- Harmony Gold, South Africa operations: harmony.co.za
- Harmony Gold, Papua New Guinea operations: harmony.co.za
- Harmony Gold, Eva Copper Project: harmony.co.za
- Harmony Gold, History: harmony.co.za
- Miningmx, Harmony Gold dividend soars as earnings jump 87% (27 August 2026): miningmx.com
- Miningmx, Harmony Gold sticks with gold hedging strategy after R10bn hit (27 August 2026): miningmx.com
- Miningmx, Harmony flags protected species find at Eva project (30 June 2026): miningmx.com
- Miningmx, Harmony Gold seeks end to 18-year PNG deadlock (March 2026): miningmx.com
- TimesLive, Harmony’s Australian copper push boosts investor returns (29 August 2026): timeslive.co.za
- USGS, Mineral Commodity Summaries 2026: Gold: pubs.usgs.gov
- World Gold Council, Gold Demand Trends: Q2 2026 (30 July 2026): gold.org
- Kitco, Gold price chart (15 October 2026): kitco.com
- European Space Agency, Sentinel-2: esa.int
Discussion
Questions, corrections or field experience? Share them below. First-time comments are reviewed before they appear, and your email is never published.
No comments yet. Be the first to add a question or your experience.

 Kidepo Associates
 GKY Mining
 Alkimy SARL
 Double A Trading
 GemSprout Metals Limited
 Qader Group
 Ileys General Trading
 SG Gold Mining LLC
 VRV Global Pte Ltd
 Omsri International FZE
 G.I.T.T.
 Jaunita Erss Ltd
 Almosi SARL
 SRK Consulting
 Berks Gold Limited
 Mwerezi Minerals Company Limited
 Mining SARL
 SenGold Invest SAS
 Sean Mining Limited

 Exploration consultancy · South Africa · Gold










