

Silver stocks · How-to guide
How to Buy Silver Stocks: 6 Steps With Costs
Open a brokerage account, pick shares or a fund, check cost per ounce, then place a limit order. This guide gives tickers, fees, 2025 output and two calculators. Silver was US$56.98 on 15 October 2026 (Kitco).
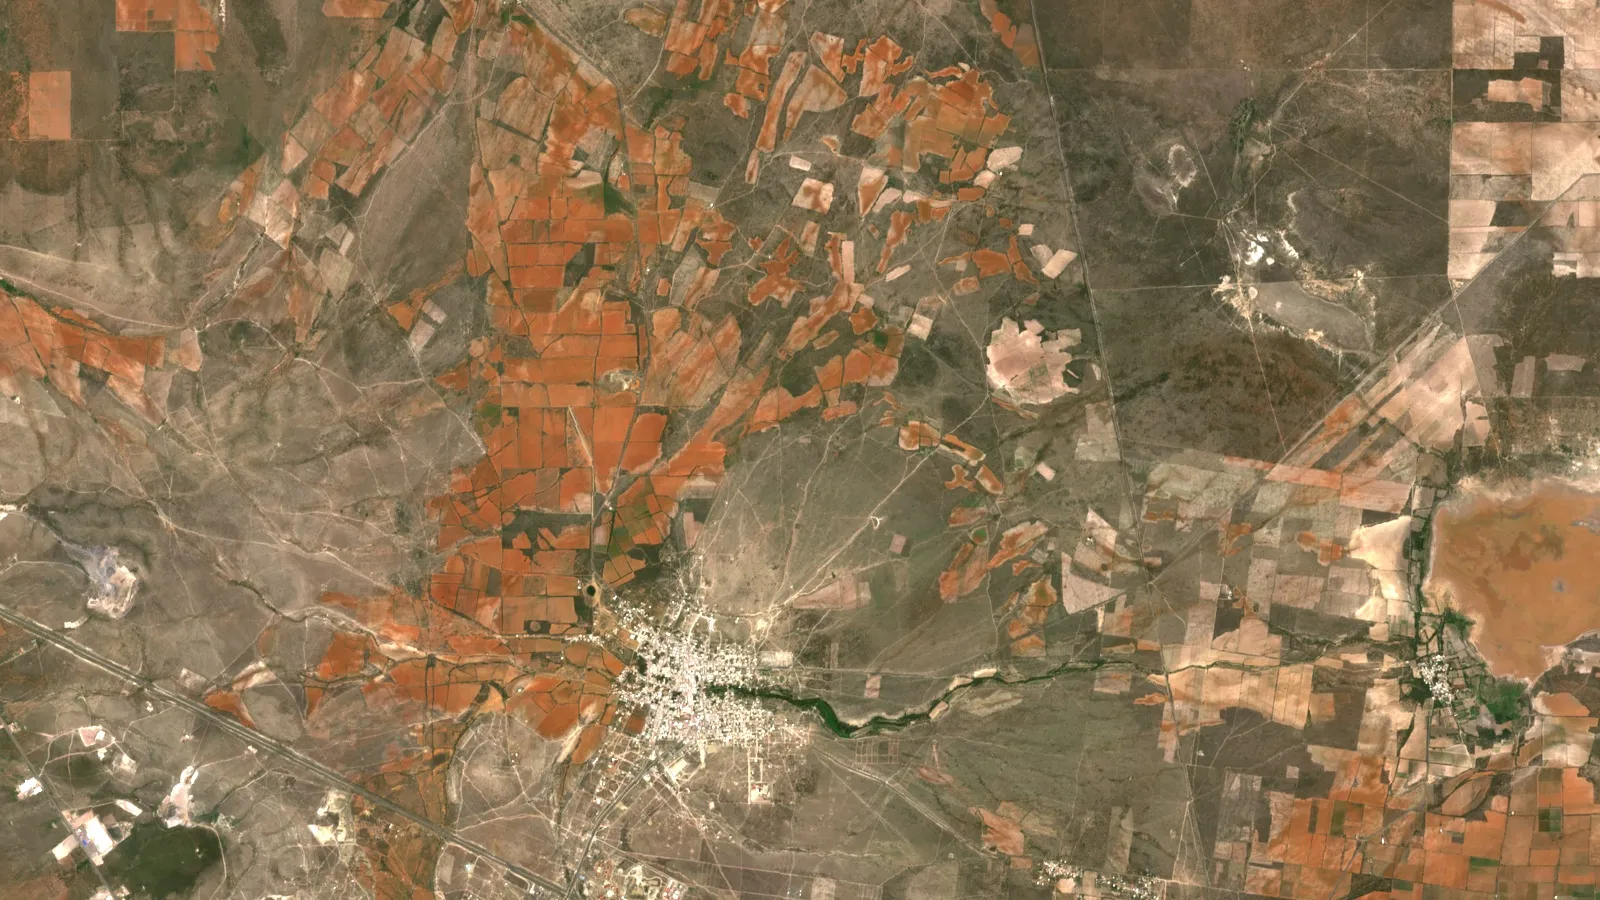
Key takeaways
- Silver traded at US$56.98 per ounce on 15 October 2026, after an all-time high above US$121 on 29 January 2026 (Kitco; Silver Institute).
- Fund fees: SIL 0.65%, SILJ 0.69% and the physical-silver trust SLV 0.50% (fund pages, October 2026).
- Mexico mined an estimated 6,300 tonnes of silver in 2025, the most of any country (USGS, 2026); most silver is a byproduct of lead-zinc, copper and gold mining.
- Pan American’s realised silver price was US$70.97 in Q2 2026 against an AISC of US$17.80 per ounce; AISC definitions differ by company.
- MAG Silver was acquired by Pan American in September 2025, so it is no longer a separate listed pick.
In this article
- Step 1: Pick the route – shares, a miners fund or a silver trust
- Step 2: Know where silver comes from and which company types exist
- How far silver prices have swung
- Step 3: Shortlist companies and funds with facts
- Step 4: Check cost per ounce and margin
- Step 5: Open a brokerage account and place the order
- Step 6: Size the position, plan for tax and review
- Juniors and developers: extra checks before you buy
- Using satellite data in due diligence
- Frequently asked questions
To buy silver stocks, you open a brokerage account, choose a route (single mining shares, a silver miners fund, or a fund that holds physical silver), check each company’s costs and output, and place a limit order. Silver traded at US$56.98 per troy ounce (bid) at 14:50 New York time on 15 October 2026, so this guide gives you the steps, the costs to expect, a table of listed names with their tickers, and two calculators. It states facts only. It is not investment advice.
Silver prices swing widely. The metal reached an all-time high above US$121 on 29 January 2026 and was in the mid-US$70s by early April, according to the Silver Institute (15 April 2026). Mining shares move with the metal and add company risks on top, so the steps below spend as much time on checking as on buying.
Step 1: Pick the route – shares, a miners fund or a silver trust
There are three common ways to get silver exposure through a normal brokerage account. They carry different risks, so decide this first.
| Route | What you own | Example (facts, dated) | Main cost | Main risk |
|---|---|---|---|---|
| Single mining shares | A part of one company | First Majestic (NYSE: AG, TSX: AG) | Broker fee and bid-ask spread | Mine, cost, country and management risk |
| Silver miners fund | A basket of mining shares | Global X Silver Miners ETF (SIL), 39 holdings | 0.65% total expense ratio (Global X, 14 October 2026) | Metal price plus company risk, spread across names |
| Physical-silver fund | Shares of a trust that holds silver bars | iShares Silver Trust (SLV) | 0.50% sponsor fee (iShares, 14 October 2026) | Silver price only; the trust sells silver to pay its fee |
A physical-silver fund tracks the metal. A mining stock is a business that sells silver, so it can fall even when the metal rises, for example if costs jump or a mine stops. Our comparison of silver ETFs and silver miners goes deeper on fees, holdings and risk. If you are weighing silver against other metals, see the sister guide on lithium stocks and the list of gold mining ETFs and stocks.
The U.S. Securities and Exchange Commission’s investor site explains that an exchange-traded fund (ETF) is an investment product that trades on an exchange like a stock. It also notes that exchange-traded commodity funds are a different type of product from the registered ETFs it describes, so read each fund’s prospectus before you buy.
Step 2: Know where silver comes from and which company types exist
Most silver is not mined for its own sake. The U.S. Geological Survey says silver is mainly a byproduct from lead-zinc, copper and gold mines, in that order, and that polymetallic deposits hold more than two-thirds of world silver resources (USGS Mineral Commodity Summaries, 2026). The Silver Institute forecasts that primary silver mines will supply 28% of silver mine production in 2026 (Silver Institute, February 2026). So a company can have “silver” in its name and still earn much of its money from gold, zinc or copper.
Chart
Silver mine production by country
Tonnes of silver, 2025 estimate; eight largest producers
That gives four company types:
- Primary silver producers. Silver is the main product. Example: First Majestic runs four underground mines in Mexico (First Majestic, July 2026).
- Diversified producers. Silver comes with gold, zinc or copper. Pan American Silver reported gold, zinc, lead and copper output alongside silver in its second quarter of 2026.
- Streaming and royalty companies. They pay money up front to a mine owner and receive a share of the metal at a low agreed price. Wheaton Precious Metals reported streaming and royalty agreements on 23 operating mines and 25 development and other assets (Wheaton, March 2026). Our guide to gold streaming and royalty companies explains the model.
- Juniors and developers. Early-stage firms that own projects but do not yet run a mine. They carry the most risk (see the section on juniors below).
The chart shows which countries mine the most silver, so you can see where the geographic risk sits. Mexico was first with an estimated 6,300 tonnes in 2025, ahead of Peru and China.
How far silver prices have swung
Price history is the best reason to size positions carefully. The USGS lists the yearly average bullion price at US$21.88 per troy ounce in 2022 and an estimated US$38 in 2025 (USGS, 2026). The Silver Institute puts the rise in the 2025 average price at 42% (Silver Institute, April 2026); it uses a different price series from the USGS estimate, which gives a smaller rise (US$28.37 to US$38). Inside 2026 the swings were far larger than the yearly averages show: above US$121 on 29 January, mid-US$70s in early April, and US$56.98 on 15 October (Kitco).
Chart
Average silver bullion price
US$ per troy ounce, yearly average (2025 estimate)
The same fund page that lists SLV shows a three-year standard deviation of 45.13% as of 30 September 2026 and a 52-week net asset value range of US$42.13 to US$107.35 (iShares, 14 October 2026). Standard deviation measures how widely returns have varied, so a higher number means a bumpier ride.
On supply and demand, the Silver Institute reports that world silver demand fell 2% in 2025 to 1.13 billion ounces, that mine production rose 3% to 846.6 million ounces, and that 2025 was the fifth straight year in which demand exceeded supply (Silver Institute, April 2026). Its February outlook expected a sixth deficit year in 2026. These are forecasts from one source, not promises, and prices have not followed them in a straight line.
Step 3: Shortlist companies and funds with facts
The table lists listed names with their tickers and 2025 silver output as reported in company filings. It is a fact sheet, not a ranking or a recommendation. Other silver companies exist, and MAG Silver is no longer one of them as a separate stock: Pan American completed the MAG Silver acquisition on 4 September 2025 and now holds MAG’s 44% interest in the Juanicipio mine (Pan American, 2026).
Chart
Silver output of six listed companies, 2025
Million ounces; attributable or delivered basis, selected companies
| Company or fund | Listing and ticker | Silver output, 2025 | Type | Fact to check next |
|---|---|---|---|---|
| Fresnillo plc | London and Mexican exchanges: FRES | 48.7 Moz attributable, including Silverstream | Primary producer, Mexico | 2026 silver guidance of 42.0 to 46.5 Moz |
| Pan American Silver | NYSE: PAAS, TSX: PAAS | 22.8 Moz attributable | Diversified producer, Americas | Silver-segment AISC of US$17.80 per ounce in Q2 2026 |
| Wheaton Precious Metals | NYSE, TSX and London: WPM | 22.3 Moz produced | Streaming | Largest holding in SIL (24.65%) |
| Coeur Mining | NYSE: CDE | 17.9 Moz | Diversified producer | Silver up 57% on 2024 |
| Hecla Mining | NYSE: HL | 17.0 Moz | Primary and diversified, US and Canada | 2026 guidance of 15.1 to 16.5 Moz |
| First Majestic Silver | NYSE: AG, TSX: AG | 15.4 Moz | Primary producer, Mexico | 2026 guidance of 14.6 to 15.5 Moz |
Moz means million troy ounces. Output bases differ: “attributable” counts only the company’s ownership share, and Wheaton’s figure is silver produced at the mines behind its streams (it sold 19.8 Moz), not silver it mines itself. Sources: Fresnillo preliminary results, Pan American 2025 results, Wheaton 2025 results, Coeur 2025 results, Hecla 2025 results and First Majestic 2025 results. Fresnillo describes itself as the world’s largest primary silver producer; that is its own claim.
Funds are the other half of the shortlist. SIL tracks the Solactive Global Silver Miners Total Return Index, and its top three holdings on 14 October 2026 were Wheaton (24.65%), Pan American (11.41%) and Coeur (9.86%) (Global X). SILJ follows the Nasdaq Junior Silver Miners Index, holds 68 companies and charges a 0.69% total expense ratio; on 15 October 2026 its largest positions were Hecla (10.08%), First Majestic (9.69%) and Coeur (9.60%) (Amplify ETFs). Holdings change, so check the fund page on the day you look. For a longer list of producers and juniors, read our overview of silver miners and the list of active silver mining companies. For one company in detail, see the profile of First Majestic and its mines.
Step 4: Check cost per ounce and margin
A silver miner’s profit is the gap between the price it gets and what it costs to produce an ounce. The standard cost measure is all-in sustaining cost (AISC): the cash cost of mining plus the spending needed to keep the mines running. It is a non-GAAP figure, which means companies calculate it their own way, so compare definitions before comparing numbers. First Majestic says this directly in its release and reports AISC per silver-equivalent ounce, using fixed metal prices (silver US$52 and gold US$3,900 per ounce) and a gold-to-silver ratio of 75:1. It guided 2026 AISC to US$27.69 to US$28.77 per silver-equivalent ounce (First Majestic, July 2026). Pan American instead reports a silver-segment AISC net of credits from other metals: US$17.80 per ounce in the second quarter of 2026. The two numbers are not comparable like for like.
Chart
Pan American: realised silver price and silver AISC
US$ per ounce, second quarter of each year
The chart shows Pan American’s realised silver price and silver-segment AISC for the second quarter of each year. The price rose from US$32.91 to US$70.97 while AISC fell from US$19.66 to US$17.80, so the gap between them widened sharply. Miners earn more when the price rises faster than costs, and they lose it just as fast when it falls. A company with an AISC close to the silver price has little room for error.
Also check: how much revenue comes from silver itself (First Majestic reported 60% in the fourth quarter of 2025), how much debt the company carries, whether it sells forward (hedges) part of its output, and how long the mines are expected to last. Read the annual report and the latest quarterly release for each, not a summary site.
Calculator
What margin does a silver miner keep per ounce?
Enter a price, a cost per ounce and annual output.
- Margin per year: $25,000,000
- Margin as % of price: 50.0
- Margin per year after the price fall: $15,000,000
Example values only, not benchmarks. Silver price is an input: example, use today’s price. Enter the company’s reported AISC and check how it defines it, including by-product credits. All money in US$.
Step 5: Open a brokerage account and place the order
Any broker that lets you trade the exchange where the shares are listed will do. NYSE-listed names such as AG, PAAS, HL and CDE trade in US dollars. London-listed Fresnillo needs a broker with London access and may involve currency conversion. Ask each broker for its fee schedule, including commissions, currency conversion charges and fees on foreign shares.
When you place the order, the SEC’s investor site describes three common types. A market order executes at once but not at a guaranteed price. A limit order buys at your price or better. A stop order becomes a market order when the stop price is reached (Investor.gov). Silver shares can move several percent in a day, and a stop order can fill well away from your stop price in a fast market, so many investors prefer limit orders for volatile names.
The calculator below adds up what a purchase really costs once the spread (the gap between the buy and sell price) and any currency fee are included. The default numbers are examples only.
Calculator
What does your order really cost?
Enter your own share count, price and fees. Results update as you type.
- Order value at quoted price: $2,500
- Total paid: $2,502.50
- Costs as % of order value: 0.10
Example values only, not benchmarks or advice. Share price is an input: example, use today’s price. Spread and currency fee are percentages you set from your broker’s quote and fee schedule. All money in US$.
Step 6: Size the position, plan for tax and review
Decide in advance what share of your portfolio silver can take, and what you will do if the position falls by half. Silver fell from above US$121 on 29 January 2026 to US$56.98 on 15 October 2026 (Silver Institute; Kitco). Write down the reason you bought, then check it against each quarterly report.
Tax rules differ by country and by product. The U.S. Internal Revenue Service lists net gains from selling collectibles such as coins at a maximum 28% rate, while other long-term gains use lower rates (IRS Topic 409). Whether a given silver fund is taxed as a collectible depends on its structure, so ask a tax professional before you buy, and check how dividends from foreign companies are taxed where you live.
Review on a schedule: when quarterly results come out, when guidance changes, and when the silver price moves far from the level the company used in its own guidance. First Majestic raised its production guidance for 2026 to 14.6 to 15.5 million ounces in July 2026 and raised its AISC range in the same release, a reminder that good volume news can come with higher costs. Its third-quarter release on 8 October 2026 reported 3.4 million silver ounces and said a 12-day labour dispute at San Dimas drove the lower output (First Majestic, October 2026); the guidance figures here are from the July release.
Juniors and developers: extra checks before you buy
Juniors do not yet earn silver revenue. Their shares depend on drill results and on financing. Before buying one, check: who owns the licence and when it expires, the size and grade of the resource and which reporting standard (NI 43-101 in Canada, JORC in Australia) it follows, whether a feasibility study exists, how much cash the company holds against planned spending, and how many new shares it may issue. A grade of “grams per tonne” or “ounces per tonne” only matters next to the cost of mining and processing it.
Exploration claims are hard to judge from a press release. Independent tools can show whether the ground matches a company’s story, and the video below explains how artificial intelligence is used in mineral exploration and where it fails.

▶ Explains how AI is used in mineral exploration, where it fails and how to check any claim. · 4:37
Using satellite data in due diligence
Satellite images cannot confirm a silver grade. They can map rock types, alteration and structures on a licence, which helps an investor check that a company’s maps and claims are consistent. The video below covers what satellite exploration cannot do. Farmonaut produces satellite mineral reports from a KML, KMZ or polygon file; you can read about satellite-based mineral detection or send a project area, or contact the team. The output is an exploration target, not a resource estimate.
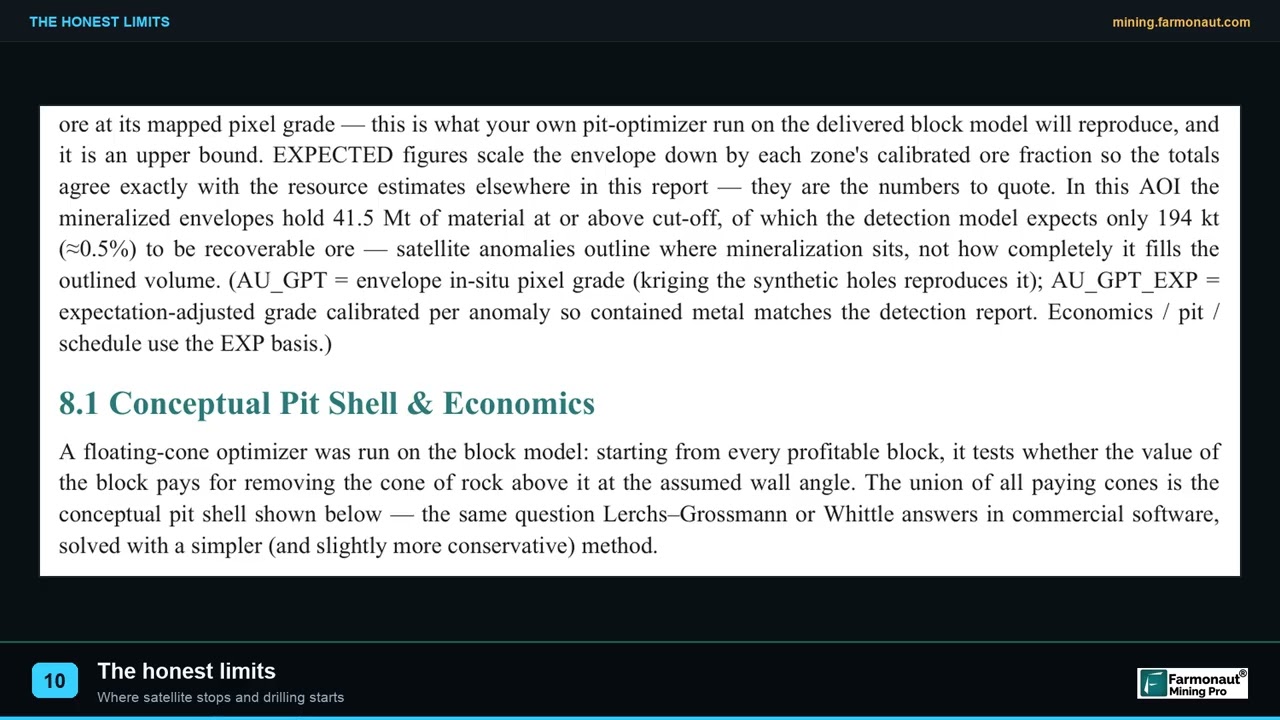
▶ Covers the limits of satellite exploration that matter in mining due diligence. · 2:08
Frequently asked questions
How do I buy silver stocks for the first time?
Open an account with a broker that offers the exchange you want, fund it, search for the ticker, choose a limit order and enter the number of shares. Read the company’s latest quarterly release first.
Can I buy silver stocks with a small amount of money?
Yes, if your broker allows it. One share of Pan American was priced near US$42 on 14 October 2026 in the SIL holdings table (Global X), so a small budget buys a few shares. Watch fixed fees, which weigh more on small orders.
What is the difference between silver stocks and silver ETFs?
A silver stock is a share in one company. A silver miners ETF holds many such shares (SIL holds 39). A physical-silver fund such as SLV holds silver bars and tracks the metal.
Do silver stocks follow the silver price?
They are linked, but not one for one. In the second quarter of 2026 Pan American’s realised price more than doubled against a year earlier while its AISC fell, which magnified profit. Costs, mine problems and debt can break the link in either direction.
Which silver companies pay dividends?
Check each company’s latest release. First Majestic announced an increased quarterly dividend with its first-quarter 2026 results, and Global X’s SIL showed a semi-annual distribution of US$0.11 per share in June 2026. Amounts and dates change.
Where is most silver mined?
Mexico, with an estimated 6,300 tonnes in 2025, then Peru (3,600) and China (3,400) (USGS, 2026).
What does AISC mean for silver miners?
All-in sustaining cost, a company-defined measure of what it costs to produce and sustain output. Compare how each firm defines it, including by-product credits.
Is silver a byproduct of other metals?
Mostly. The USGS says silver is mainly a byproduct of lead-zinc, copper and gold mining, and the Silver Institute expects primary silver mines to supply 28% of mine production in 2026.
Are silver mining stocks safer than silver bullion?
Neither is safe in a simple sense. Bullion carries only price risk. Mining shares add operating, cost, country and financing risks.
Which exchange should I use for silver stocks?
Use the exchange your broker supports and where the company is listed. Several firms list in both New York and Toronto, so you can often trade the New York line in US dollars.
How are silver stock gains taxed?
It depends on your country and the product. In the US, collectibles are taxed at up to 28% (IRS Topic 409), and stocks usually follow ordinary capital gains rules. Ask a qualified adviser.
This page is for information only. It is not investment advice. Prices, holdings and fees change; check each company’s filings and your broker before you trade.
Farmonaut mining
Get a quote to check a silver licence from space
Send a KML, KMZ or polygon and Farmonaut screens the area from satellite images, giving an exploration target to test a company's claims.

Mining Pro sample view, synthetic data
Keep reading
Sources
- Kitco, Silver price (15 Oct 2026): kitco.com
- USGS, Mineral Commodity Summaries 2026: Silver: pubs.usgs.gov
- Silver Institute, World Silver Survey 2026 press release (15 Apr 2026): silverinstitute.org
- Silver Institute, 2026 outlook (10 Feb 2026): silverinstitute.org
- First Majestic, Q2 2026 production and guidance (8 Jul 2026): newsfilecorp.com
- First Majestic, Q4 and full-year 2025 results: firstmajestic.com
- Pan American Silver, Q2 2026 report (12 Aug 2026): panamericansilver.com
- Pan American Silver, Q4 and full-year 2025 results: s202.q4cdn.com
- Wheaton Precious Metals, Q4 and full-year 2025 results: s203.q4cdn.com
- Hecla Mining, Q4 and full-year 2025 results: s29.q4cdn.com
- Coeur Mining, Q4 and full-year 2025 results: s201.q4cdn.com
- Fresnillo plc, Preliminary results 2025: investegate.co.uk
- Global X, Silver Miners ETF (SIL) fund page: globalxetfs.com
- Amplify ETFs, SILJ fund page: amplifyetfs.com
- iShares, Silver Trust (SLV) fund page: ishares.com
- Investor.gov (SEC), Types of orders: investor.gov
- Investor.gov (SEC), Investor bulletin: exchange-traded funds: investor.gov
- IRS, Topic 409 capital gains and losses: irs.gov
- First Majestic, Q3 2026 production results (8 Oct 2026): theglobeandmail.com
- First Majestic, Q1 2026 results and increased dividend: firstmajestic.com
Discussion
Questions, corrections or field experience? Share them below. First-time comments are reviewed before they appear, and your email is never published.
No comments yet. Be the first to add a question or your experience.

 SRK Consulting
 Berks Gold Limited
 Mwerezi Minerals Company Limited
 Mining SARL
 SenGold Invest SAS
 Sania Corporation
 Sean Mining Limited
 NTS Group (Pty) Ltd
 Mine4Africa
 Lithspo Minerals Limited
 Tintina Mining Group
 Dalgety Minerals Pty Ltd
 Vortex Minerals Pty Ltd
 Faith At Work (Pty) Ltd
 Geotech Mining Solutions plc
 Vulcan International Limited

 Licence holder · Nigeria · Gold + lithium










