

Silver mines · Ranked list
Best Silver Mines to Invest In: 10 Big Mines Compared
Juanicipio in Mexico was the largest of ten big silver mines compared, at about 17.2 Moz in 2025 on a whole-mine basis. Mines, owners, risks and a margin calculator. Not investment advice.
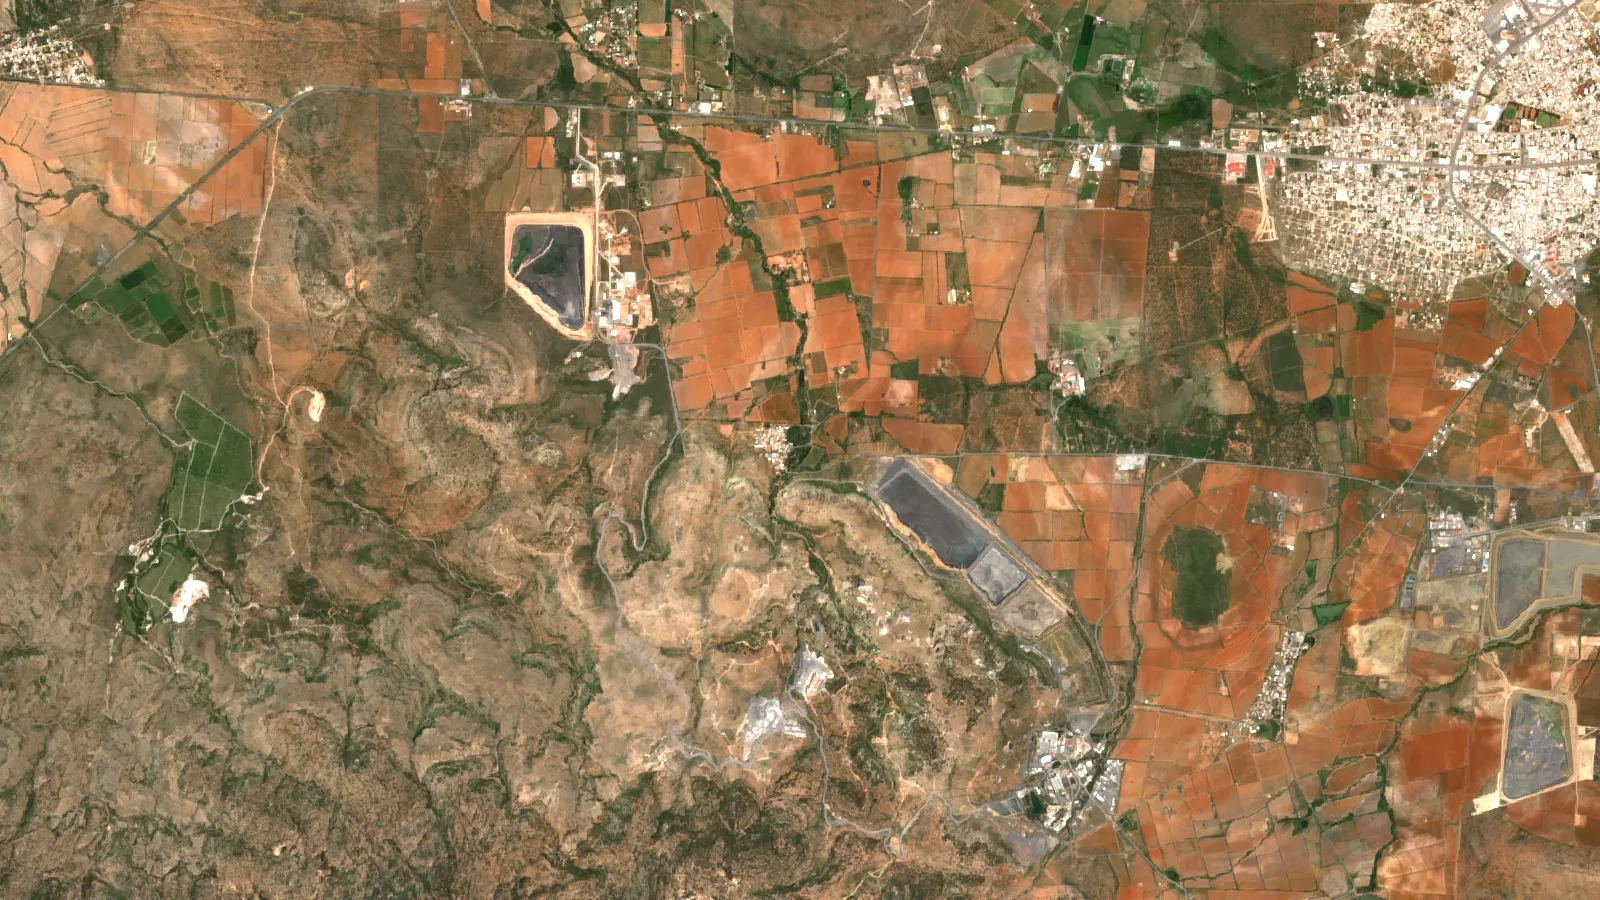
Key takeaways
- Juanicipio produced about 17.2 Moz of silver in 2025 on a whole-mine basis (calculated from Fresnillo’s 56% share); Saucito reported 13.8 Moz and the Fresnillo mine 10.3 Moz (company reports, 2026).
- Silver is mostly a by-product: the Silver Institute expects primary silver mines to supply 28% of mine output in 2026 (Silver Institute, February 2026).
- Fresnillo’s silver output fell 13.5% in 2025 to 48.7 Moz, while Coeur (17.9 Moz) and First Majestic (15.4 Moz) grew sharply (company results, 2026).
- Silver traded above US$121 on 29 January 2026 (Silver Institute) and at a bid of US$56.98 on 15 October 2026 (Kitco).
- MAG Silver was bought by Pan American and delisted in September 2025; Pan American now holds 44% of Juanicipio (Pan American, 2025).
In this article
- Which silver mines can you invest in?
- How the mines were ranked
- Ten big silver mines compared by output
- The five owners behind these mines
- Ways to own silver mining exposure
- What moves a silver miner's profit
- Silver price and output by country
- Risks to check before buying any silver miner
- Screening a silver project from space
- Frequently asked questions
You cannot buy a silver mine on a stock exchange. You buy shares in the company that owns it, so the useful question is which mines are big, who owns them and how their owners are doing. Among the mines of the five listed producers compared here, Juanicipio in Mexico was the largest in 2025, at about 17.2 million troy ounces (Moz) of silver on a whole-mine basis, and Saucito was the largest reported directly, at 13.8 Moz, according to the annual report of its owner Fresnillo plc. This page compares ten big silver mines by output, names the company behind each one and sets out the risks that decide whether owning the shares works out.
Terms used below. A troy ounce is 31.1035 grams, and Moz means million ounces. A primary silver mine earns most of its revenue from silver; many mines earn more from gold, lead, zinc or copper and sell silver as a by-product. AISC (all-in sustaining cost) is the cost per ounce of keeping a mine running, as each company defines it, often after subtracting by-product income. Attributable output is the share of a mine’s metal that belongs to the company after partners take their part. This page is for information only and is not investment advice.
Which silver mines can you invest in?
Only the companies that own them. A buyer of shares gets a claim on the whole company, with all its mines, debts, taxes and managers, not on one orebody. The main routes are shares in a silver-focused producer, shares in a gold or copper miner that also makes silver, a fund that holds many miners, and a royalty or streaming company that pays upfront for a share of a mine’s future silver. Our guide to silver ETFs versus mining stocks compares those routes, and our list of silver, gold and copper mining companies puts the producers side by side.
Chart
Silver mined by eight countries, 2025
Tonnes, USGS estimate; world total 26,000 tonnes
World mine output of silver was 846.6 Moz in 2025, according to the Silver Institute’s World Silver Survey 2026. Most of it does not come from silver mines in the strict sense. The USGS notes that silver is mainly a by-product of lead-zinc, copper and gold mines, in that order of volume, and the Silver Institute’s 2026 outlook expects primary silver mines to supply 28% of mine output in 2026. For an investor this means two things: a share in a “silver miner” is often also a bet on gold, zinc or lead prices, and the number of pure silver mines is small.
By country, the USGS Mineral Commodity Summaries 2026 estimates Mexico at 6,300 tonnes of the world’s 26,000 tonnes in 2025, about a quarter, ahead of Peru at 3,600 and China at 3,400. That is why so many mines in the ranking below are Mexican, and why Mexican tax and permit rules matter to the owners.
How the mines were ranked
The ranking uses silver ounces that the owner reported for calendar 2025, taken from company results we opened. It covers mines of Fresnillo, Pan American, Hecla, Coeur and First Majestic. It is not a ranking of the whole world: mines in Russia, and mines whose operators report silver only inside a metal-equivalent figure, are left out because their silver output could not be checked in the same way. All mines are ranked on one basis, 100% of the mine’s output. Fresnillo reports Juanicipio at its 56% share and First Majestic reports Los Gatos at its 70% share, so for those two we divided the reported ounces by the ownership share. Those two figures are our calculation, not company-reported numbers. Size is not quality. A big mine can have high costs, falling grades or a short life, so the ranking is a starting point for reading the company reports, not a buy list.
Ten big silver mines compared by output
| Rank | Mine | Country | Owner (listing) | 2025 silver, whole mine (Moz) | Basis |
|---|---|---|---|---|---|
| 1 | Juanicipio | Mexico | Fresnillo plc 56%, Pan American 44% (NYSE and TSX: PAAS) | 17.2 | Calculated from Fresnillo’s 56% share |
| 2 | Saucito | Mexico | Fresnillo plc (LSE: FRES) | 13.8 | Reported |
| 3 | Fresnillo | Mexico | Fresnillo plc (LSE: FRES) | 10.3 | Reported |
| 4 | Greens Creek | United States (Alaska) | Hecla (NYSE: HL) | 8.7 | Reported |
| 5 | Los Gatos | Mexico | First Majestic (NYSE and TSX: AG) 70% | 8.4 | Calculated from First Majestic’s 70% share |
| 6 | San Julián Veins | Mexico | Fresnillo plc (LSE: FRES) | 8.3 | Reported, veins only |
| 7 | Palmarejo | Mexico | Coeur (NYSE and TSX: CDE) | 6.5 | Reported |
| 8 | Rochester | United States (Nevada) | Coeur (NYSE and TSX: CDE) | 6.1 | Reported |
| 9 | La Colorada | Mexico | Pan American (NYSE and TSX: PAAS) | 6.0 | Reported |
| 10 | San Dimas | Mexico | First Majestic (NYSE and TSX: AG) | 5.4 | Reported |
Chart
Silver at the largest eight of ten mines compared, 2025
Million troy ounces, whole-mine basis; Juanicipio and Los Gatos calculated from ownership shares; ranks 9 and 10 are in the table
Sources: Fresnillo annual report (Saucito 13,791 thousand ounces, Fresnillo 10,273, Juanicipio 9,643 at 56%, San Julián Veins 8,293); Hecla’s fourth-quarter 2025 release; Coeur’s fourth-quarter 2025 release; Pan American’s 2025 production release; First Majestic’s full-year 2025 release. Not in the ten, because the list is a subset of the world’s silver mines, were Lucky Friday in Idaho (Hecla, a record 5.3 Moz) and Las Chispas in Mexico (Coeur, 5.1 Moz, for the part of 2025 after Coeur completed its purchase in mid-February).
Juanicipio tops the table only after this adjustment. Fresnillo reports 9,643 thousand ounces as its 56% share, and its ownership table shows Pan American holding the other 44%, so the whole mine implies about 17.2 Moz. Los Gatos works out the same way: 5,869,370 ounces at a 70% share gives about 8.4 Moz. Pan American said Juanicipio added 2.5 Moz to its own output in the months from its September 2025 purchase of MAG Silver.
The five owners behind these mines
Fresnillo plc (London: FRES)
Profile: the largest Mexican silver exposure of the five, and a company that pays dividends. Fresnillo describes itself as the world’s largest primary silver producer. Its attributable silver output was 48.7 Moz in 2025, down 13.5% from 56.3 Moz, and it paid out US$950.0 million in dividends for the year, with net cash of US$1,916.6 million, according to its preliminary results (March 2026). Watch: output is falling. The company cites a stopped mining zone at San Julián, lower grades and a lower contribution from the Silverstream contract, and it ended that contract after trouble at the Sabinas mine. Its half-year report shows first-half 2026 silver output of 22.0 Moz, down 11.4%, with full-year guidance of 42.0 to 46.5 Moz. Mexico’s mining rights charge also rose from 7.5% to 8.5% in 2025.
Chart
Silver output at six mines, 2024 and 2025
Million troy ounces; Juanicipio at Fresnillo’s 56% share
Pan American Silver (NYSE and Toronto: PAAS)
Profile: silver and gold mines spread across several countries in the Americas. Attributable silver output was 22.8 Moz in 2025 against 21.1 Moz in 2024, and the silver segment’s AISC was US$13.88 per ounce against an average realized silver price of US$40.78, per its full-year results. It completed the purchase of MAG Silver on 4 September 2025 for US$500 million in cash and about 60.2 million shares, which gave it the 44% of Juanicipio. MAG Silver shares no longer trade, so the company is not an investment option on its own any more. Watch: the Escobal mine in Guatemala is not operating, and the company says there is no date for a restart. Shares outstanding rose from 363.0 million to 421.8 million over 2025. Guidance for 2026 is 25 to 27 Moz of silver, repeated in its second-quarter 2026 report (August 2026).
Hecla Mining (NYSE: HL)
Profile: a producer whose silver mines are all in the United States and Canada. Hecla produced 17.0 Moz of silver in 2025, up from 16.2 Moz, from Greens Creek (8.7 Moz), Lucky Friday (5.3 Moz, a record) and Keno Hill in the Yukon (3.0 Moz). Its silver AISC was US$11.28 per ounce after by-product credits, per the same Hecla release. Watch: that low cost depends on gold, zinc and lead credits, so it moves with those prices as well. At Greens Creek the AISC was negative, which shows how large the credits are. Hecla’s second-quarter 2026 release (August 2026) sets 2026 silver guidance at 15.1 to 16.1 Moz, cut from 15.1 to 16.5 Moz and lower than 2025, with Keno Hill now expected at 2.2 to 2.6 Moz after a lower-grade zone. Hecla also agreed to sell its Casa Berardi gold mine.
Coeur Mining (NYSE and Toronto: CDE)
Profile: a mixed gold and silver producer in North America and Mexico. Silver output was 17.9 Moz in 2025 against 11.4 Moz in 2024 (up 57%), helped by the SilverCrest purchase that added Las Chispas, per the Coeur release linked above. Gold was larger by value: 419,046 ounces. Watch: after buying New Gold, Coeur’s second-quarter 2026 report expects about 690,000 ounces of gold and 20 million ounces of silver for 2026 at the guidance mid-point, so the company is now mainly a gold miner that also makes silver.
First Majestic Silver (NYSE and Toronto: AG)
Profile: Mexican primary silver, with a recent step up in size. Silver output was a record 15.4 Moz in 2025 against 8.4 Moz in 2024, because of the Gatos Silver purchase completed on 16 January 2025, which added the 70% interest in Los Gatos, per its release linked above. AISC was US$21.17 per silver-equivalent ounce, a different basis from the silver-only costs of Pan American and Hecla. Watch: in its July 2026 update it raised 2026 silver guidance to 14.6 to 15.5 Moz, close to 2025 output, and reported labour disruptions at San Dimas.
Ways to own silver mining exposure
Shares of one company give the clearest link to its mines but carry company-specific risk. A fund spreads that risk: the Global X Silver Miners ETF (SIL) describes its aim as exposure to silver mining companies rather than to the physical metal. The U.S. Securities and Exchange Commission’s investor site explains that ETF shares trade at market prices that can sit above or below the value of the fund’s holdings. A streaming company is a third route. Wheaton Precious Metals reported 22,289 thousand silver ounces produced under its agreements in 2025 in its annual results, and a stream pays a fixed price per ounce, so it avoids mine operating cost but also gives up control of the mine. For the numbers on top producers, see our top silver producing companies page and the silver stocks and active mines guide.
What moves a silver miner’s profit
Profit depends on the gap between the silver price and the cost of each ounce, so a price move is magnified in earnings. Pan American’s average realized silver price rose from US$28.06 to US$40.78 per ounce between 2024 and 2025, and its net earnings rose from US$113 million to US$980 million. Fresnillo’s silver output fell 13.5% in 2025, yet its EBITDA rose 80.7% to US$2.8 billion because prices were higher. The same effect works in reverse. The Silver Institute reports an annual average price up 42% in 2025 and a record above US$121 on 29 January 2026, then a fall to the mid-US$70s in early April. Kitco showed a silver bid of US$56.98 on 15 October 2026, roughly half of the January high.
Chart
Average silver price, 2021 to 2025
US dollars per troy ounce; 2025 is a USGS estimate
Costs also differ a lot, even inside one company. Fresnillo’s annual report lists AISC for 2025 of US$12.9 at Juanicipio, US$18.9 at Saucito, US$19.8 at San Julián Veins and US$27.0 at the Fresnillo mine, each in US dollars per equivalent silver ounce (silver plus by-product metals converted to silver), on the company’s own definition. A low-cost mine keeps a margin when the price falls; a high-cost mine may not. The calculator below lets you test an output, a price and a cost of your own.
Calculator
What margin does a silver mine earn at your price?
Enter your own output, price and cost.
- Margin per ounce: $35
- Margin as share of price (%): 63.6
- Margin per year after the price fall: $185,000,000
Example values only, not a forecast or a benchmark. The price and the cost are inputs: use today’s price. For reference, Kitco showed a silver bid of US$56.98 on 15 October 2026, and Pan American reported a silver segment AISC of US$13.88 per ounce for 2025. AISC is defined differently by each company and often subtracts by-product income. The result ignores tax, royalties not in the cost, and the timing of sales. Amounts are in US dollars.
Silver price and output by country
The USGS puts the average silver price at US$25.23 per troy ounce in 2021, US$21.88 in 2022, US$23.54 in 2023, US$28.37 in 2024 and an estimated US$38 in 2025. Production is concentrated: Mexico, Peru and China together made about 13,300 of the 26,000 tonnes mined in 2025, and the United States made 1,100. The charts on this page use these USGS values and the company figures above, each with its source and date.
Risks to check before buying any silver miner
- Price swings. The metal moved from about US$121 to about US$57 in under nine months (Silver Institute and Kitco figures above). Mining shares can move further than the metal.
- Falling output. Fresnillo’s 2025 silver output fell 13.5% and its 2026 guidance is lower again. Read the grade and tonnes milled for each mine.
- Tax and permits. Mexico raised its mining rights charge from 7.5% to 8.5% in 2025. Pan American’s Escobal mine in Guatemala is stopped under a court order and a consultation process with no end date.
- Ownership changes. A company named in an old list may no longer exist as a listed stock. MAG Silver was bought and delisted in September 2025, and Coeur bought both SilverCrest and New Gold.
- By-product dependence. Hecla’s silver cost looks very low only because gold, lead and zinc income is subtracted. A fall in those metals raises the cost per silver ounce.
- Share count. Buying another company with shares dilutes existing holders, as Pan American’s 16% rise in shares outstanding in 2025 shows.
- Different bases. Compare silver-only, equivalent-ounce and after-credit costs only with their definitions in hand.
Smaller exploration companies add a further test: whether their resource figures come from a published technical report written by a named qualified person, and whether the drilling supports them. A press release is not a resource estimate.

▶ Explains what AI in mineral exploration really does, where it fails and how to check any claim. · 4:37
Screening a silver project from space
Before drilling, geologists use satellite images to map rock types, iron-oxide staining and clay alteration that often surround silver-bearing veins. Farmonaut offers this kind of screening for a licence area: you send a boundary as KML, KMZ or a polygon, and the result is a set of satellite-derived exploration targets, delivered in 5 to 20 business days. These are targets that sit ahead of a resource estimate, not a measured resource, and the work cannot value a listed company. For a regional example of how satellite imagery is used in mining, see our satellite imagery uses in Brazil guide.
▶ Explains how satellites map the rock around a deposit, since they cannot see metal itself. · 4:25
If this topic matters to you, read How to Buy Silver Stocks: 6 Steps With Costs next.
Related reading on this site: Montana Gold and Silver Mines: Open, Closed, Proposed.
Frequently asked questions
What is the best silver mine to invest in?
No mine can be bought on its own, and no source ranks mines by investment merit. By 2025 output, Juanicipio (about 17.2 Moz) and Saucito (13.8 Moz), both operated by Fresnillo plc, lead the mines we compared. Output says nothing about cost, life or share price.
Which silver mine produces the most silver?
Among the mines of Fresnillo, Pan American, Hecla, Coeur and First Majestic, Juanicipio in Mexico was largest in 2025, at about 17.2 Moz for the whole mine (our calculation from Fresnillo’s 56% share), followed by Saucito at 13.8 Moz. Mines of other companies were not part of this comparison.
How do I invest in silver mines?
Through a brokerage account you can buy shares of a mining company or units of a fund that holds miners. Royalty and streaming companies are a third option. A licensed adviser can say which suits your situation.
Are silver miners a better choice than physical silver?
They are different assets. Physical silver follows the metal price. A miner also carries costs, tax, management and mine risk, and in return can pay dividends: Fresnillo paid out US$950.0 million for 2025. Neither is guaranteed to rise.
Are there silver mines in Canada?
Yes. The USGS estimates Canada’s 2025 mine output at 400 tonnes. Hecla’s Keno Hill mine in the Yukon produced about 3.0 Moz in 2025. Much of Canada’s silver also comes as a by-product of base-metal and gold mines.
Is MAG Silver still a stock I can buy?
No. Pan American completed its acquisition of MAG Silver on 4 September 2025 and MAG shares were delisted. The way to hold that exposure is Pan American, which owns 44% of Juanicipio.
How much silver comes from by-product mining?
Most of it. The USGS says silver is mainly a by-product of lead-zinc, copper and gold mines, and the Silver Institute expects primary silver mines to supply 28% of mine output in 2026.
What does AISC mean for a silver miner?
All-in sustaining cost is a company’s cost per ounce, including mining, processing, overhead and the capital needed to keep output steady. Definitions differ, and by-product credits can push it very low, so compare it only with the definition in each report.
Is silver or gold the better investment?
That is a personal decision and this page gives no advice. For context, the Silver Institute said the gold to silver price ratio fell below 50 in January 2026, and Coeur’s average realized prices for the second quarter of 2026 were US$4,140 per ounce of gold and US$71.18 per ounce of silver.
Do silver mining shares follow the silver price?
They tend to move in the same direction, but not by the same amount. Pan American’s realized price rose about 45% from 2024 to 2025 while its net earnings rose from US$113 million to US$980 million. Costs, taxes, share issues and gold or zinc prices also play a part.
Can satellites help check a silver project?
They can map surface clues such as alteration and rock types that point to targets worth sampling. They cannot measure silver grade or tonnes, which need drilling and a published technical report.
This page is for information only. It is not investment advice. Production and cost figures are company-reported on different bases; confirm them in each company’s filings before relying on them.
Farmonaut mining
Get satellite targets for your own licence
Send a licence boundary as KML, KMZ or a polygon and ask for a quote on satellite-derived exploration targets, ahead of any resource estimate.

Mining Pro sample view, synthetic data
Keep reading
Sources
- Wheaton Precious Metals, 2025 annual results (via Finviz): finviz.com
- First Majestic Silver, Q4 and full-year 2025 results (February 2026): firstmajestic.com
- USGS, Mineral Commodity Summaries 2026: Silver: pubs.usgs.gov
- Coeur Mining, Q4 and full-year 2025 results (February 2026): s201.q4cdn.com
- Pan American Silver, 2025 production and 2026 guidance (January 2026): s202.q4cdn.com
- Pan American Silver, completion of MAG Silver acquisition (4 September 2025): s202.q4cdn.com
- Pan American Silver, Q4 and full-year 2025 results (February 2026): s202.q4cdn.com
- Pan American Silver, Q2 2026 results (August 2026): s202.q4cdn.com
- Hecla Mining, Q4 and full-year 2025 results (February 2026): s29.q4cdn.com
- Silver Institute, World Silver Survey 2026 press release (April 2026): silverinstitute.org
- Silver Institute, 2026 silver market outlook (February 2026): silverinstitute.org
- Fresnillo plc, Annual Report and Accounts 2025: fresnilloplc.com
- Global X, Silver Miners ETF (SIL) fund page: globalxetfs.com
- Hecla Mining, Yukon operations (Keno Hill): hecla.com
- Fresnillo plc, Interim Results for the six months to 30 June 2026: investegate.co.uk
- Fresnillo plc, Preliminary Results for 2025 (March 2026): investegate.co.uk
- U.S. SEC Office of Investor Education, Exchange-Traded Funds bulletin: investor.gov
- Kitco, live silver price (15 October 2026): kitco.com
- Coeur Mining, Q2 2026 results (August 2026): nasdaq.com
- First Majestic Silver, Q2 2026 production and updated guidance (8 July 2026): newsfilecorp.com
- Hecla Mining, Q2 2026 results (August 2026): finance.yahoo.com
Discussion
Questions, corrections or field experience? Share them below. First-time comments are reviewed before they appear, and your email is never published.
No comments yet. Be the first to add a question or your experience.

 Berks Gold Limited
 Mwerezi Minerals Company Limited
 Congo Mining Solutions
 Mining SARL
 SenGold Invest SAS
 Sania Corporation
 Sean Mining Limited
 NTS Group (Pty) Ltd
 Mine4Africa
 Lithspo Minerals Limited
 Tintina Mining Group
 Dalgety Minerals Pty Ltd
 Vortex Minerals Pty Ltd
 Faith At Work (Pty) Ltd
 Geotech Mining Solutions plc
 Vulcan International Limited
 Kidepo Associates

 Licence holder · Nigeria · Gold + lithium










