

Geology · LiDAR guide
LiDAR Geology: Faults, Outcrop and Terrain Mapping
LiDAR turns laser pulses into a bare-earth terrain model with about 10 cm vertical accuracy (USGS), showing fault scarps, old workings and landslides under trees. Here is what it shows, what it costs in density, and where to download it.
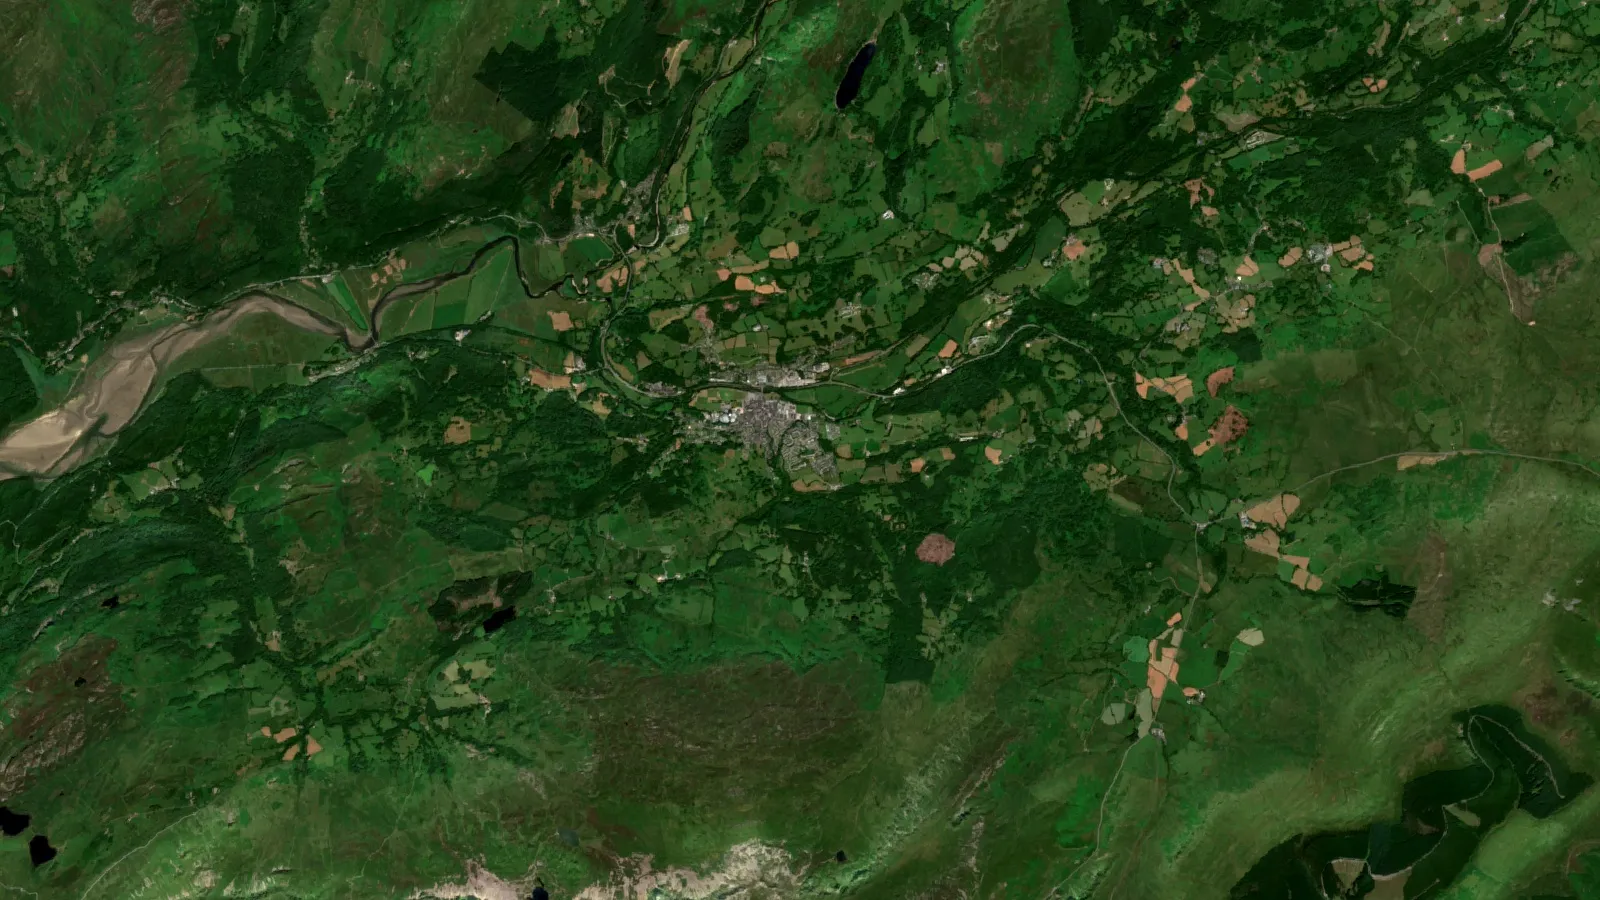
Key takeaways
- USGS describes lidar DEMs with a vertical accuracy of about 10 cm; the 3DEP quality levels run from 5 cm (QL0) to 20 cm (QL3) RMSEz.
- QL2, the usual public baseline, needs at least 2 pulses per square metre and a 1 m DEM cell (USGS 3DEP).
- Lidar reaches ground through gaps in the canopy; dense forest gives fewer ground points (NOAA, Lidar 101).
- A lidar DEM replaced a 1957 topographic base with 3 m vertical accuracy by one with about 0.3 m in a USGS geological map of Poverty Bay, Washington.
- Public lidar portals exist for the US, Canada, Australia, England, Wales and Scotland; the article lists each with what it offers.
In this article
- What LiDAR adds to geological work
- How LiDAR sees ground under trees
- LiDAR fault mapping: scarps, offsets and lineaments
- LiDAR geological mapping: outcrop, contacts and surficial deposits
- LiDAR for mineral exploration: structure, old workings and access
- Landslides, glacial landforms and terrain hazards
- Airborne LiDAR survey for mining: platforms and cost drivers
- LiDAR vs photogrammetry for terrain mapping
- Bare earth DEM: files, formats and visualisation
- LiDAR data sources by country
- How to use public lidar on a prospect: seven steps
- LiDAR and satellite imagery together
- Common mistakes with lidar data
- Frequently asked questions
LiDAR in geology means measuring the ground with a laser from an aircraft, a drone or a tripod, then stripping away trees and buildings to leave a bare-earth elevation model. In the USGS description, the laser pulses give a model of ground height with a vertical accuracy of about 10 centimetres (4 inches) (USGS). That is detailed enough to show a low fault scarp, an old shaft collar under forest, or the edge of a landslide that no aerial photograph can show. This guide explains what the data is, what it shows a geologist, how it compares with photogrammetry, and where to download it in the US, Canada, Australia and Britain.
LiDAR is short for light detection and ranging. It does not see rock type. It sees shape, and shape is a strong clue to structure, because faults, contacts, dykes and slides all leave marks in the terrain. Used well, a bare-earth model tells you where to walk, sample and drill. Used badly, it produces a map full of lines that belong to glaciers, roads and old tracks. The sections below show the difference.
What LiDAR adds to geological work
A LiDAR sensor fires laser pulses at the ground, many thousands each second, and times the return of each pulse. A positioning receiver and an inertial unit on the platform record where the sensor was and how it was tilted, so each return becomes a point with an x, y and z position. The result is a point cloud, often with millions of points per square kilometre. For the geologist, four things matter.
- Bare-earth terrain under vegetation. Some pulses pass through gaps in leaves and reach the ground. NOAA’s technical primer notes that lidar is able to see through holes in the canopy, and gives a rule of thumb: if you can look up and see sky through the trees, that spot can be measured (NOAA, Lidar 101).
- Fine detail. The USGS quality levels set nominal pulse spacing between 0.35 and 1.41 metres, so features a metre or two across can be resolved. A 1950s topographic map with 20-foot (6 m) contours cannot do that.
- Direct measurement, not interpretation. Heights are measured, so you can compute slope, offset and volume, not just draw outlines.
- Repeat surveys. Two surveys of the same area, taken years apart, show landslide movement, mine-dump growth or erosion by differencing the two models.
What LiDAR cannot do is tell you what the rock is, whether it carries gold, or how deep a structure goes. It measures the surface. Geologists pair it with field mapping, geochemistry, geophysics and spectral satellite data, which is covered in the sections on combining methods below.
▶ Remote sensing for mining in three minutes: the instrument families and why agreement between them matters. · 2:01
How LiDAR sees ground under trees
Returns, point clouds and the bare-earth model
One laser pulse can produce several echoes: from the top of a tree, from branches, from low shrubs and from the ground. NOAA explains that modern sensors can record at least three returns per pulse, and that middle returns are very unlikely to be ground (NOAA, Lidar 101). A computer then classifies the points: ground, low vegetation, high vegetation, buildings. The ground class is turned into a grid, which is the bare-earth digital elevation model, or DEM.
The USGS puts it in two steps: the data are first collected as a point cloud of individual points reflected from everything on the surface, including structures and vegetation, and the bare-earth DEM is produced by stripping those away (USGS). NOAA adds a warning that matters for geologists: a surface built only from last returns is not the same as a bare-earth surface, because last returns still land on buildings and dense vegetation.
Digital terrain model, digital surface model and what the names mean
The names vary by country, so check the metadata before you use a file.
- Digital terrain model (DTM) or bare-earth DEM: ground only. This is the one you want for faults and outcrop.
- Digital surface model (DSM): the top of everything, including canopy and roofs. Useful for vegetation height and for spotting where the bare-earth model has gaps.
- Intensity image: how strongly each pulse came back. The Environment Agency notes that intensity varies with the composition of the surface that reflected the pulse and the angle of incidence (Environment Agency, National LIDAR Programme).
When the ground is not reached
Dense evergreen forest, thick scrub and tall grass reduce the number of ground points. NOAA says dense forests with complete coverage often have few openings and so give poor ground representation, and that flying in leaf-off conditions helps for ground features in heavily forested areas. The Puget Sound lidar consortium flew in leaf-off conditions for exactly that reason (Haugerud and others, GSA Today). In practice, look at the ground-point density map that comes with a survey. As a practical rule, where ground points are sparse under canopy, treat small features as unproven.
LiDAR fault mapping: scarps, offsets and lineaments
Fault mapping is the classic geological use of LiDAR, because faults that moved in recent geological time leave small steps and offset streams in the ground. Under forest, aerial photographs cannot show them. A bare-earth model can.
The best-known early example is the Puget Lowland near Seattle. The Puget Sound Lidar Consortium collected more than 10,000 square kilometres of public-domain topography, flown with leaf-off conditions so that the model shows the ground under the canopy. The authors report that it revealed previously unknown surface-rupturing faults, deep-seated landslides, uplifted beaches and glacial features, and that more than half a dozen suspected postglacial fault scarps were identified (Haugerud and others, GSA Today 2003).
A second example is the San Andreas Fault in California. Zielke and co-authors used a lidar-based DEM to measure offset stream channels along the Carrizo segment and concluded that the average slip in the 1857 earthquake was 5.3 plus or minus 1.4 metres, well below the earlier figure of about 9 metres, which removed the assumption that rupture of the Carrizo segment controls recurrence (Zielke and others, Science 2010). The method is simple: map a stream channel, back-slip the model until the channel lines up across the fault, and read the offset.
How to spot a fault in a bare-earth model
- Make hillshades from several directions. A scarp running north-south is almost invisible when the sun is in the north. Use at least two illumination azimuths, for example 315 and 45 degrees, and compare them.
- Look for straight breaks in slope. A fault scarp is a linear step with the same face direction along its length. A road cut or a field boundary is also linear, so overlay roads and parcels before you draw.
- Look for offset drainages. Streams that jog sideways by the same amount where they cross a line suggest strike-slip movement.
- Check for linear valleys, saddles and aligned springs. These often follow weak, fractured rock along a structure.
- Confirm on the ground. Walk the line, look for gouge, breccia and slickensides, and log the dip. The model gives you where to look; the outcrop gives you the answer.
A caution: in terrain shaped by ice, many parallel lineaments are glacial grooves, drumlins and eskers, not faults. The ice direction, not the rock structure, controls them. Compare any lineament set with the known ice-flow direction before you read it as bedrock.
Lineaments and gold-bearing structures
Many gold systems sit on shear zones and faults. If you are mapping an orogenic gold belt, the structural trends from a bare-earth model are a starting layer for your target list. Our guide to shear zone gold explains which structure types hold ore and how to read them at the outcrop. Lineaments alone are not targets: a lineament that crosses a favourable rock, shows alteration in spectral imagery and sits over a geochemical anomaly is.
Chart
Vertical accuracy by quality level
RMSEz in centimetres, lower is better
LiDAR geological mapping: outcrop, contacts and surficial deposits
Geological survey maps were traditionally drawn on topographic bases of limited accuracy, and the geology was often interpreted from landforms on the base map. A 2014 USGS map of the Poverty Bay quadrangle in Washington shows the effect in numbers. The original topographic base was compiled in 1957, with 20-foot contours, a nominal horizontal resolution of 40 feet (12 m) and a nominal vertical accuracy of 10 feet (3 m). The lidar DEM that replaced it has a resolution of 6 feet (2 m) and a vertical accuracy of about 1 foot (0.3 m), and the authors say it allowed a new interpretation of the surficial deposits (Tabor, Booth and Troost, USGS SIM 3317).
What shows up in the model
- Resistant rock ridges. Dykes, quartz veins and hard sandstones stand out as straight or curved ridges. Soft rocks form valleys and saddles.
- Bedding and foliation. In areas with tilted layers, hillshades show strike ridges and dip slopes, which gives structural trends in places with no outcrop.
- Contacts between rock types. A change in slope texture, from smooth to hummocky, often follows a geological contact.
- Surficial deposits. Terraces, alluvial fans, moraines and landslide deposits have distinct shapes.
- Quarries, pits and dumps. The scale of past disturbance, including tailings and waste dumps, can be measured as volumes.
The USGS applies the same logic at national scale: its 3D Elevation Program page lists lidar acquisition aimed at improving knowledge of the geologic framework, including parts of Nevada and California (USGS, 3D Elevation Program). If you want a plain overview of how maps are built and read at different scales, see our guide to geological mapping methods and scales.
Chart
Old topographic base versus lidar DEM
Poverty Bay quadrangle, Washington: metres
LiDAR for mineral exploration: structure, old workings and access
For an explorer, a bare-earth model answers four practical questions before any money goes into the field.
- Where are the structures? Fault, shear and fold trends control many veins, skarns and breccias. A structural map from a bare-earth model costs a fraction of a drill hole and guides where the first traverses should go.
- Where has anyone mined before? Old workings are strong evidence that someone found mineralisation. In the Tamar Valley in south-west England, a survey that interpreted lidar imagery recorded the shafts, adits and spoil heaps of later mines very frequently, with more detail than aerial photographs and historic maps, and mapped earthworks in places where the ground is covered by trees (Devon Historic Environment Record). The same survey recorded that some earlier features had been levelled, which is useful too.
- How steep and wet is the ground? Slope, drainage lines and flood margins decide where roads, camps and drill pads can go, and how much a programme costs.
- Where might the surface hide something? Colluvium, landslide debris and glacial cover can mask bedrock. A bare-earth model shows their extent, so you can avoid sampling transported material and calling it residual.
A word of care on historic mines: the Tamar survey notes that some old workings, such as streamworks, can be hard to tell from geological formations. Treat every lidar-spotted pit or shaft as a hazard until you have checked it on foot with permission and safe practice. Old shafts can be open, flooded or unstable.
Where LiDAR sits next to other methods
LiDAR gives shape. Aeromagnetic and radiometric surveys give physical properties of rock, including under cover. Geochemistry gives metal content. Spectral satellite imagery gives surface mineralogy, such as iron oxides and clays. No single one finds a deposit; targets come from overlaps. Our comparison satellite imagery versus geochemistry versus geophysics sets out what each costs and what each answers. For the geophysical side of drone work, see drone geophysics, aeromagnetic and LiDAR mine surveys.
Landslides, glacial landforms and terrain hazards
Landslides are among the easiest things to see in a bare-earth model, because slides leave a scarp at the top, a hummocky body and a toe. The Oregon geological survey (DOGAMI) published a protocol for inventory mapping of landslide deposits from lidar imagery in 2009, with a geodatabase template (DOGAMI Special Paper 42). For a mine, the same approach screens pit walls, haul roads, waste dumps and tailings dams for movement. Repeat surveys show whether a slope is creeping.
The Puget Lowland work found deep-seated landslides, uplifted beaches and subglacial and periglacial features in the same dataset (Haugerud and others, GSA Today). For placer and alluvial work, the same shapes show old river terraces and buried channels, which is where heavy minerals concentrate. A bare-earth model of a valley floor often shows terrace levels that are invisible from the ground.
Airborne LiDAR survey for mining: platforms and cost drivers
If public data does not cover your ground, or is too coarse, you can commission a survey. The main options are:
| Platform | Typical use | Strength | Limit |
|---|---|---|---|
| Aircraft (fixed wing or helicopter) | Regional to project scale, hundreds of square kilometres | Large area per day, consistent quality | Higher mobilisation cost, fixed point spacing |
| Drone (UAV) lidar | Licence blocks, pits, dumps, small prospects | Dense points at low height, flexible timing, repeat flights | Limited area per flight, battery and permit limits |
| Terrestrial or mobile lidar | Pit faces, underground drives, outcrops | Centimetre detail on vertical faces | Small footprint, needs line of sight |
Four things control the quality and price of a survey: the point density, the vertical accuracy, how much of the area is forested, and the ground control. The USGS 3D Elevation Program defines quality levels that show how these relate. The table below gives the figures as published in the 3DEP specification.
| Quality level | Vertical accuracy (RMSEz) | Pulse density | DEM cell size |
|---|---|---|---|
| QL0 | 5 cm | at least 8 points per m2 | 0.5 m |
| QL1 | 10 cm | at least 8 points per m2 | 0.5 m |
| QL2 | 10 cm | at least 2 points per m2 | 1 m |
| QL3 | 20 cm | at least 0.5 points per m2 | 2 m |
Source: USGS, Topographic Data Quality Levels. RMSEz is the root-mean-square vertical error. USGS also lists lower quality levels, QL4 from imagery and QL5 from radar (IfSAR), with vertical accuracies of 139 cm and 185 cm. The USGS page explains that a higher density without matching accuracy is still classed at the lower level, and that the survey checkpoints needed for QL0 can raise cost substantially.
For most exploration, QL2 is a sound target: about two points per square metre gives a 1 m DEM that shows scarps, shafts and tracks. Pit and tailings monitoring may justify QL1 or denser. For detailed price drivers per hectare, see our guide to lidar data processing cost per hectare. Cost also moves with canopy cover, because more flying and more classification work is needed to reach ground in forest, and with terrain, because steep ground needs lower, slower flight lines.
Check the density before you pay
The calculator below gives a quick estimate of ground-point density from a drone or aircraft flight plan, so you can compare it with the QL2 target before you commission or accept a survey. Real surveys also depend on scan angle, flight height and overlap rules in the contract, so use it for a first check only.
Chart
Minimum pulse density by USGS quality level
Points per square metre, 3DEP Lidar Base Specification
Calculator
What ground-point density will my flight give?
Enter your own sensor and flight numbers.
- Ground points per m2: 85.7
- Ground density as share of the QL2 minimum (2 per m2): 4,285.7%
Example values only, not a benchmark. Density = pulses per second divided by (speed x line spacing), where line spacing = swath x (1 – sidelap). Ground share is your estimate of pulses reaching ground. The QL2 figure of 2 points per square metre is the USGS 3DEP minimum nominal pulse density (USGS, Topographic Data Quality Levels). USGS counts pulses, not only ground points, so comparing ground points with it is a stricter test.
LiDAR vs photogrammetry for terrain mapping
Photogrammetry builds a 3D model from overlapping photographs, usually taken by drone. It is cheaper than lidar and gives colour, which helps with rock and alteration mapping. The two methods answer different questions.
| Question | LiDAR | Photogrammetry (structure from motion) |
|---|---|---|
| Ground under dense vegetation? | Yes, where pulses reach ground | No: it models what the camera sees, which is the canopy |
| Bare rock, pits, stockpiles? | Good | Good, with colour texture |
| Colour and texture | Intensity only, unless a camera is added | Full colour orthophoto |
| Relative cost | Higher equipment cost | Lower equipment cost |
| Best for | Forested ground, structure, vegetated slopes | Open ground, pits, outcrop faces, dump volumes |
A peer-reviewed comparison in dryland ecosystems found that aerial lidar was the best of the methods tested at detecting bare ground, while the drone photogrammetry system failed at sensing bare-earth elevation under dense herbaceous vegetation (PubMed Central, cross-platform point cloud study). That agrees with the physics: a camera sees the top of a plant, a laser can find a gap. On bare, open ground, both methods can produce usable models, so many mine surveyors fly a photogrammetry camera for pits and dumps and keep lidar for vegetated slopes.
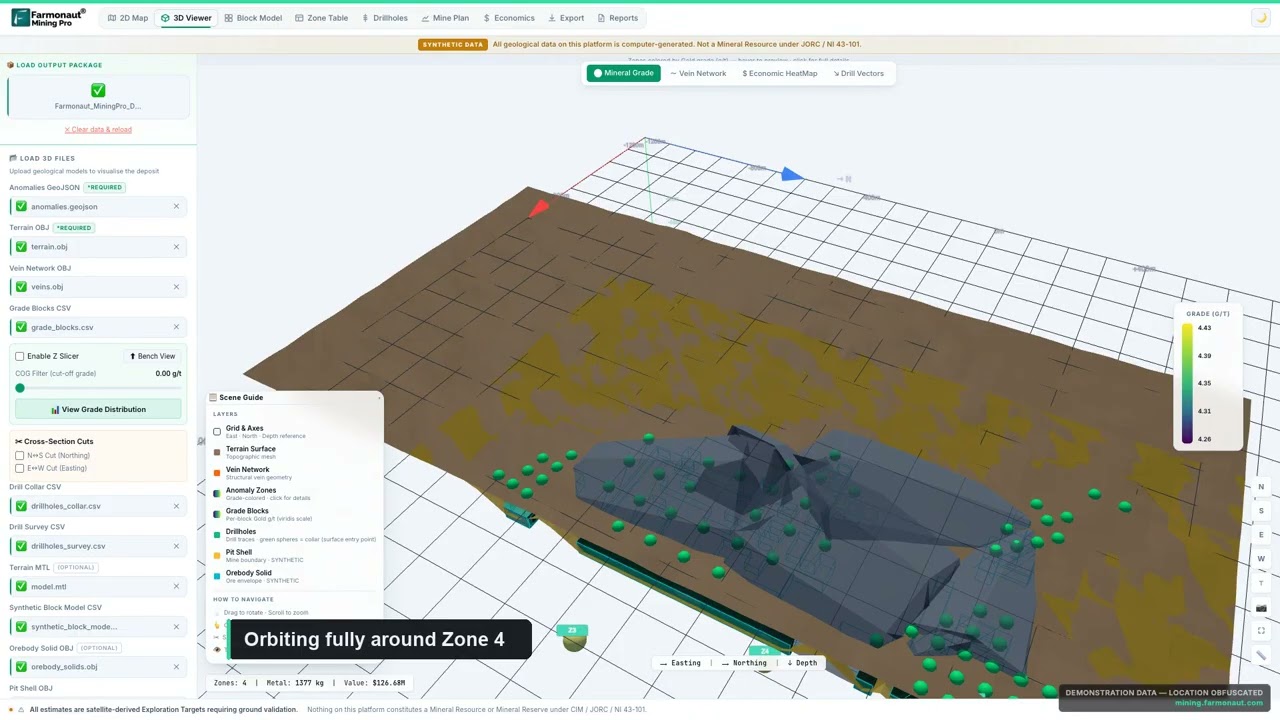
▶ Chapter 6 of the Farmonaut Mining Pro course: terrain, drape and depth in a 3D geological scene. · 16:42
Bare earth DEM: files, formats and visualisation
When you download public data you usually meet three file types.
- LAZ or LAS point clouds. The raw classified points. They are large, but they let you rebuild a DEM with your own settings. The Environment Agency supplies its point clouds as LAZ files, classified into ground, low, medium and high vegetation (Environment Agency).
- GeoTIFF rasters. Ready-made DTM and DSM grids, normally 1 m cells. Open them in QGIS or ArcGIS.
- Cloud-optimised GeoTIFFs (COGs). Wales publishes DTM and DSM as COGs that can be read in QGIS without downloading the whole file (DataMapWales).
The model is not the map. The step that makes faults visible is visualisation: hillshades from several azimuths, slope maps, curvature, and local relief models that subtract a smoothed surface. The Devon survey team found that newly recorded earthworks were much clearer on a single-direction hillshade than on a 16-direction one at one site, and concluded that several visualisations help (Devon Historic Environment Record). Always try more than one.
LiDAR data sources by country
National lidar programmes publish bare-earth models at no charge in several countries. The table lists the main portals, with what each shows on its own page.
| Country | Portal | What you get |
|---|---|---|
| United States | USGS 3D Elevation Program (3DEP) via The National Map | Lidar point clouds and DEMs at several resolutions, available at no charge and with no use restrictions; use LidarExplorer or the National Map download client |
| Worldwide research data | OpenTopography | High-resolution topography from lidar, radar and photogrammetry, with web tools for processing; NSF-funded and community datasets are open to all, while its federated access to 3DEP and NOAA lidar is for academics and subscribers; run by UC San Diego, EarthScope and Arizona State University |
| Canada | NRCan High Resolution DEM (HRDEM) | South of the productive forest line, DTM and DSM from airborne lidar at 1 m or 2 m; north of it, mostly DSM from optical imagery at 2 m; STAC API and download directories |
| Australia | ELVIS (Geoscience Australia) | LiDAR point clouds, DEMs and DSMs; draw an area of interest and download; most data under Creative Commons Attribution |
| England | Environment Agency National LIDAR Programme and the DEFRA survey portal | 1 m elevation data for all of England, in 5 km tiles: DTM, DSM, first-return DSM, intensity and classified point cloud |
| Wales | DataMapWales LiDAR viewer | Historic archive and Welsh Government 2020-2023 tiles; DTM, DSM and hillshade COGs |
| Scotland | Scottish Remote Sensing Portal | Scottish public-sector LiDAR data, downloaded in 10 km tiles and through WMS web services; map browser; Open Government Licence v3 unless stated; built by Scottish Government with JNCC |
Notes on each source
United States. The USGS says 3DEP is the programme to collect lidar for all of the US and its territories, with radar (IfSAR) used in Alaska because of cloud and remoteness (USGS). Most data collected in 2014 and later meet the quality level 2 spacing and accuracy; older data often do not (USGS, About 3DEP products). Check the work-unit metadata for the survey date and quality level of your block.
Canada. HRDEM is delivered by project, and NRCan states that no integration or edge-matching is done between projects, so you can see seams at project borders (Open Government Portal). Heights use the CGVD2013 datum. Some provinces also hold their own lidar, so ask the provincial geoscience office for your claim area.
Australia. ELVIS describes itself as the national platform for finding and downloading elevation data, with a clip-zip-ship tool for the area you select. It provides raster and point-cloud data for GIS rather than ready-made contour maps (Geoscience Australia).
England, Wales and Scotland. The Environment Agency programme split England into 302 survey blocks, flown mostly in winter, from January 2017 to February 2023, which means leaf-off ground in many areas. Repeat surveys have been done for some blocks. Wales has two datasets, a historic archive and a newer 2020-2023 programme. For Scottish data, the portal’s About page says it holds Scottish public-sector LiDAR, which you can download by 10 km tile or reach through WMS web services, and you can browse it on a map. Britain has many old metal-mining districts, such as the Dolgellau gold belt in Wales. The Welsh tile catalogues show which areas are covered.
How to use public lidar on a prospect: seven steps
- Check coverage and date. Open the national viewer for your country, draw your licence boundary, and note the survey year, point density and quality level.
- Download the DTM, and the point cloud if you may need to reprocess. Keep the metadata file with it.
- Load it in QGIS or similar. Set the coordinate system and vertical datum, and check that it lines up with your claim boundary.
- Produce at least four visualisations. Hillshade from two directions, slope, and a local relief model.
- Digitise structures and workings on separate layers. Record how sure you are about each line (certain, probable, possible).
- Overlay other data. Add geology maps, geophysics, geochemistry, satellite alteration maps and tenure boundaries. Look for overlaps.
- Plan a field check. Pick 10 to 20 features, walk them with a GPS, log what you see, and update your interpretation. Share the results with your geologist before drilling anything.
LiDAR and satellite imagery together
Lidar tells you where the ground is steep, broken or offset. Multispectral and radar satellites tell you about surface minerals, vegetation stress and moisture over large areas, and they cover places where lidar does not exist. Used together, a structural layer from lidar and an alteration layer from satellite data can narrow a licence to a few targets before any crew mobilises. Farmonaut does not sell lidar. It provides satellite mineral reports for a licence polygon, covered in our guide to satellite-based mineral detection, and satellites map surface and near-surface signatures that sampling and drilling must confirm.
▶ What a satellite gold map shows and how to read it: iron-oxide, clay and mica, silica and faults. · 4:18
Common mistakes with lidar data
- Mixing up the DSM and the DTM. A surface model of a forest shows trees, not faults.
- Trusting a bare-earth model where ground points are few. Interpolated areas look smooth but contain no measurements.
- Using one hillshade. Features parallel to the light disappear.
- Reading cultural lines as geology. Roads, fences, pipelines, ploughing and old railways all create straight lines.
- Ignoring vertical datum and accuracy. Two surveys on different datums will show false changes when you difference them.
- Skipping the field check. A model is an interpretation until someone has stood on the feature.
Frequently asked questions
What is LiDAR used for in geology?
Geologists use it to map faults and fault scarps, landslides, glacial landforms, rock contacts and old mine workings, mostly from bare-earth elevation models built after vegetation is removed. The Puget Lowland and Carrizo Plain studies cited above are examples.
How accurate is lidar elevation data?
It depends on the quality level. The USGS 3DEP specification sets vertical accuracy at 5 cm for QL0, 10 cm for QL1 and QL2, and 20 cm for QL3, measured as root-mean-square error on open ground. Accuracy is lower under vegetation.
Can lidar see through trees?
Not through solid leaves, but through gaps in the canopy. NOAA’s rule of thumb is that if you can see sky through the trees, lidar can usually measure the ground there. Dense forest gives fewer ground points, and flying in leaf-off conditions helps.
What is a bare earth DEM?
It is a grid of ground heights from which buildings and vegetation have been removed. In lidar work it is made from the points classified as ground. It is often called a digital terrain model.
What is the difference between a DEM, DTM and DSM?
DEM is the general term for an elevation grid. A DTM is the bare-earth version. A DSM includes everything on the surface, such as trees and buildings. Agencies use these names differently, so read the metadata.
How much point density do I need for geological mapping?
About two points per square metre (QL2) is a common baseline for fault, shaft and landslide mapping, and it produces a 1 m DEM. Smaller features, such as narrow trenches or exposed veins, need denser data, typically from a drone.
Is lidar better than photogrammetry for mining?
For ground under vegetation, yes, because photogrammetry models the canopy. On bare pits, dumps and stockpiles, photogrammetry is often as good and cheaper, and it gives colour. Many projects use both.
Where can I download lidar data?
In the US, USGS 3DEP; OpenTopography also hosts research and community lidar datasets. In Canada, NRCan HRDEM. In Australia, ELVIS. In England, the Environment Agency programme through the DEFRA data portal; in Wales, DataMapWales; in Scotland, the Scottish Remote Sensing Portal. The table above gives the links.
Can lidar find gold or other minerals directly?
No. It does not measure rock chemistry. It helps by showing structures, old workings, drainage and cover, which guide where to sample. Geochemistry, geophysics and spectral imagery supply the mineral evidence.
Can I use lidar to find old mines?
Often yes. The Tamar Valley survey found shafts, adits and spoil heaps that earlier methods had not shown in detail, including in wooded ground. Treat every feature as a hazard until it is checked safely on site, and check mining records and ownership before entering land.
How is lidar different from satellite imagery?
Lidar measures height with a laser and is usually flown by aircraft or drone over chosen areas. Satellites record reflected light or radar over very large areas and show surface material and vegetation. They answer different questions and work well together.
This page is for information only. It is not investment or legal advice. Check access rights, permits and safety rules before entering old workings or surveying land, and confirm data licence terms with each publisher.
Farmonaut mining
Screen your licence area from space
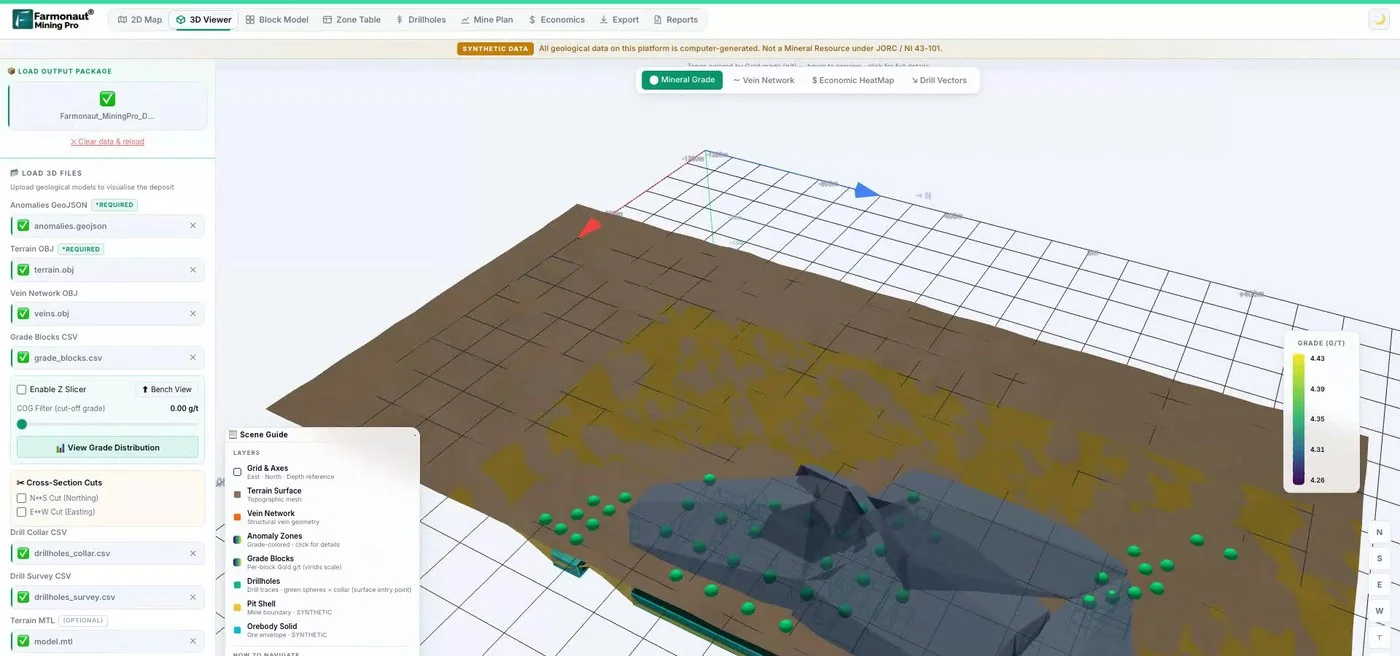
Satellite mineral reports map surface and near-surface signatures on a licence polygon, a useful first layer beside lidar structure.
Mining Pro sample view, synthetic data
Sources
- USGS, What is lidar data and where can I download it: usgs.gov
- USGS, Topographic Data Quality Levels (3DEP): usgs.gov
- USGS, About 3DEP Products and Services: usgs.gov
- USGS, 3D Elevation Program: usgs.gov
- Haugerud and others, High-resolution lidar topography of the Puget Lowland (GSA Today, 2003): pubs.usgs.gov
- Zielke and others, Slip in the 1857 and earlier large earthquakes along the Carrizo Plain (Science, 2010): web.gps.caltech.edu
- Tabor, Booth and Troost, Lidar-revised geologic map of the Poverty Bay quadrangle (USGS SIM 3317): pubs.usgs.gov
- NOAA, Lidar 101: an introduction to lidar technology, data and applications: coast.noaa.gov
- PubMed Central, cross-platform point cloud data fusion in dryland ecosystems: ncbi.nlm.nih.gov
- Devon County Council, Tamar Valley lidar survey: devon.gov.uk
- DOGAMI, Special Paper 42: landslide inventory mapping from lidar: pubs.oregon.gov
- Natural Resources Canada, HRDEM CanElevation Series: open.canada.ca
- Geoscience Australia, ELVIS Elevation Information System: ga.gov.au
- Environment Agency, National LIDAR Programme: data.gov.uk
- Welsh Government, DataMapWales LiDAR viewer: datamap.gov.wales
- Scottish Government, Scottish Remote Sensing Portal: remotesensingdata.gov.scot
- OpenTopography, About: opentopography.org
- DEFRA Data Services Platform, survey portal: environment.data.gov.uk
Discussion
Questions, corrections or field experience? Share them below. First-time comments are reviewed before they appear, and your email is never published.
No comments yet. Be the first to add a question or your experience.

 Riverside Resources Limited
 Congo Mining Solutions
 Mining SARL
 SenGold Invest SAS
 Sania Corporation
 Sean Mining Limited
 NTS Group (Pty) Ltd
 Mine4Africa
 Lithspo Minerals Limited
 Tintina Mining Group
 Dalgety Minerals Pty Ltd
 Faith At Work (Pty) Ltd
 Geotech Mining Solutions plc
 Vulcan International Limited
 Kidepo Associates
 GKY Mining
 Alkimy SARL
 Double A Trading
 GemSprout Metals Limited

 Client · Somalia · Gold
 Client & affiliate partner · Ghana · Gold










