

Molybdenum · Producer guide
China Molybdenum (CMOC): Output vs Three Rivals
CMOC produced 13,906 tonnes of molybdenum in 2025, about 5% of the USGS world estimate of 260,000 tonnes. Mines, rivals such as Freeport-McMoRan, output by country, and a calculator for any mine.
Key takeaways
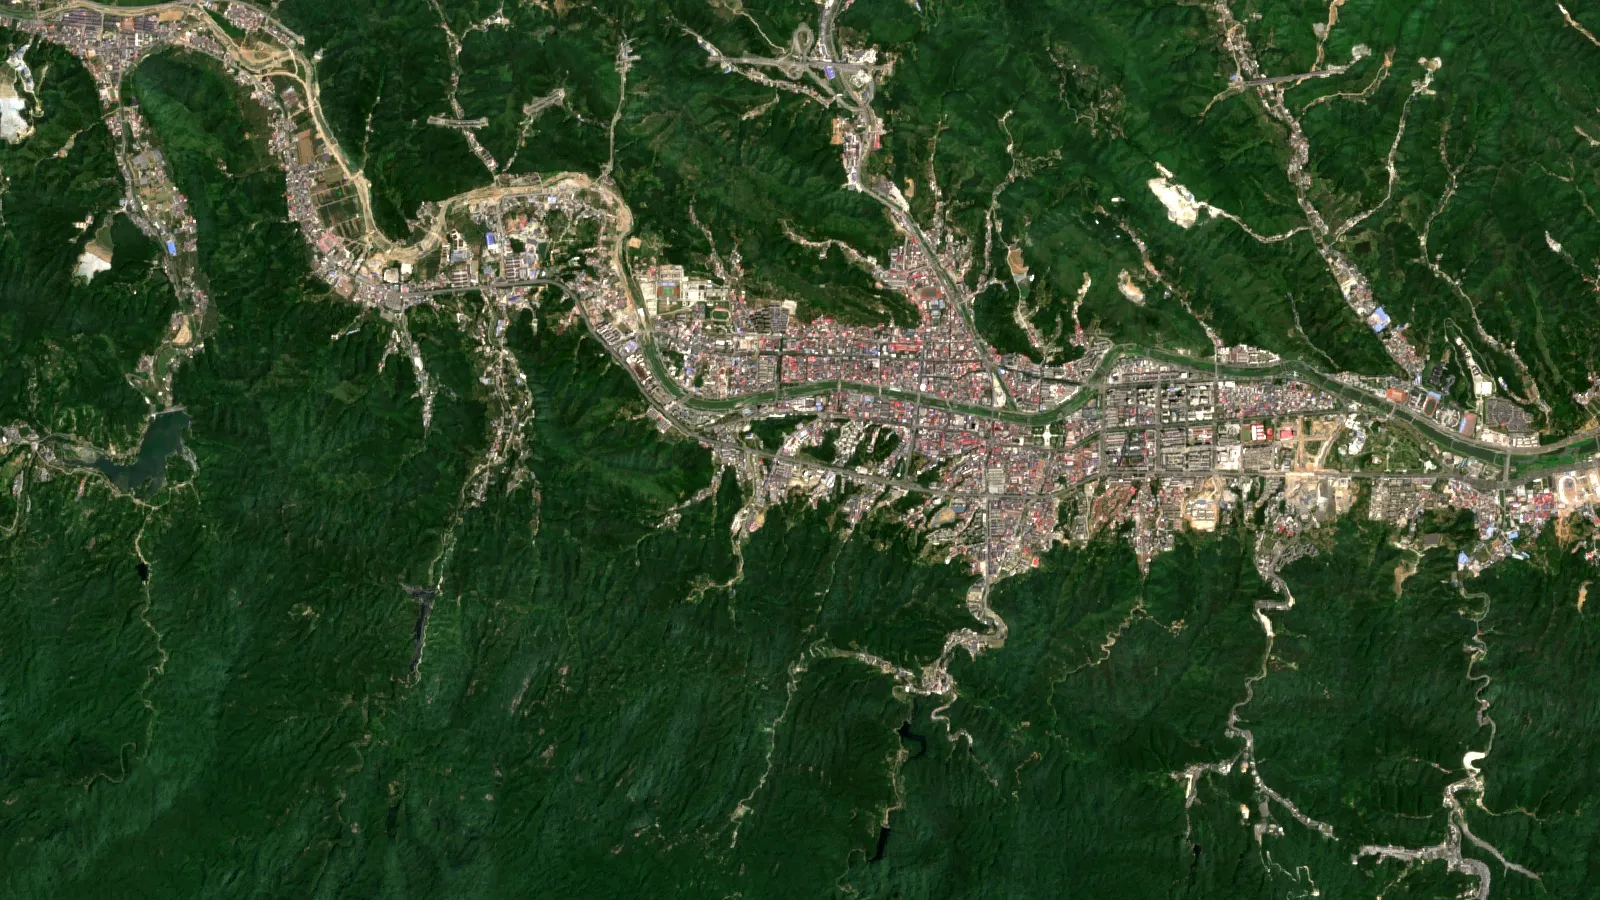
- CMOC (formerly China Molybdenum Co., Ltd.) produced 13,906 tonnes of molybdenum in 2025 from Sandaozhuang and Shangfanggou in Luanchuan, Henan (CMOC, 2026).
- World mine output was an estimated 260,000 tonnes in 2025; China made 97,000 and the five largest producing countries about 90% (USGS, 2026).
- Freeport-McMoRan cites Wood Mackenzie in calling itself the largest producer; its 2025 output was about 92 million pounds, roughly 41.7 kt (10-K, 2026).
- Outside China much molybdenum is a copper by-product; Antofagasta’s output fell 21% in nine months of 2026 on lower grades at Los Pelambres.
- Copper now leads CMOC’s results: US$7.8 billion of US$10.9 billion mining revenue in 2025 (CMOC, 2026).
In this article
- How much molybdenum does China Molybdenum (CMOC) produce?
- CMOC's molybdenum mines: Sandaozhuang and Shangfanggou
- Is CMOC the biggest molybdenum producer? Four miners compared
- Molybdenum production by country
- How molybdenum is mined: porphyry deposits and by-product supply
- Why molybdenum supply is hard to grow
- Estimate the molybdenum output of a mine
- Molybdenum discs and other metal products
- CMOC beyond molybdenum: copper, cobalt and tungsten
- What to check before you rely on a producer's molybdenum figure
- Frequently asked questions
How much molybdenum does China Molybdenum (CMOC) produce?
CMOC produced 13,906 tonnes of molybdenum in 2025 from its two mines in Luanchuan, Henan Province. The US Geological Survey estimates world mine output at 260,000 tonnes of contained molybdenum for 2025, so CMOC supplied about 5% of it (USGS, Mineral Commodity Summaries 2026; our division). That is roughly 14% of the USGS estimate for all of China, which was 97,000 tonnes.
The company is large, but copper now leads its mining results: US$7.8 billion of its US$10.9 billion mining revenue in 2025, from the TFM and KFM mines in the Democratic Republic of Congo. It also mines tungsten, niobium and gold. This page covers its molybdenum side: where the metal comes from, how CMOC compares with other miners, which countries produce the most, and how to estimate the output of any molybdenum or copper-molybdenum mine.
A quick note on the name. The business was known as China Molybdenum Co., Ltd. until it changed its name to CMOC Group Limited in June 2022 (Wikipedia, CMOC Group Limited). It trades in Shanghai (603993) and Hong Kong (3993). Both names refer to the same company, and its Chinese name is Luoyang Molybdenum.
| Item | Figure | Source and date |
|---|---|---|
| CMOC molybdenum output | 13,906 t Mo | CMOC, full year 2025 |
| CMOC tungsten output | 7,114 t W | CMOC, full year 2025 |
| CMOC molybdenum output, first quarter | 3,184 t Mo | CMOC, first quarter 2026 |
| World mine output | 260,000 t Mo (estimate) | USGS, 2025 estimate |
| China mine output | 97,000 t Mo (estimate) | USGS, 2025 estimate |
CMOC’s molybdenum mines: Sandaozhuang and Shangfanggou
CMOC’s molybdenum comes from two neighbouring mines in Luanchuan, Luoyang, Henan. The company’s China operations page lists them as follows.
- Sandaozhuang is a molybdenum-tungsten mine, wholly owned by CMOC. The company lists a resource of 234 thousand tonnes of molybdenum at a grade of 0.088% and 103 thousand tonnes of tungsten at 0.172%.
- Shangfanggou is a molybdenum-iron mine run as a joint venture. The listed resource is 598 thousand tonnes of molybdenum at 0.139%, plus iron ore at about 20% iron.
Grade is the share of metal in the rock. A grade of 0.088% means that one tonne of ore holds under one kilogram of molybdenum, which is typical for large porphyry deposits (bulk deposits where metal is spread through a big body of altered rock). Such mines rely on size and low unit cost, not on rich ore.
CMOC says it makes ferromolybdenum, ammonium paratungstate and tungsten concentrates on site, and recovers by-products such as iron, copper, fluorite and rhenium. In 2025 the company reported higher recovery rates at both operations: up 3.24 percentage points at Shangfanggou molybdenum, 2.65 points at Sandaozhuang molybdenum and 3.17 points at Sandaozhuang tungsten (CMOC, 2025 results release). Recovery is the share of the metal in the ore that ends up in the concentrate, so small gains matter at this scale.
The first quarter of 2026 brought 3,184 tonnes of molybdenum. In the first half of 2026 molybdenum revenue rose 33.11% year on year to RMB 3.93 billion, with the release crediting higher market prices for the growth in its metals (CMOC, first-half 2026 results release). For the price side, see our guide to the molybdenum price, benchmarks and drivers.
Is CMOC the biggest molybdenum producer? Four miners compared
No. In its 2025 annual report, Freeport-McMoRan states that, according to Wood Mackenzie, it is the world’s largest producer of molybdenum and molybdenum-based chemicals (Freeport-McMoRan, Form 10-K for 2025). Most of the metal at Freeport and at the other western producers is a by-product of copper mining, so molybdenum output follows copper ore grades and mine plans.
Chart
Molybdenum output of four producers in 2025
Thousand tonnes of molybdenum, four selected producers; bases differ (see table)
The table gives the 2025 molybdenum output that each company reported. Units and definitions differ, so the right-hand column says what each number counts.
| Producer | 2025 output | What the figure counts |
|---|---|---|
| Freeport-McMoRan (US, Peru) | 92 million lb (about 41.7 kt) | Recoverable molybdenum from Climax (24), Henderson (13), US copper mines (34) and Cerro Verde (21), in million lb |
| Southern Copper (Peru, Mexico) | 68.7 million lb (about 31.2 kt) | Mined molybdenum at Toquepala, Cuajone, Buenavista and La Caridad |
| Antofagasta (Chile) | 15.8 kt | Molybdenum from Los Pelambres and Centinela copper mines, up from 10.7 kt in 2024 |
| CMOC (China) | 13.9 kt | Molybdenum from Sandaozhuang and Shangfanggou |
Sources: Freeport-McMoRan 10-K, Southern Copper 10-K, Antofagasta annual report and CMOC. One pound is 0.4536 kilograms. Freeport’s consolidated figures include Cerro Verde in full although it owns 55.08%. Other producers are not shown, so this is not a full league table.
Three points stand out. First, CMOC’s output comes from two molybdenum-led mines, while Southern Copper and Antofagasta report molybdenum from copper mines, and Freeport combines two primary Colorado mines with copper-mine by-product. Second, the western producers can swing output when copper grades change: Antofagasta’s molybdenum fell 21% in the first nine months of 2026 to 9,000 tonnes because of lower grades at Los Pelambres (Antofagasta, Q3 2026 production report). Third, Freeport guides to sales of 93 million pounds of molybdenum for 2026 and reported an average realised price of $28.75 per pound for the second quarter of 2026 (Freeport-McMoRan, second-quarter 2026 release).
Molybdenum production by country
China is the largest producer, with an estimated 97,000 tonnes of molybdenum in 2025, or about 37% of world mine output. Chile (42,000 t), the United States (40,000 t) and Peru (39,000 t) follow, and Mexico adds 17,000 t. Together these five countries make about 90% of the world total (USGS, 2025 estimates, our sums).
Chart
Who gained and who lost between 2024 and 2025
Thousand tonnes of contained molybdenum
Chart
Mine production of molybdenum, eight largest countries
Thousand tonnes of contained molybdenum, 2025 estimate
China also holds the most reserves: 7.8 million of the 17 million tonnes the USGS counts worldwide, followed by the United States (3.5 million), Chile (2.6 million), Russia (1.1 million) and Peru (1.0 million). Reserves are the part of the resource that can be mined profitably at current prices, so they change with price and with new drilling. Geoscience Australia’s 2020 assessment gives a similar picture for economic resources: China holds 46%, Peru 16%, the United States 15% and Chile 8%, and Australia about 1% (Geoscience Australia, Australia’s Identified Mineral Resources 2020).
Between 2024 and 2025 the order changed below China. US mine output rose 18% to 40,000 tonnes and Chile rose to 42,000 tonnes, which put both ahead of Peru, where output fell from 41,900 to 39,000 tonnes. Armenia dropped from 8,200 to 5,300 tonnes. USGS marks the 2024 China figure as an estimate and revised its Australia and Canada numbers using company and government reports.
| Country | 2024 (t Mo) | 2025 estimate (t Mo) | Reserves (thousand t) |
|---|---|---|---|
| China | 100,000 | 97,000 | 7,800 |
| Chile | 38,500 | 42,000 | 2,600 |
| United States | 34,000 | 40,000 | 3,500 |
| Peru | 41,900 | 39,000 | 1,000 |
| Mexico | 16,200 | 17,000 | 130 |
| Armenia | 8,200 | 5,300 | 150 |
| Kazakhstan | 4,080 | 4,300 | 7 |
| Mongolia | 3,110 | 4,200 | 10 |
Source: USGS, Mineral Commodity Summaries 2026, molybdenum (February 2026). The US estimate comes from two primary molybdenum mines in Colorado and seven copper mines where molybdenum is a by-product, four of them in Arizona. The USGS average price estimate for 2025 was $51 per kilogram.
How molybdenum is mined: porphyry deposits and by-product supply
Molybdenum occurs as the sulfide mineral molybdenite. According to the USGS, it is the principal metal in large, low-grade porphyry molybdenum deposits and an associated metal in low-grade porphyry copper deposits. That is why so many copper miners also sell it. Only molybdenite is used to make marketable products, according to the International Molybdenum Association (IMOA).
Infographic
From ore to ferromolybdenum in four steps
- 1Crush and grindMined ore is crushed and ground to fine particles.
- 2Float the concentrateFlotation gives a concentrate with 85% to 92% molybdenum disulfide.
- 3Roast to oxideRoasting at 500 to 650 degrees C makes technical molybdenum oxide.
- 4Make products30% to 40% of the oxide becomes ferromolybdenum; about 20% goes to chemicals.
The IMOA describes the route from rock to product like this. Ore is crushed, ground and floated to give a concentrate of 85% to 92% molybdenum disulfide. Roasting the concentrate in air at 500 to 650 degrees C gives technical molybdenum oxide. Between 30% and 40% of that oxide is turned into ferromolybdenum for steelmakers, and about 20% goes into chemicals such as molybdates.
For a mine, three numbers decide the result: tonnes of ore milled, the molybdenum grade and the recovery. At Los Pelambres in Chile the molybdenum head grade averaged 0.019% and recovery 79.9% in the first nine months of 2026, against 0.023% and 80.9% a year earlier (Antofagasta). Freeport’s Climax and Henderson mines in Colorado are primary molybdenum operations, and the company’s 10-K reports 24 million pounds from Climax and 13 million from Henderson in 2025. For more on the host rock, see our guides to porphyry copper deposits and copper deposits and where to explore.
▶ Explains remote sensing for mining in plain words and the six instrument families. · 2:01
Why molybdenum supply is hard to grow
Outside China, much of the molybdenum rides along with copper, so a miner cannot simply raise output when demand rises. The IMOA reported world production of 168.4 million pounds in the first quarter of 2026, flat on the previous quarter, against usage of 180.7 million pounds. China produced 78.5 million pounds in that quarter and used 91.1 million (Mining and Metal News, reporting IMOA data, 7 July 2026).
Chart
United States molybdenum mine production
Thousand tonnes of contained molybdenum
The IMOA also says that stainless steel takes about 20% of new molybdenum, and engineering steels, tool and high-speed steels, cast iron and superalloys take about another 60% (IMOA, facts and figures). So demand tracks steel, energy, chemical and aerospace output more than any single product.
Estimate the molybdenum output of a mine
Use the calculator below to turn ore tonnes, grade and recovery into tonnes of molybdenum and gross value. It also shows the result as a share of the USGS estimate of world output. Enter your own numbers; the defaults are round examples.
Calculator
How much molybdenum would a mine produce, and what is it worth?
Enter your own ore tonnes, head grade, recovery and price.
- Million pounds recovered: 17.6
- Gross value at your price (US$): $529,108,800
- Share of USGS world output (260,000 t): 3.1%
Example values only, not a benchmark or a forecast. The 0.02% grade and 80% recovery are round figures near the 0.019% grade and 79.9% recovery that Antofagasta reported for Los Pelambres in the first nine months of 2026; the 50 million tonnes of ore is an assumed example. Price is an input: example, use today’s price. Result is gross metal value before treatment charges, freight, costs, royalties and tax. 1 tonne = 2,204.62 lb. World output of 260,000 tonnes is the USGS 2025 estimate.
Molybdenum discs and other metal products
Most molybdenum goes into steel, but a small share is made into metal: powder, rod, sheet and discs. Discs are one such product, used where heat, stiffness and low thermal expansion matter. The IMOA lists rotating X-ray anodes used in clinical diagnostics, heat sinks whose thermal expansion matches silicon for chip mounts, glass-melting furnace electrodes, and sputtered layers only angstroms thick for the gates and interconnects of integrated circuits (IMOA, About Molybdenum).
Two physical limits decide where discs can be used. The metal melts at about 2,610 degrees C, one of the highest of any element. But it forms a volatile oxide when heated in air above about 600 degrees C, so high-temperature use is limited to vacuum or non-oxidising atmospheres (IMOA, same brochure). Metal products are a small part of the market compared with steel alloying, so a mine’s output is mainly decided by the steel and chemical trade, not by disc demand.
CMOC beyond molybdenum: copper, cobalt and tungsten
Copper now leads CMOC’s results. For 2025 the company reported revenue of US$29.1 billion and net profit attributable to shareholders of US$2.9 billion, up 50.3%. It produced a record 741,100 tonnes of copper and 117,500 tonnes of cobalt, with tungsten at 7,114 tonnes and niobium at 10,348 tonnes (CMOC, 2025 results release).
The copper and cobalt come from the Tenke Fungurume (TFM) and Kisanfu (KFM) mines in Lualaba Province, DRC. CMOC holds 80% of TFM and 71.25% of KFM (CMOC, DRC operations). For the latest on that expansion, see our article on the Tenke Fungurume expansion. CMOC has also added gold, with four operating mines in Brazil and a project in Ecuador. If you follow tungsten too, our page on tungsten in Canada covers another producer region.
What to check before you rely on a producer’s molybdenum figure
- The unit. Companies report tonnes or pounds, and “molybdenum” can mean contained metal, concentrate or oxide. A concentrate figure is much bigger than a contained-metal figure.
- The ownership basis. Freeport consolidates Cerro Verde although it owns 55.08%. Check whether a figure is gross or attributable.
- The year and the estimate flag. USGS 2025 numbers are estimates, and its 2024 China figure is also marked as an estimate.
- Grade and recovery. Falling grades cut output without any change in tonnes milled, as at Los Pelambres.
- The by-product link. A copper mine’s molybdenum follows its copper plan.
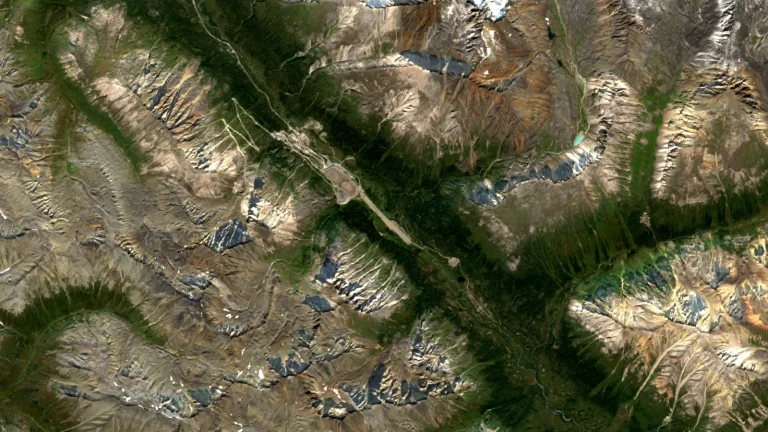
For explorers, a porphyry system leaves clues at the surface, such as altered and iron-stained rock, that satellites can map before drilling. Satellite results are exploration targets and sit ahead of any resource estimate; they do not replace drilling or a standards-based report. If you hold a licence and want a first screen, you can send a boundary through the mining query form, read about satellite-based mineral detection, or contact the team.
▶ The limits of satellite mineral exploration that matter in mining due diligence. · 2:08
Frequently asked questions
What does China Molybdenum Co., Ltd. do?
It is a mining company, now called CMOC Group Limited, that mines molybdenum and tungsten in Henan, copper and cobalt in the DRC, niobium and phosphate in Brazil, and gold in Brazil and Ecuador. It also owns the metals trader IXM, according to its own website.
How much molybdenum did CMOC produce?
CMOC reported 13,906 tonnes of molybdenum for 2025 and 3,184 tonnes for the first quarter of 2026.
Where are CMOC’s molybdenum mines?
Both are in Luanchuan, Luoyang, Henan Province, China: Sandaozhuang (molybdenum-tungsten) and Shangfanggou (molybdenum-iron).
Which country produces the most molybdenum?
China, with an estimated 97,000 tonnes of mine output in 2025, ahead of Chile (42,000), the United States (40,000) and Peru (39,000), according to the USGS.
Is CMOC the largest molybdenum producer in the world?
Not on the figures above. Freeport-McMoRan cites Wood Mackenzie in calling itself the world’s largest producer, and its 2025 output was about three times CMOC’s.
Is molybdenum mostly a by-product?
In the Americas, largely yes: it comes with copper in porphyry deposits. In China, CMOC’s two mines are primary molybdenum operations. The USGS lists two primary molybdenum mines in Colorado and seven by-product operations in the United States.
What is molybdenum used for?
Mostly to strengthen steel and improve corrosion resistance. The IMOA puts stainless steel at about 20% of use and engineering steels, tool steels, cast iron and superalloys at about 60%.
What is a molybdenum disc made from?
It is a flat round blank of molybdenum metal. The IMOA says the metal is produced by hydrogen reduction to a pure powder, which fabricators then form into products.
How much molybdenum is in the ground?
The USGS puts world reserves at 17 million tonnes and identified resources at about 25 million tonnes (5.4 million in the United States and about 20 million elsewhere).
Where can I check the molybdenum price?
Our page on the price of molybdenum lists dated benchmarks and the drivers behind them.
This page is for information only. It is not investment advice. Company figures are as reported by each company and may be restated.
Farmonaut mining
Map your mining site from space
Send a licence boundary as KML, KMZ or a polygon and receive satellite-derived exploration targets, ahead of any resource estimate.

Mining Pro sample view, synthetic data
Keep reading
Sources
- CMOC, China – molybdenum and tungsten operations: en.cmoc.com
- CMOC, 2025 annual results news release (April 2026): en.cmoc.com
- CMOC, first-quarter 2026 results news release (May 2026): en.cmoc.com
- CMOC, first-half 2026 results news release (August 2026): en.cmoc.com
- CMOC, the DRC – copper and cobalt: en.cmoc.com
- Wikipedia, CMOC Group Limited (name history and listings): en.wikipedia.org
- USGS, Mineral Commodity Summaries 2026: Molybdenum (February 2026): pubs.usgs.gov
- Freeport-McMoRan, Form 10-K for 2025: s22.q4cdn.com
- Freeport-McMoRan, second-quarter 2026 earnings release (23 July 2026): s22.q4cdn.com
- Southern Copper, Form 10-K for 2025: southerncoppercorp.com
- Antofagasta plc, Annual Report 2025: antofagasta.co.uk
- Antofagasta plc, Q3 2026 production report (15 October 2026): antofagasta.co.uk
- IMOA, Molybdenum facts and figures: imoa.info
- IMOA, About Molybdenum brochure: imoa.info
- Mining and Metal News, Global usage of molybdenum rises while production remains static (7 July 2026): miningmetalnews.com
- Geoscience Australia, Australia’s Identified Mineral Resources 2020: commodity summaries: ga.gov.au
Discussion
Questions, corrections or field experience? Share them below. First-time comments are reviewed before they appear, and your email is never published.
No comments yet. Be the first to add a question or your experience.

 Geotech Mining Solutions plc
 Vulcan International Limited
 Kidepo Associates
 GKY Mining
 Alkimy SARL
 Double A Trading
 GemSprout Metals Limited
 Qader Group
 Ileys General Trading
 SG Gold Mining LLC
 VRV Global Pte Ltd
 Omsri International FZE
 G.I.T.T.
 Jaunita Erss Ltd
 Almosi SARL
 SRK Consulting
 Berks Gold Limited
 Mwerezi Minerals Company Limited
 Mining SARL
 SenGold Invest SAS

 Exploration consultancy · South Africa · Gold










