

Satellite Gold Exploration Ghana: Rapid 422-ha Scan
A licence holder in Ghana handed us a polygon and a question: is there anything here worth drilling? Multi-sensor satellite analysis returned nine discrete anomaly zones, an exploration target of roughly 1,170–2,690 troy ounces of in-situ gold, a ranked drill order — and one honest negative result that mattered as much as the positives.
Region Ghana
Licence area 422 ha
Method Multi-sensor remote sensing
Zones detected 9
Ground disturbance None
This case study is published with the client’s identity, the concession name and every coordinate removed. The satellite figures below have been deliberately processed: basemaps are slated out, interiors blurred, and coordinate axes cropped away, so the imagery communicates method and pattern without geolocating a private licence. Farmonaut client deliverables are the opposite — full-resolution, fully georeferenced, GIS-ready. Every grade, tonnage, depth and economic figure quoted here is the real, unaltered output of the analysis.
Every exploration programme begins with the same expensive problem: the ground is enormous and the budget is not. A 422-hectare licence in Ghana is a rectangle you can walk across in an afternoon and still learn almost nothing about, because gold does not announce itself at the surface in any way a field geologist can see from a track. Traditionally you resolve that by spending — grid soil sampling, trenching, a reconnaissance drill programme priced per metre — and by spending time, usually a season or more, before you know whether the licence deserves a second season at all.
Satellite gold exploration Ghana projects invert that sequence. Instead of sampling the ground to decide where to look, we analyse the ground’s reflected and emitted energy from orbit to decide where sampling is worth paying for. This satellite gold exploration Ghana case study walks through exactly that on a real licence: what went in, what came out, which numbers we trust, which we flag, and the one result that told the client to slow down rather than speed up.
“Nine anomaly zones over 68.6 hectares — 16.2% of the licence area carried a detectable gold signature.”

If you hold a licence and want this run on your own polygon, the fastest route is the Farmonaut mining query form — or draw your area directly on the map at mining.farmonaut.com, which is the quickest way to get a defensible boundary into the system.
Background: a licence, a boundary file, and no subsurface data
The starting position was ordinary and, for early-stage African gold ground, typical. The client held a contiguous licence of 422.27 hectares (1,043.5 acres) in Ghana. There was no historical drilling on the block, no assay database, no geophysical survey flown over it, and no resource statement of any kind. What existed was a boundary polygon and a commodity target: gold.
That is a genuinely hard place to make a capital decision from, and it is the exact situation satellite gold exploration is built for. A reconnaissance drill programme across a block that size, sited on intuition, can easily consume a six-figure budget and return nothing but the knowledge that you drilled the wrong 400 metres. The question the client actually needed answered first was narrower and cheaper: which parts of this 422 hectares, if any, carry a mineralisation signature strong enough to justify a rig?
Three characteristics of the block made it a good candidate for satellite gold exploration:
- ✔ Benign terrain. Mean slope across the licence is 9.24°, comfortably under the ~25° threshold where open-pit geotechnics start to complicate everything. Mean elevation is about 166 m above sea level.
- 📊 Structural fabric visible from orbit. Radar lineament density averaged 395 lineaments per zone — a dense fracture network, which is what you want when the deposit model is structurally controlled vein mineralisation.
- ⚠ Heavy vegetation and settlement. Surface context across most of the block classified as dense vegetation, and parts of it are built-up. This is a real constraint, not a footnote — it drove both the detection confidence and, as we’ll see, the single largest finding in the whole study.
A satellite scan is not a substitute for drilling. It is a substitute for guessing where to drill. The output of this study is not a resource — it is a ranked, costed, defensible drill order that replaces intuition with 21+ layers of independent evidence.
The satellite gold exploration approach we applied
Satellite gold exploration begins from an awkward fact: gold itself is not spectrally visible from orbit at economic grades. What is visible is the geological company gold keeps: iron-oxide caps left behind where sulphides have weathered, clay and sericite halos produced by hydrothermal alteration, silicified corridors that hold heat differently through the day-night cycle, and the fracture architecture that channelled the mineralising fluids in the first place. Detect enough of those simultaneously in the same place, and you have a target.
Our satellite gold exploration engine fuses 21+ orbital and geophysical data layers into a single composite prospectivity surface at 10 m ground sample distance, then extracts discrete anomaly polygons from it. The sensor stack for this Ghana run was:
| Data layer | Ground sample size | Geological role in a gold scan |
|---|---|---|
| Sentinel-2 multispectral | 10 m | Visible/near-infrared reflectance — vegetation indices, hydrothermal alteration composites, iron-oxide ratios. |
| ASTER shortwave infrared | 30 m | AlOH–sericite, argillic and carbonate–chlorite ratios that map proximal alteration mineralogy. |
| Sentinel-1 radar (C-band) | — | Dual-orbit lineament density, surface roughness, structural fabric and fault networks. |
| PALSAR-2 radar (L-band) | — | HH/HV backscatter and temporal stability — vein-controlled relief and bedrock exposure. |
| MODIS / ASTER thermal | — | Diurnal land-surface temperature anomalies flagging silicification and sulphide oxidation. |
| EMAG-2 magnetics | — | World digital magnetic anomaly grid — basement structure and intrusive footprints. |
| Copernicus DEM | 30 m | Slope, aspect, hillshade, flow accumulation, knickpoint and meander proxies. |
| Sentinel-2 time series | 10 m | Bare-ground persistence, geobotanical stress, laterite-cover penalty. |
Those layers are normalised into sub-scores spanning alteration mineralogy, structural density, surface evidence, thermal signature and geomorphological host criteria, then combined into a weighted composite. Discrete anomaly polygons are cut from the composite surface by thresholded connected-component analysis, and each polygon is scored for coherence — combining how elongate it is with how smooth its boundary is, because real vein-controlled targets are elongate and coherent while noise is neither.
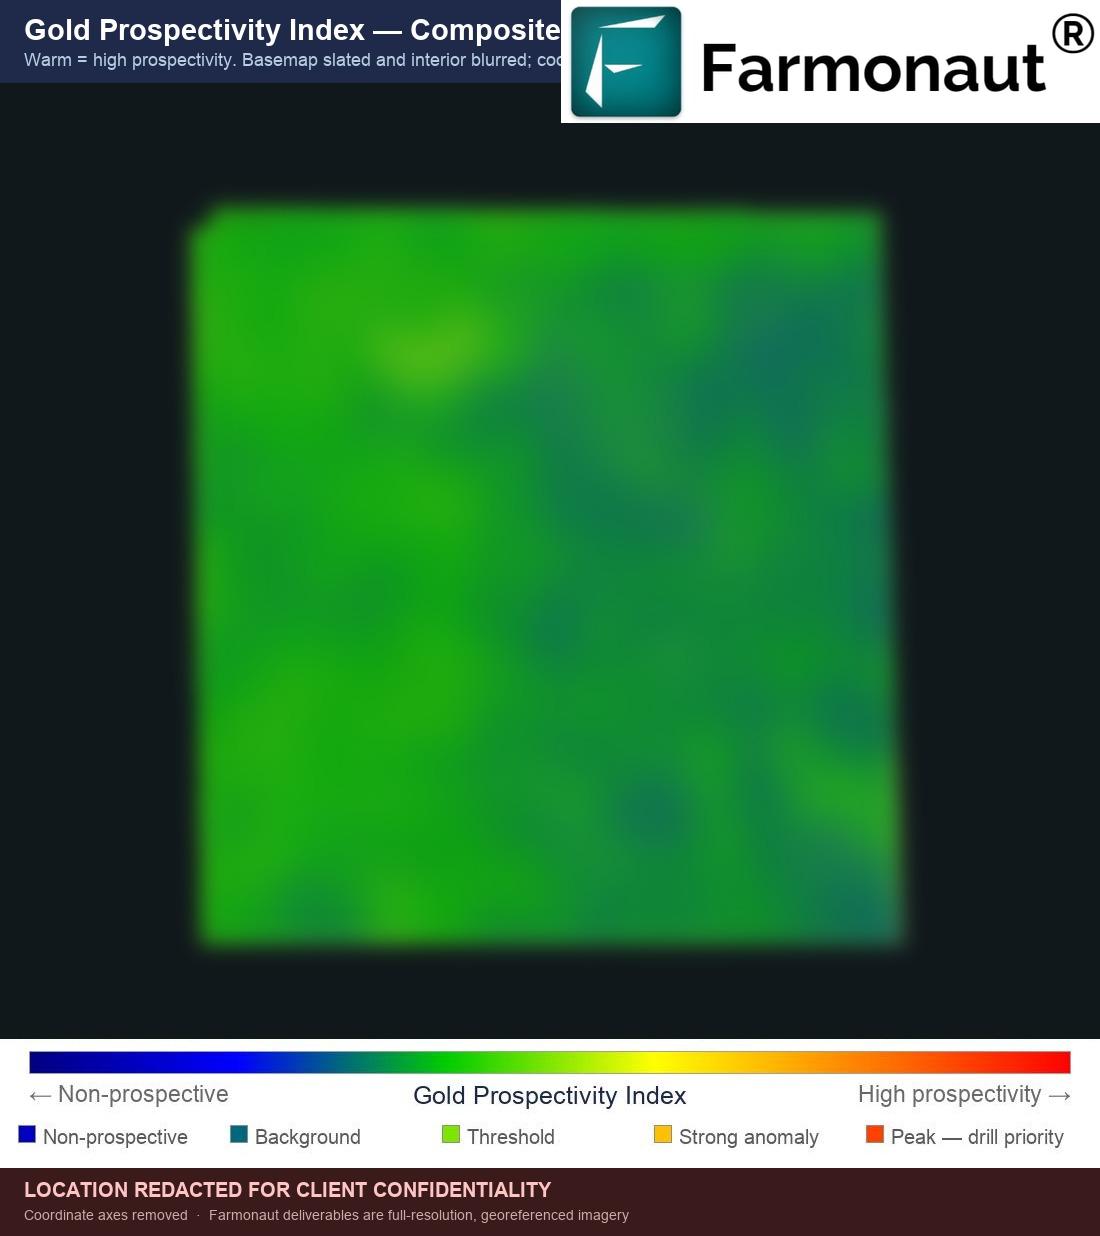
The interpretation of that surface for this block was that prospectivity is dominated by green-to-yellow values in the 0.40–0.65 band, with localised warm hotspots over the highest-priority zones. Low-score blue regions correspond to thicker overburden and laterite cover — ground where the signal is genuinely suppressed rather than genuinely absent, which is an important distinction when you decide what to do next.
Volumetrics: how a pixel pattern becomes a tonnage
Turning an anomaly polygon into an exploration-target tonnage requires geometry and a density, and it requires being explicit about both. The chain we used is deliberately conservative:
Contained Au (kg) = tonnage × grade (g/t) ÷ 1,000
Reference rock density = 2.4 t/m³ · Cut-off grade = 0.25 g/t Au
Blended recovery = 81% (90% mining × 90% metallurgical)
Tonnages carry a mining-dilution allowance for waste-rock contamination.
Polygon geometry comes from an oriented minimum-area bounding box around each anomaly; ore thickness is derived from the digital elevation model; and a geometry factor below 1.0 discounts the fact that a mineralised body never fills its own bounding prism. The result is presented as both undiluted in-situ rock and diluted, mining-realistic tonnage.
A single grade number for a satellite anomaly is close to meaningless on its own. Every zone in this study carries a full distribution — a 10th percentile, a median and a 90th percentile grade derived from the per-pixel grade model inside the polygon. Zone 6 illustrates why: its central grade of 0.991 g/t sits inside a P10–P90 band of 0.42–1.73 g/t. That spread is the finding. A narrow band means the anomaly is internally consistent; a wide one means a rich core surrounded by weaker margins, and it changes how you site the hole.

Two Farmonaut product pages explain the deliverable set behind this workflow: satellite-based mineral detection covers the core prospectivity report, prospectivity heatmaps and georeferenced GIS files, while our satellite-driven 3D mineral prospectivity mapping overview covers the TargetMax™ drilling-intelligence layer — drilling-angle recommendations and interactive 3D subsurface models of the inferred vein structures.
What the scan found: nine zones, and a conservative funnel
Across the 422-hectare licence, the satellite gold exploration analysis extracted nine discrete economic anomaly zones covering an aggregate footprint of 68.59 hectares (169.5 acres) — 16.2% of the surveyed area. All nine classify as gossan-zone mineralisation: iron-oxide caps over oxidised sulphide, which is exactly the surface expression a shallow gold system should leave behind.
What matters more than the count is how aggressively satellite gold exploration cut the candidate set down along the way. The target-selection cascade runs four sequential filters — priority anomalies, an artisanal/placer discriminator, a cover-and-vegetation penalty, and a final geological × economic filter. Fewer than 30% of the original priority footprint survives all four stages. That is a deliberate trade: we accept losing some real targets in order to hand the client far fewer false ones.
The finding that mattered most: 78% of the anomalous ground is not developable
This is the satellite gold exploration finding the client did not expect, and the one with the largest commercial consequence. Three of the nine detected anomalies sit on built-up, urban land — with the nearest mapped building at 0 m, 3 m and 7 m respectively from the anomaly footprint. Their combined footprint is 53.3 hectares, or 78% of all anomalous ground detected on the licence.
Those three zones are reported with zero contained gold, zero tonnage and zero value, and they are excluded from every total in the study. Critically, their grades were retained for geological completeness — and they range 0.59–0.77 g/t Au, squarely in line with the zones we did count. In other words the exclusion is a land-access constraint, not a geological one. The gold signature is real; the ground simply cannot be developed.
It would be trivially easy to headline this licence with the number it would carry if the built-up ground were developable — roughly 10.6× the contained gold we actually report. We don’t, and no honest report should. That figure is a land-access scenario, not a resource: it describes a legal and social reality that does not exist. Every figure in this case study is on the excluded-ground-stays-excluded basis. If you are reading a competitor’s satellite report, check which basis their headline uses.
The 50-metre building-proximity screen that excluded those three zones ran before a single field team mobilised, using mapped building footprints. That is the quiet ESG advantage of orbital screening: a project’s most serious social conflict — mineralisation sitting underneath where people live — was identified at the desktop stage, at zero cost and with zero ground disturbance, rather than after a drill pad had been cleared and expectations set in a community.
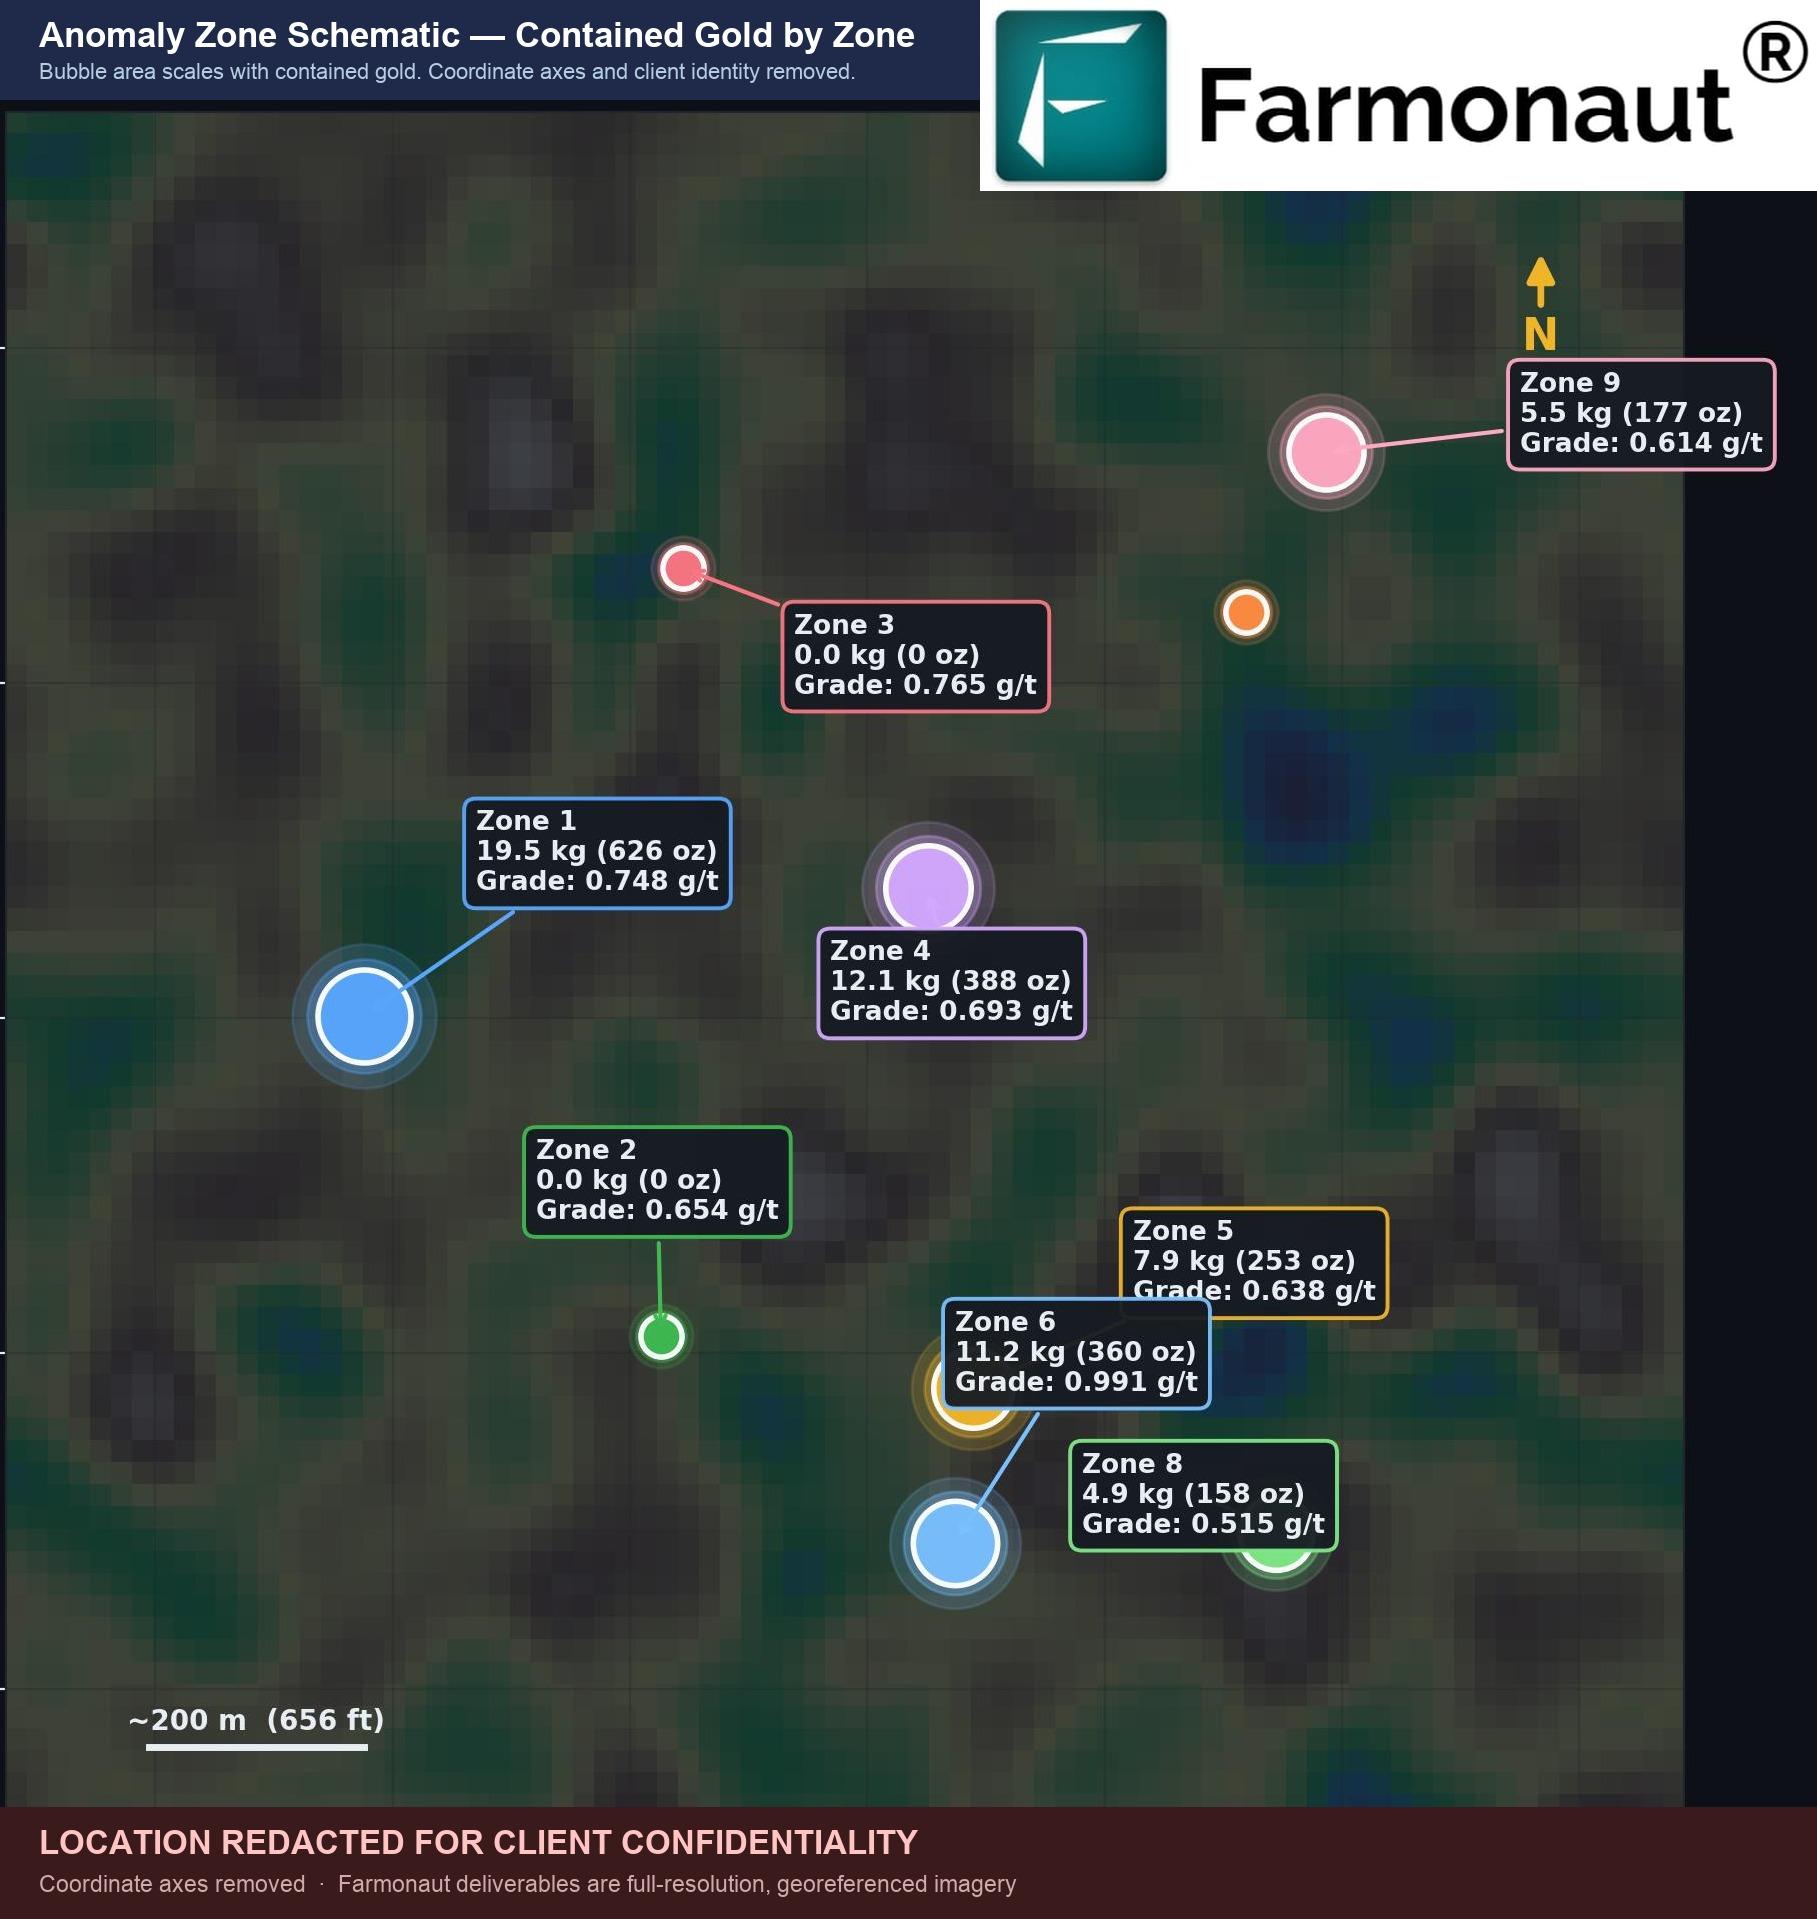

The six developable zones, side by side
Here is the full satellite gold exploration portfolio on the reported basis, ordered by contained gold. Grades are shown as median with the P10–P90 band in brackets, and contained metal as a range derived from that band — because a satellite-derived estimate that quotes a single ounce figure is claiming a precision it does not have.
| Zone | Ore tonnage | Grade g/t Au median [P10–P90] |
Contained gold P10–P90 (central) |
Signal | Confidence | Strip ratio | Depth to ore |
|---|---|---|---|---|---|---|---|
| Zone 1 | 26,000 t | 0.60 [0.43–1.03] | 360–864 oz (626) | Moderate | Medium | 1.20 | 42–77 m |
| Zone 4 | 17,400 t | 0.48 [0.41–0.80] | 227–449 oz (388) | Moderate | Medium | 3.90 | 39–49 m |
| Zone 6 | 11,300 t | 0.80 [0.42–1.73] | 152–628 oz (360) | Strong | High | 4.50 | 45–55 m |
| Zone 5 | 12,300 t | 0.55 [0.44–0.72] | 176–287 oz (253) | Strong | Medium | 1.26 | 44–79 m |
| Zone 9 | 9,000 t | 0.58 [0.42–0.78] | 122–226 oz (177) | Moderate | Medium | 4.00 | 40–50 m |
| Zone 8 | 9,600 t | 0.51 [0.45–0.78] | 137–240 oz (158) | Moderate | Medium | 1.11 | 39–74 m |
| Zones 2, 3, 7 | excluded | 0.53–1.11 [retained] | 0 oz — built-up land | Strong / Mod. | Excluded | 1.03–1.20 | 36–77 m |
| PORTFOLIO TOTAL | ~85,600 t | 0.43–0.98 (central 0.71) | 1,170–2,690 oz (1,962) | 3 Strong / 6 Mod. | 1 High / 5 Medium | 2.48 wtd. | 36–79 m |
Two zones carry half the metal
The satellite gold exploration portfolio is top-heavy in a way that is good news for capital efficiency. Zone 1 alone hosts 31.9% of total contained gold, and the top two zones together account for 51.7%. That concentration means a first drill programme does not need to be spread thinly across nine targets to test the bulk of the thesis — two well-sited zones do most of the work.
Zone 1 — the anchor target
Zone 6 — the quality target
Zone 6 is the most instructive zone in the study. It carries the highest diluted grade (0.991 g/t), the strongest pixel-level signal — nearly 70% of its pixels individually class as Strong — and it is the only zone that earns a High confidence label. It also has the worst strip ratio on the block at 4.50, and the widest grade uncertainty band. A geologist reading only the headline grade would rank it first; a geologist reading the whole card would rank it first for drilling and last for mining, which is precisely the distinction that matters at this stage.

Which sensors actually agreed
A composite satellite gold exploration score can hide disagreement. Each anomaly therefore also carries eight independent signal families, reported separately so a reader can see which evidence is carrying the target. Across all nine zones on this licence:
The diagnostic combination on this block is a classic one: iron-oxide enrichment at surface (gossan), AlOH–sericite halos (phyllic alteration), and a felsic-to-intermediate host rock — the alteration triplet associated with low-sulphidation epithermal gold. Every anomaly polygon falls inside that favourable alteration footprint, which is strong lithological corroboration of the geophysical signal. Concession-wide thermal score averaged 0.656 and bare-evidence persistence 0.031, both above the calibration baseline for non-prospective terrain — evidence that the anomalies are persistent surface expressions rather than transient noise.
The economics — and the honest negative result
At the reference gold price used for this satellite gold exploration Ghana study (USD 4,036.84 per troy ounce, spot on the report date), the portfolio economics are:
- 📊 Gross in-situ value: USD 4.7–10.9 million (P10–P90), central estimate ~USD 7.9M.
- 📊 Recoverable value at 81% blended recovery: USD 3.8–8.8 million, central ~USD 6.4M — that is ~950–2,180 recoverable ounces against a central 1,589 oz.
- ✔ By confidence tier (gross in-situ, central basis): High USD 1.5M from one zone, Medium USD 6.5M from five zones, Low USD 0.0M — there are no low-confidence zones on this licence.
- ⚠ All zones sit above the 0.25 g/t cut-off, but the weighted head grade of 0.71 g/t is a low-grade profile. That is the crux of the negative result below.
The pit optimiser found nothing — and we published it
This satellite gold exploration study went one step further than a prospectivity report normally does: it pushed the detected zones through the same sequence a mine-planning team would run — a block model, a pit optimisation, a grade–tonnage curve and a production schedule — as a purely conceptual exercise built on satellite data alone.
The pit optimiser found no shell with positive value at the scoping assumptions. At the modelled grades, costs and gold price, the mineralised envelopes do not pay for their own waste stripping. That is not an error in the model; it is the model’s answer.
A no-economic-pit outcome at scoping assumptions does not mean the gold isn’t there. It means this licence is a drill-targeting story, not yet a mining story. Three paths forward remain open, and drilling is what distinguishes them: confirm higher grades than the satellite model assumes; adopt selective or smaller-scale mining methods rather than bulk open-pit; or re-run the economics on materially different cost assumptions. A report that quietly suppressed this result to keep the headline clean would have cost the client far more than it saved.
The grade–tonnage curve adds useful texture to that. Tonnage barely moves at low cut-off grades and only starts falling above roughly 0.4 g/t — which says most of the modelled mineralisation sits comfortably above trivial grades rather than being smeared at the margin. Push the cut-off to 0.8 g/t and you retain about 12% of the expected tonnes while lifting average grade from ~0.51 to ~1.02 g/t. That is the selectivity trade a smaller, higher-margin operation would make, and it is the most plausible development shape for a block like this one.
Every conceptual mining figure in the source study is explicitly SYNTHETIC: generated from the satellite detection model, with no drilling, trenching, sampling or assaying behind any value. The confidence classes are exploration-target classes and deliberately not a mineral-resource classification. Nothing here is a Mineral Resource or Mineral Reserve under JORC, NI 43-101, SK-1300 or SAMREC, and it must not be used for public disclosure or as a standalone investment decision. Its purpose is to rank drill targets and size a Phase-1 budget.

Confidence, risk flags, and what could still be wrong
The most useful thing satellite gold exploration can do is tell you where it might be wrong. Every anomaly on this licence carries an explicit confidence label derived deterministically from two inputs: its multi-sensor signal-strength class, and the severity-weighted count of independent risk filters that disagreed with the headline signal.
For this satellite gold exploration Ghana licence that produced one high-confidence zone, five medium-confidence zones, zero low-confidence zones and three exclusions. Importantly, the tier governs order, not gating: every zone enters the Phase-1 validation sequence. The label decides which gets validated and drilled first, and how much capital rides on each phase — not whether the zone gets looked at.
Three satellite gold exploration risk flags were raised across the licence, and each carries a concrete, costed validation step rather than a shrug:
| Risk flag | Zones affected | Share of gold | What it means | How Phase 1 resolves it |
|---|---|---|---|---|
| Near AOI edge | 3 | 59.3% | Anomaly centroid within 200 m of the licence boundary — the polygon may be clipped, so the true footprint could be larger. | Extend the area of interest by 500 m and re-run to recover the full footprint. |
| No magnetic anomaly | 5 | 49.8% | No coincident magnetic response under the polygon. The magnetic layer is the weakest family on this block. | Drone or ground magnetic survey at 50–100 m line spacing. |
| Alteration only | 2 | 12.9% | Alteration signal is present but there is no coincident vein or breccia outcrop signature. | Outcrop traverses and rock-chip sampling to confirm the mineralisation style. |
Two of the nine polygons raised no flags at all. A methodological safeguard also ran: a zone cannot claim a Strong label on polygon-average evidence unless enough of its individual pixels independently class as Strong. On this licence no zone was demoted — every polygon’s pre- and post-consensus signal class matched, meaning the headline labels are consistent with the underlying pixel distributions rather than being propped up by averaging.
“Fewer than 30% of the initially flagged footprint survived all four filter stages — a conservative funnel by design.”
Beyond detection risk, the source study rates vein continuity at depth as a medium geological risk (continuity index averaged 79.2), grade variability as low given the narrow 0.515–0.991 g/t band, recovery factor as low-to-medium (81% blended is conservative for oxide gold, where heap-leach response typically runs 75–90% and CIL 88–94%), and gold price as low-to-medium, with the economics remaining positive down to around USD 3,000/oz.
From satellite target to drill collar: the phased plan
Satellite gold exploration only pays for itself if the ranked target list converts into a programme someone can budget. Each zone therefore carries recommended drilling geometry — azimuth, inclination, hole length and hole count — and the whole programme carries a parametric cost band.
For the confirmation programme across all nine zones: 887 planned metres, at an all-in diamond-core cost band of USD 150–250 per metre covering drilling, logging, assay and supervision, giving USD 133,000–222,000 and roughly 30 rig-days on a single rig excluding mobilisation. These are planning-grade figures — a drilling contractor’s quote supersedes them.
Phase 1 — confirmatory drilling (months 0–6)
- Drill four HQ diamond core holes on Zone 1 — the 626 oz anchor target — at azimuth 180°, inclination −70°, 98 m per hole.
- Drill eight HQ diamond core holes on Zone 4 — the 388 oz target — at azimuth 70°, inclination −70°, 63 m per hole.
- Collect a composite sample for bottle-roll cyanide test work and column-leach metallurgy, to establish recovery response on real material rather than an assumed 81%.
- Detailed geological mapping on a 1:1,000 grid, with structural measurements at every bedrock outcrop — this is also what resolves the “alteration only” flag.
Phase 2 — expansion and resource definition (months 7–12)
- Two confirmation holes each on Zones 6, 5 and 9 to validate the remaining satellite anomalies.
- Ground-magnetic and induced-polarisation survey across the concession — the direct answer to the “no magnetic anomaly” flag carried by five zones and half the detected gold.
- A code-compliant resource estimate (NI 43-101 / SK-1300) using a kriged block model, which is the point at which “exploration target” can legitimately become “resource”.
Phase 3 — pre-feasibility and permitting (months 13–24)
- Infill drilling on top-priority zones at a 25 m × 25 m grid to reach measured-and-indicated category.
- Geotechnical drilling, hydrogeological drilling and environmental baseline studies.
- Plan-of-operations permitting engagement with the relevant regulator, and a Pre-Feasibility Study with a capital estimate to ±25% accuracy.
Compare the two budgets. A blind reconnaissance programme across 422 hectares could consume a six-figure sum and still miss every zone. The satellite-derived Phase 1 puts 12 holes on two zones that together hold 51.7% of the detected metal, for USD 133,000–222,000 and about a month of rig time. Same commodity, same licence, radically different odds — because the holes are sited on 21+ layers of converging evidence instead of a hunch.

Impact: time, cost and ground disturbance
Set against how this licence would otherwise have been assessed, the impact of satellite gold exploration on this project falls into three buckets.
Time. Farmonaut delivers a mineral-intelligence analysis in 5–20 business days depending on area size and mineral complexity, compressing what conventional early-stage exploration measures in months into days. For a licence holder facing work-commitment deadlines, that difference is often the difference between holding ground and losing it.
Cost. Satellite screening lowers early-exploration cost by up to 80–85% relative to conventional ground-first workflows. On this block the saving is compounded by the exclusion finding: 78% of the anomalous footprint was ruled out on land access before anyone costed a drill pad over it. Money not spent chasing undevelopable ground is the cheapest money in exploration.
Ground disturbance. There was none. No trenching, no access tracks cut, no vegetation cleared, no community disruption — the entire assessment ran on orbital data. For operators working under increasing ESG scrutiny, a defensible target list generated with zero surface impact is not just cheaper; it is a materially different conversation with regulators and neighbours.
- ✔ 422 hectares screened in a single analysis pass, with no field mobilisation.
- ✔ Nine targets ranked and ordered for drilling, each with azimuth, inclination and hole length.
- ✔ Three undevelopable zones identified at the desktop stage — a 53.3-hectare land-access problem found before it became a field problem.
- 📊 A costed Phase-1 budget of USD 133,000–222,000 across 887 metres, replacing an open-ended reconnaissance spend.
- ⚠ An honest negative: no economic open pit at scoping assumptions, published rather than buried.
Farmonaut has now applied this satellite gold exploration workflow across 100,000+ hectares, 20+ mineral types and 25+ countries spanning Africa, South America, North America, Asia and Australia — gold and silver, base metals including copper, cobalt, nickel, zinc, iron and manganese, battery and energy minerals like lithium and uranium, industrial minerals, specialty materials including tantalum, niobium, beryllium and diamonds, and rare earth elements.

How to get satellite gold exploration run on your own licence
Commissioning satellite gold exploration on your own ground is deliberately light on intake. You provide the area of interest — coordinates, a KML/KMZ file, or a polygon drawn on a map — plus the country or region and your target mineral or minerals. We select the appropriate data source (multispectral or hyperspectral), acquire and process the imagery, run the analysis, and deliver inside 5–20 business days depending on size and mineral complexity.
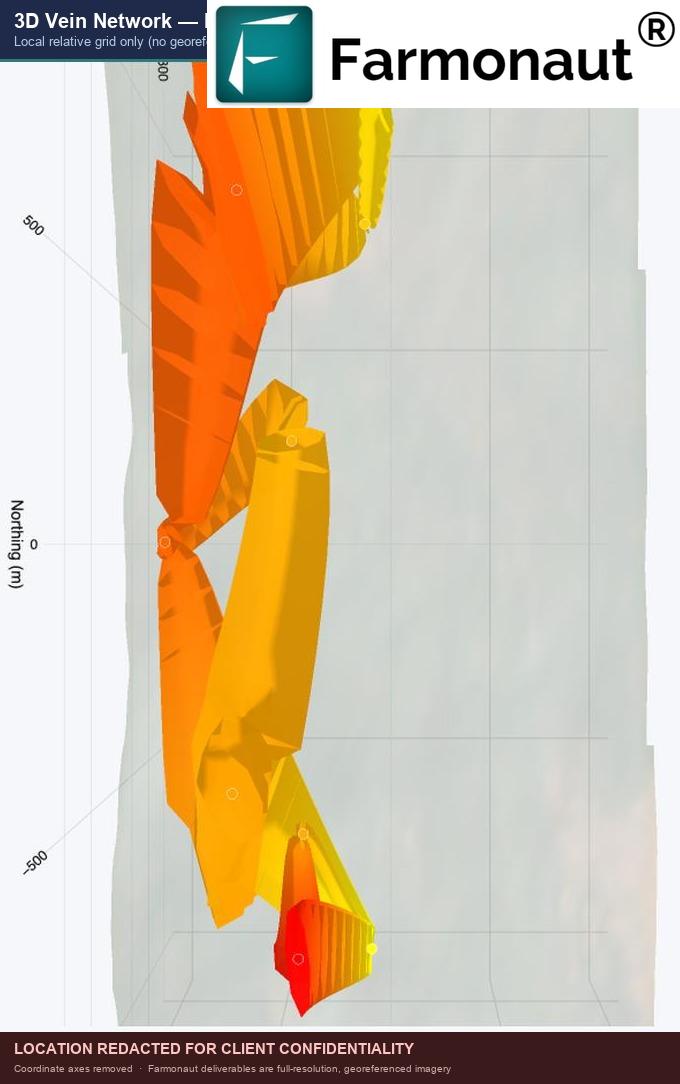
Two satellite gold exploration deliverable levels exist. The Premium mineral-intelligence report covers high-potential zones, prospectivity heatmaps, estimated location and depth ranges, indicative quantity, geological interpretation of faults, alteration and host rock, and seasonal anomaly validation — delivered as a PDF plus georeferenced GIS files. The Premium+ report adds TargetMax™ Drilling Intelligence: optimal drilling-angle recommendations for higher ore-intersection probability and reduced drilling risk, interactive 3D subsurface models of vein structures and mineral distribution, and commercial conclusions with next-step guidance. The Ghana study in this case study is a Premium+ style deliverable — the 3D vein network in Figure 6 is part of that layer.
Find out what your licence is actually sitting on
Send us a boundary and a target mineral. We’ll come back with ranked anomaly zones, grade and tonnage ranges, depth profiles and a drill order — in days, without a field team.

Glossary — the terms used above
- Gossan
- An iron-oxide-rich cap formed where sulphide minerals have weathered at surface. It is one of the strongest remotely detectable proxies for an underlying gold-bearing system, and the mineralisation style assigned to all nine zones on this licence.
- Exploration target
- A conceptual statement of the potential quantity and grade of a mineralised body, expressed as ranges. It is explicitly not a Mineral Resource and cannot be reported as one — it exists to justify and size the next round of exploration spend.
- P10 / P50 / P90
- The 10th, 50th and 90th percentiles of a modelled grade distribution. Quoting P10–P90 rather than a single number is what separates an honest satellite estimate from a misleading one.
- Cut-off grade
- The grade below which material is treated as waste rather than ore. This study used 0.25 g/t Au; raising the cut-off always shrinks tonnage and raises average grade.
- Strip ratio
- Tonnes of waste that must be moved per tonne of ore recovered. The licence-wide tonnage-weighted figure is 2.48; surface gold operations commonly accept up to 3.0–4.0.
- Blended recovery
- Mining recovery multiplied by metallurgical recovery. This study used 81% (90% × 90%), a conservative assumption for oxide gold.
- Dilution
- Waste rock unavoidably mixed with ore during extraction, which raises tonnage and lowers grade. Reported tonnages here carry a dilution allowance rather than assuming perfect selectivity.
- Lineament density
- A radar-derived measure of how fractured the ground is. Dense lineaments support structurally controlled vein emplacement — this licence averaged 395 per zone.
Frequently asked questions about satellite gold exploration in Ghana
Can satellites actually detect gold directly?
No — and any satellite gold exploration provider who claims otherwise is overselling. Gold at economic grades has no usable direct spectral signature from orbit. What satellite gold exploration detects is the geological signature that accompanies gold: iron-oxide gossan caps from weathered sulphides, clay and sericite alteration halos, silicified corridors with distinctive thermal behaviour, and the fracture architecture that channelled mineralising fluids. When many independent layers converge on the same ground, you have a target worth drilling. That is a fundamentally different — and more honest — claim than “we found gold from space”.
How accurate are the tonnage and grade numbers in a study like this?
Satellite gold exploration produces exploration-target estimates, which is why every figure in this case study appears as a range rather than a point value. The contained gold on this licence is quoted as ~1,170–2,690 troy ounces on a P10–P90 basis around a central ~1,960 oz, and the head grade as 0.43–0.98 g/t around a central 0.71 g/t. Geometric quantities like footprint area and depth to ore are better constrained and are simply rounded. Nothing becomes a Mineral Resource until drilling, assaying and a code-compliant estimate — Phase 2 of the plan above — have been completed.
Why were three of the nine anomaly zones reported as zero?
Because satellite gold exploration placed them on built-up, urban land, with the nearest mapped building at 0 m, 3 m and 7 m from the anomaly footprint. Their combined 53.3 hectares represents 78% of all anomalous ground on the licence. Their grades — 0.59–0.77 g/t Au — are fully in line with the zones that were counted, so this is a land-access constraint rather than a geological one. We report them at zero contained gold, tonnage and value, and exclude them from every total, because a number you cannot legally or ethically mine is not an asset.
The pit optimiser found no economic pit. Does that mean the project is dead?
No. It means the licence is a drill-targeting proposition rather than a mining proposition at present. The conceptual study assumed satellite-modelled grades, generic costs and the reference gold price; at that combination the mineralised envelopes don’t pay for their own waste stripping. Three routes remain: confirm higher grades by drilling, adopt selective or smaller-scale mining rather than bulk open-pit, or re-run the economics on genuinely different cost assumptions. Publishing the negative is the point — it stops capital from being committed on a false premise.
How long does a satellite mineral detection analysis take, and what do you need from me?
Satellite gold exploration delivery runs 5–20 business days depending on the size of the area and the complexity of the target mineral. From you we need only the area of interest — coordinates, a KML/KMZ file, or a polygon you draw on a map — the country or region, and your target mineral or minerals. You can start either through the mining query form or by drawing the boundary directly at mining.farmonaut.com.
What makes a satellite anomaly “high confidence” versus “medium confidence”?
Satellite gold exploration confidence rests on two inputs, applied deterministically. First, the anomaly’s multi-sensor signal-strength class, which rolls up eight independent signal families. Second, the severity-weighted count of independent risk filters that disagreed with that headline signal. A High label requires a strong signal class and minimal disagreement. A Medium label means the signature is real but at least one corroborating layer dissents — on this licence that applied to five zones holding 82% of the detected metal. Crucially, the tier governs the order of validation and drilling, not whether a zone is validated at all.
Does this work outside Ghana, and for minerals other than gold?
Yes. Satellite gold exploration is not geography-restricted — the same workflow has been applied across 100,000+ hectares in 25+ countries across Africa, South America, North America, Asia and Australia. Detectable materials span precious metals (gold, silver), base metals (copper, cobalt, nickel, zinc, iron, manganese), energy and battery minerals (lithium, uranium), industrial minerals (gypsum, dolomite, quartz), specialty and high-value materials (tantalum, niobium, beryllium, diamonds, star garnets) and rare earth elements — 20+ mineral types in total.
Disclaimer and basis of preparation. This case study summarises a confidential client deliverable published with the client’s identity, concession name, coordinates and precise location removed, and with satellite imagery deliberately redacted (basemaps slated, interiors blurred, coordinate axes cropped). All grade, tonnage, depth, confidence and economic figures are the unaltered outputs of the satellite analysis. Resource and economic figures are exploration-target estimates derived from remote-sensing data only, presented as P10–P90 ranges; no drilling, trenching, sampling or assaying underlies any value quoted. Conceptual mining figures are explicitly synthetic and are not a Mineral Resource or Mineral Reserve under JORC, NI 43-101, SK-1300 or SAMREC, and must not be used for public disclosure or as a standalone basis for an investment decision. Gold price basis: USD 4,036.84 per troy ounce, the reference spot price recorded in the source analysis. Farmonaut provides satellite data analytics and does not offer investment, financial or legal advice.
Discussion
Questions, corrections or field experience? Share them below. First-time comments are reviewed before they appear, and your email is never published.
No comments yet. Be the first to add a question or your experience.

 CIMISCO SARL
 Mining SARL
 SenGold Invest SAS
 Sania Corporation
 Sean Mining Limited
 NTS Group (Pty) Ltd
 Mine4Africa
 Lithspo Minerals Limited
 Tintina Mining Group
 Dalgety Minerals Pty Ltd
 Vortex Minerals Pty Ltd
 Faith At Work (Pty) Ltd
 Geotech Mining Solutions plc
 Vulcan International Limited
 Kidepo Associates
 GKY Mining
 Alkimy SARL
 Double A Trading
 GemSprout Metals Limited
 Qader Group
 Ileys General Trading
 SG Gold Mining LLC
 VRV Global Pte Ltd
 Omsri International FZE
