

Satellite Gold Exploration Zimbabwe: Proven Case
How a purely space-based workflow mapped 8,662 troy ounces of gold across ten drill-ready targets — without a single boot on the ground.
Region: Zimbabwe (site redacted)
Method: 21-layer multi-sensor
Zones: 10 detected
Confidence: 2 High · 6 Medium
Satellite gold exploration in Zimbabwe has quietly crossed a threshold that most explorers still associate with expensive field campaigns: an entire licence area can now be screened for gold — and ranked into drill-ready targets — before a single boot touches the ground. In a recent project we completed for a gold exploration concession in Zimbabwe, our satellite geosciences team mapped 8,662 troy ounces of in-situ gold across ten discrete anomaly zones, delivered a full drill plan, and did it all from orbit. This case study walks through exactly how that analysis was built, what it found, and how the same workflow can be applied to any concession worldwide.
The concession identity, coordinates and exact location have been redacted throughout this article at the client’s request; every geological and economic figure below is reported verbatim from the delivered analysis. The point is not where — it is how a purely space-based workflow produced investor-grade targeting in a fraction of the time and cost of a conventional program.
8,662 oz of gold mapped across 10 zones — from satellites, before any drilling.
Why traditional gold exploration is so slow and expensive
Early-stage gold exploration has always been a game of expensive elimination. Ground crews trench, sample, and run geochemistry across huge areas — most of which turn out to be barren. Drilling, the ultimate arbiter, can cost hundreds of thousands of dollars per program before anyone knows whether a target is real. The result: months of fieldwork, significant environmental disturbance, and capital committed long before the geology justifies it.
The core problem is sequencing. Conventional programs spend the most money — drilling — on targets chosen from limited surface information. If those targets are wrong, the money is gone. What explorers need is a way to interrogate the whole licence first, cheaply and non-invasively, so that drilling is aimed only where multiple independent lines of evidence already agree.
That is precisely the gap satellite-based mineral detection fills. Every mineral and alteration zone reflects electromagnetic energy with a unique spectral signature. By analysing that reflected energy from orbit — across visible, infrared, thermal, radar and magnetic bands — a prospective footprint can be resolved without disturbing a single square metre of ground.
The Farmonaut satellite approach: 21+ data layers fused into one score
For this satellite gold exploration Zimbabwe project, our detection pipeline fused more than 21 orbital and geophysical data layers into a single composite Gold Prospectivity Index (GPI), computed at a 10-metre ground sample distance across the whole concession. Each sensor contributes a distinct piece of the geological picture:
- ✔ Sentinel-2 multispectral — vegetation indices, hydrothermal-alteration RGB, and iron-oxide ratios that flag surface gossan.
- ✔ ASTER short-wave infrared — AlOH–sericite, argillic and carbonate–chlorite ratios that map proximal alteration mineralogy.
- 📊 Sentinel-1 & PALSAR-2 radar — lineament density, surface roughness and structural fabric that reveal fault and vein networks.
- 📊 MODIS / ASTER thermal — day–night land-surface temperature anomalies tied to silicification and sulfide oxidation.
- ✔ EMAG-2 magnetics + Copernicus DEM — basement structure, intrusive footprints, and terrain geomorphology.
The complete multi-sensor data stack
The GPI is not a single clever index — it is the fusion of independent physical measurements, each answering a different geological question. The full stack and the role each layer plays:
| Sensor / data layer | Band / resolution | Geological role |
|---|---|---|
| Sentinel-2 multispectral | 10 m | Visible/NIR reflectance — vegetation indices, hydrothermal-alteration RGB, iron-oxide ratio. |
| ASTER SWIR | 30 m | AlOH–sericite, argillic and carbonate–chlorite ratios for proximal alteration mineralogy. |
| Sentinel-1 SAR | C-band | Dual-orbit lineament density, surface roughness, structural fabric and fault networks. |
| PALSAR-2 | L-band | HH/HV backscatter and temporal stability — vein-controlled relief and bedrock exposure. |
| MODIS / ASTER GED | thermal | Diurnal land-surface-temperature anomalies — silicification and sulfide-oxidation flags. |
| EMAG-2 magnetics | global grid | World Digital Magnetic Anomaly grid — basement structure and intrusive footprints. |
| Copernicus DEM | 30 m | Slope, aspect, hillshade, flow accumulation, knickpoint and meander proxies. |
| Sentinel-2 time series | multi-date | Bare-ground persistence, geobotanical stress, and a laterite-cover penalty. |
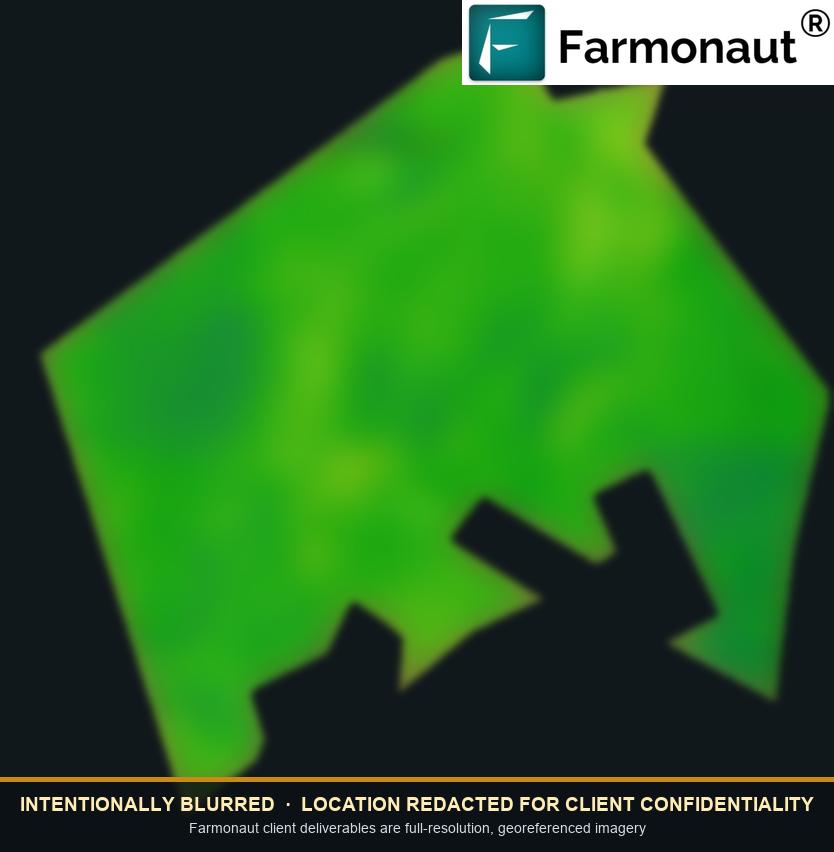
Per pixel, the composite is a weighted blend of multiple normalised sub-scores spanning alteration mineralogy, structural density, surface evidence, thermal signatures and geomorphology. Discrete anomaly polygons are then extracted by thresholded connected-component analysis. Crucially, warm, spatially coherent anomalies — rather than fragmented salt-and-pepper noise — are themselves evidence of a robust signal: real gossan systems produce contiguous anomalies that survive multi-sensor fusion.
Turning that composite surface into discrete, drillable targets takes two further steps. First, contiguous high-scoring pixels are grouped and wrapped in an oriented minimum-area bounding box, which records each anomaly’s dominant strike — the orientation a drill fence must cut across. Second, every polygon receives a coherence score that combines its elongation with its boundary smoothness: genuine vein-controlled systems are elongated and smooth, whereas noise is blocky and random. Only anomalies that clear both the score threshold and the coherence test are carried forward — the first of several deliberately conservative gates.
Want this analysis for your own licence? Get a quote here, or explore the underlying product at Satellite-Based Mineral Detection.

From pixels to priorities: a conservative detection cascade
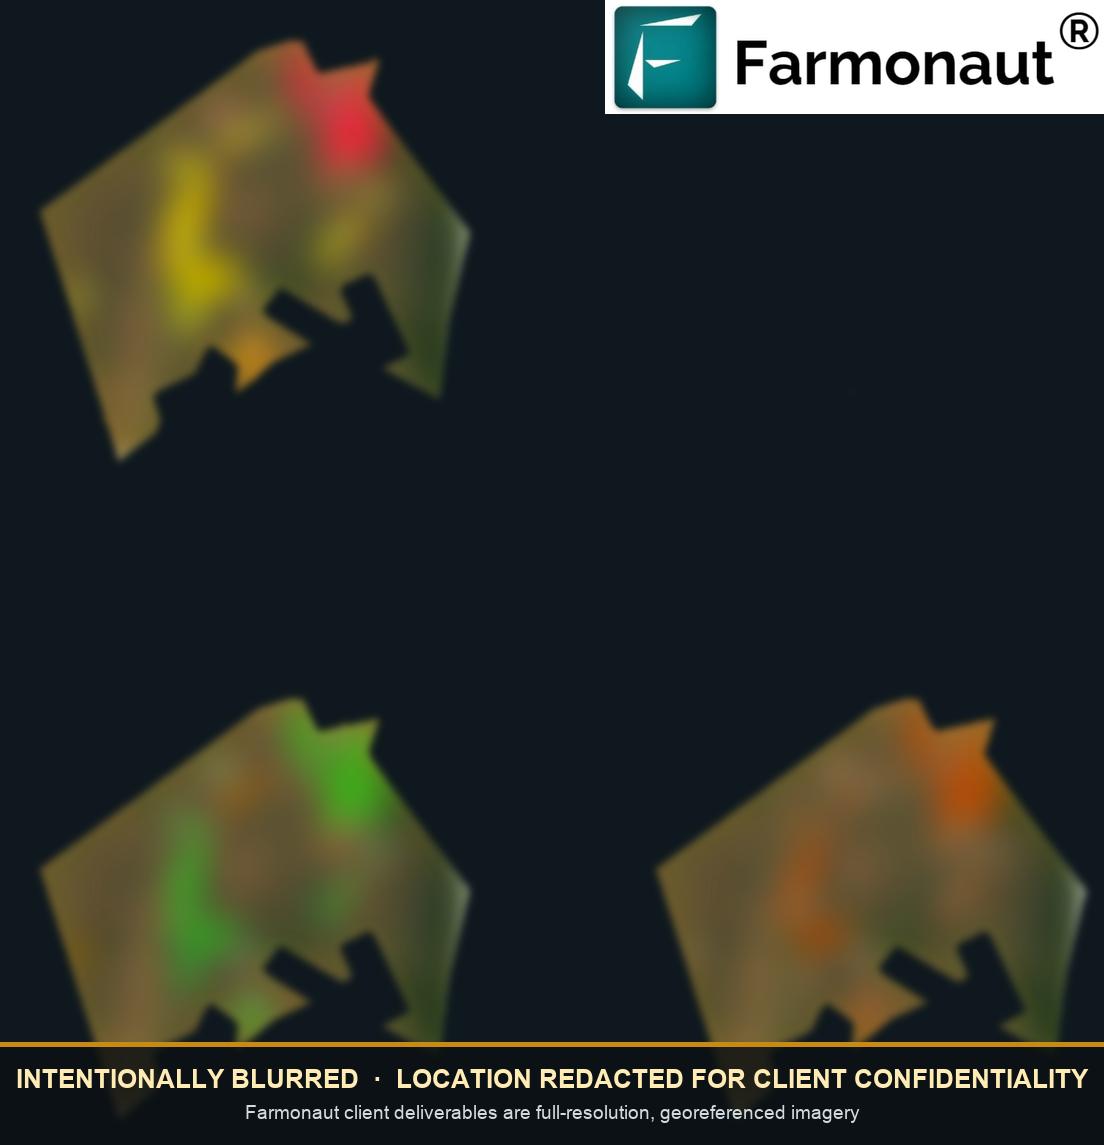
Raw prospectivity is only the starting point. The pipeline runs each candidate through a four-stage cascade — raw Sentinel-2 reflectance → composite GPI score → detectability (open / bare-terrain) bonus → final economic-priority surface. A parallel target-selection cascade then applies four refinement filters: priority ranking, an artisanal/placer filter, cover-and-vegetation penalties, and a geological × economic filter.
The result is deliberately conservative. Less than 30% of the initial priority footprint survives all four filtering stages. That funnel trades some recall for a materially lower false-positive rate — the right trade-off for an investor-grade scan where the cost of chasing a phantom target is a wasted drill hole.
Results: what the satellite gold exploration in Zimbabwe found
Across the surveyed area, the pipeline identified 10 discrete economic anomaly zones over a 45.84-hectare footprint. Aggregate in-situ contained gold was estimated at 269.4 kg (8,662 troy oz), hosted within 226,727 tonnes of mineralised rock at a tonnage-weighted head grade of 1.934 g/t Au. At a reference gold price of US$4,066.80 per troy ounce, the gross in-situ value came to approximately US$35.2 million, with an indicative recoverable value near US$28.5 million at an industry-standard 81% blended recovery.
All mineralisation classified as open-pit-amenable: the ore body crests at just 36 metres below surface and bottoms at 80 metres. Terrain is benign — mean slope 8.55°, comfortably below the 25° threshold that complicates open-pit geotechnics — and the tonnage-weighted strip ratio of 2.647 sits well inside the 3.0–4.0 that surface gold operations commonly accept.
Headline metrics at a glance
| Metric | Value (as delivered) | How satellite intelligence helped |
|---|---|---|
| Area surveyed | 327.46 ha (809 acres) | Screened in days, not field seasons |
| Prospective footprint | 45.84 ha (14% of area) | 86% of ground de-prioritised before drilling |
| Contained gold (in-situ) | 269.4 kg / 8,662 oz | Grade × tonnage modelled per pixel |
| Head grade (weighted) | 1.934 g/t Au | Above 0.25 g/t cut-off across all zones |
| Gross in-situ value | ~US$35.2M | Ranked by economic priority surface |
| Recoverable value (81%) | ~US$28.5M | Scenario-tested $25.5M–$30.8M |
| Depth to ore | 36–80 m (open-pit) | Modelled from DEM + geometry |
| Confidence split | 2 high / 6 medium / 0 low | Deterministic multi-sensor scoring |
Two zones alone hold 66.6% of the gold — the definition of efficient drilling capital.
How the tonnage and grade are actually calculated
It is worth being transparent about the arithmetic, because “contained gold from satellites” can sound like a black box. It is not. Each anomaly polygon carries a modelled strike length, width and mineralised thickness, which combine into a rock volume; multiplying by a reference density (2.4 t/m³ for oxide-hosted material) gives tonnage, and multiplying tonnage by the per-pixel grade gives contained metal. A dilution factor (10–18% in this project) and a 0.25 g/t cut-off grade are applied so the numbers stay conservative rather than optimistic. Every figure in the report is therefore traceable from a raw reflectance pixel all the way up to its dollar value on the economic-priority surface — an audit trail that matters when the output will be read by an investment committee.
Formally, the chain from geometry to contained metal runs:
Diluted Tonnage = Undiluted × (1 + Dilution %) — Dilution 10–18%
Contained Gold (kg) = Diluted Tonnage (t) × Grade (g/t) ÷ 1000
Reference density = 2.4 t/m³ · Cut-off = 0.25 g/t Au · Blended recovery = 81%
The per-pixel grade model also exposes internal variability that a single polygon-average number would hide. Across the concession, modelled pixel grades ranged from roughly 1.05 g/t at the low end of individual zones to over 2.7 g/t in the richest cores, with the highest-grade vein interiors touching 2.36 g/t on the network model. That heterogeneity is exactly what a drill program is designed to test — and mapping it in advance is what lets the drill plan target the hottest pixels rather than the polygon centroid.
Eight independent signal families and multi-signal drill ordering
The single most important discipline in this satellite gold exploration Zimbabwe analysis is that no target is trusted on one signal alone. Each anomaly is scored across eight independent signal families, and the headline strength you see elsewhere in the report is a composite of all of them. Opening up that composite lets a reader see which lines of evidence are agreeing on each target — and where a single strong signal sits alone and needs extra ground validation.
- 📊 Hydrothermal alteration — clay, iron-oxide and sericite signatures from ASTER and Sentinel-2.
- 📊 Thermal anomaly — day–night thermal contrast from ASTER GED and MODIS land-surface temperature (Strong across 8 of 10 zones).
- 📊 Radar / subsurface roughness — L-band PALSAR and C-band Sentinel-1 surface roughness.
- 📊 Magnetic signature — EMAG-2 magnetic-anomaly response.
- 📊 Structural / lineament — DEM-derived lineament density and lithology proxy.
- 📊 Vegetation biogeochemistry — NDVI suppression and dry-season vegetation stress over mineralisation (Strong across 8 of 10 zones).
- 📊 Surface exposure & drainage — persistent bare-ground evidence and placer-favourable geomorphology.
Aggregated across all ten anomalies, the families sort into a clear evidence hierarchy — thermal and vegetation signals are the concession’s strongest, while the magnetic response is marginal (consistent with a quartz-vein / sediment-hosted style lacking magnetite):
| Signal family | AOI-wide strength | Strong zones | Moderate zones |
|---|---|---|---|
| Thermal anomaly | Strong | 8 / 10 | 2 / 10 |
| Vegetation biogeochemistry | Strong | 8 / 10 | 2 / 10 |
| Radar / subsurface roughness | Moderate | 6 / 10 | 2 / 10 |
| Surface exposure & drainage | Moderate | 0 / 10 | 7 / 10 |
| Structural / lineament | Moderate | 3 / 10 | 7 / 10 |
| Hydrothermal alteration | Moderate | 0 / 10 | 8 / 10 |
| Magnetic signature | Marginal | 0 / 10 | 0 / 10 |
Those family scores roll up into a four-tier drill order. Tier 1 — Drill First was assigned to the single zone where four families fired Strong at once. Tier 2 — High Interest and Tier 3 — Follow-up captured the bulk of the portfolio, while Tier 4 — Watch / Validate flagged a zone supported mainly by vegetation signal, to be confirmed by ground traverse before committing capital. Critically, the tiers govern drill order, not whether a zone is validated at all — every anomaly enters the Phase-1 validation sequence.
| Rank | Zone | Drill tier | Strong families | Risk flags | Confidence |
|---|---|---|---|---|---|
| 1 | Zone 5 | Tier 1 · Drill First | 4 | 1 | High |
| 2 | Zone 8 | Tier 2 · High Interest | 2 | 2 | Medium |
| 3 | Zone 9 | Tier 2 · High Interest | 3 | 2 | Excluded |
| 4 | Zone 2 | Tier 2 · High Interest | 3 | 1 | High |
| 5 | Zone 10 | Tier 2 · High Interest | 2 | 2 | Medium |
| 6 | Zone 6 | Tier 2 · High Interest | 3 | 2 | Medium |
| 7 | Zone 4 | Tier 3 · Follow-up | 2 | 3 | Excluded |
| 8 | Zone 7 | Tier 3 · Follow-up | 3 | 3 | Medium |
| 9 | Zone 3 | Tier 3 · Follow-up | 2 | 3 | Medium |
| 10 | Zone 1 | Tier 4 · Watch / Validate | 1 | 3 | Medium |
The ranking fuses grade, contained metal, signal strength and the count of independent risk flags into a single drill-ordering score. Note that a high economic value does not automatically mean “drill first”: Zone 2 is the portfolio’s most valuable zone, yet Zone 5 leads the program because four independent signal families fire Strong on it at once — the multi-signal agreement that most de-risks a first hole.
Terrain and hydrology: why these are drillable bedrock targets
Two questions decide whether a gold anomaly is worth drilling: is it structurally hosted in bedrock (high-value, drillable) or merely reworked alluvium (lower-value placer), and is the ground physically mineable? The satellite stack answered both. A dedicated geomorphology and hydrology layer — DEM hillshade, flow accumulation, and a placer-geomorphology score — showed a consistently low placer score across every zone, confirming the targets are bedrock-hosted vein systems rather than alluvial concentrations. The mapped drainage network, meanwhile, does not cross any anomaly polygon, so surface water is not a permitting complication.
On mineability, the terrain is benign: a mean slope of 8.55° sits far below the 25° threshold that triggers open-pit geotechnical problems, and the minimum distance to any building is comfortably clear of the anomalies. Combined with shallow ore (36–80 m) and a favourable weighted strip ratio of 2.647, the concession presents as a textbook shallow open-pit setting — which is precisely why the analysis classified all mineralisation as open-pit-amenable.
Economics under pressure: sensitivity and recovery scenarios
A single valuation headline is fragile; a good report stress-tests it. This one modelled the project across a gold-price band of US$2,850–5,300/oz. At the low end the gross in-situ value held at US$24.7M; at the high end it reached US$45.9M — and the economics remained positive all the way down to roughly US$3,000/oz. With gold trading well above that level, the project sits comfortably in the money across the realistic price range.
Metallurgical recovery was bracketed the same way. The base case applied an 81% blended factor (90% mining × 90% metallurgical), yielding about US$28.5M recoverable. A conservative 72.25% scenario still returned US$25.5M, while an optimistic 87.42% pushed to US$30.8M. For oxide gold of this style, the base case is deliberately conservative — bottle-roll cyanide and column-leach test work commonly return 75–94% — so the delivered valuation errs toward caution rather than hype.
| Recovery scenario | Blended factor | Recoverable gold | Recoverable value |
|---|---|---|---|
| Conservative | 72.25% | 6,259 oz | US$25.5M |
| Base case | 81.00% | 7,017 oz | US$28.5M |
| Optimistic | 87.42% | 7,573 oz | US$30.8M |
Zone-by-zone: the geology behind the numbers
Every anomaly was classified as Gossan Zone mineralisation with an average structural confidence of 149.3 — well above the high-confidence threshold of 100. The diagnostic alteration triplet was consistent across the licence: surface iron-oxide enrichment (gossan), AlOH-sericite halos (phyllic alteration), and a felsic-to-intermediate host rock — the classic signature of low-sulfidation epithermal gold. All ten polygons fall inside this favourable alteration footprint, giving strong lithological corroboration of the geophysical signal.
Structurally, the setting is equally favourable. SAR lineament density averages 252 mappable lineaments per zone with a dominant strike near 91°, indicating a pervasive, consistently oriented fracture network for veins to exploit; and the EMAG-2 magnetic pattern is consistent with subsurface intrusive cupolas — the thermal engine that drives shallow epithermal gold systems. The concession sits at roughly 1,019 m elevation on gentle 8.55° slopes, so structure and terrain both point to a shallow, drillable target set rather than a deep or faulted one.

- ✔ Zone 2 (highest tonnage) — 3,318 oz at 2.229 g/t; strong thermal, radar and vegetation agreement; top of ore at 36 m.
- ✔ Zone 5 (Drill First) — the only Tier-1 target; four signal families fire Strong simultaneously, making it the natural lead for the drill program.
- 📊 Zone 6 — 2,451 oz with a favourable 1.20 strip ratio and strong structural framing (top 1% lineament density).
- ⚠ Two excluded zones — sitting on built-up/urban or protected land, reported at zero contained value and omitted from all portfolio totals.
The full ten-zone portfolio, side by side. Every detected anomaly, its diluted head grade, contained gold, tonnage, strip ratio, in-situ value and confidence tier — the excluded urban/protected zones are shown for completeness but carry zero portfolio value:
| Zone | Tier | Grade (g/t) | Contained gold | Tonnage (t) | Strip | In-situ value | Confidence |
|---|---|---|---|---|---|---|---|
| Zone 2 | Tier 2 | 2.229 | 3,318 oz | 46,293 | 3.60 | US$13.5M | High |
| Zone 6 | Tier 2 | 1.589 | 2,451 oz | 47,968 | 1.20 | US$10.0M | Medium |
| Zone 5 | Tier 1 | 1.682 | 1,169 oz | 21,618 | 1.14 | US$4.8M | High |
| Zone 1 | Tier 4 | 1.492 | 575 oz | 11,978 | 1.29 | US$2.3M | Medium |
| Zone 8 | Tier 2 | 2.203 | 519 oz | 7,328 | 3.90 | US$2.1M | Medium |
| Zone 3 | Tier 3 | 2.158 | 309 oz | 4,453 | 4.20 | US$1.3M | Medium |
| Zone 7 | Tier 3 | 2.360 | 175 oz | 2,311 | 4.00 | US$0.7M | Medium |
| Zone 10 | Tier 2 | 1.620 | 146 oz | 2,811 | 3.80 | US$0.6M | Medium |
| Zone 4 | — | 1.796 | excluded | — | — | US$0.0M | Excluded · urban |
| Zone 9 | — | 1.525 | excluded | — | — | US$0.0M | Excluded · protected |
| Portfolio | — | 1.934 | 8,662 oz | 226,727 | 2.65 | US$35.2M | 2 High · 6 Med |
Splitting the same portfolio by confidence tier shows how evenly value is distributed between the high- and medium-confidence subsets — and that nothing was parked in a low-confidence bucket to pad the headline:
| Confidence tier | Zones | Contained gold | Ore tonnage | Gross in-situ value |
|---|---|---|---|---|
| High | 2 | 4,487 oz (139.6 kg) | 67,911 t | US$18.2M |
| Medium | 6 | 4,176 oz (129.9 kg) | 76,851 t | US$17.0M |
| Low | 0 | 0 oz | 0 t | US$0.0M |
Anatomy of the three priority zones
Each detected zone carries a full geological, geometric and economic profile in the delivered report. The three that anchor the drill program are summarised below (site coordinates redacted):
Zone 5 — the program lead
Zone 2 — the value anchor
Zone 6 — the structural target

See the full mineral-detection workflow in action — Map Your Mining Site with Farmonaut ➜

Honest confidence: what the analysis flagged as needing validation
A credible satellite report does not just report finds — it reports what still has to be checked. This is where a disciplined pipeline earns its investor-grade label. Each anomaly was cross-checked against six independent risk filters, and every disagreement between a filter and the headline signal was disclosed as a scoping item for Phase-1 validation, not buried.
- ⚠ Alteration-only (all 10 zones) — a strong alteration signature is present, but no vein/breccia outcrop was visible from orbit; mitigation is outcrop traverses and rock-chip sampling.
- ⚠ Near-AOI-edge (6 zones) — centroids within 200 m of the licence boundary, a possible clipping artefact; mitigation is extending the survey and re-running.
- 📊 No coincident magnetic anomaly (6 zones) — consistent with sediment-hosted or quartz-vein style without magnetite; mitigation is a drone or ground magnetic survey.
Signal integrity was also audited internally: a pixel-consensus safeguard checks that every polygon’s headline strength is reproduced by its underlying pixels. In this run, no drift was detected — pre- and post-consensus classes matched for all ten zones. Broader risk ratings were modest: grade variability Low (grades ranged just 1.492–2.360 g/t), permitting Low, and gold-price risk Low–Medium, with the economics staying positive down to roughly US$3,000/oz.
A drill plan, not just a map
The deliverable went beyond anomaly maps to a fully specified drill program: 58 HQ diamond-core holes for a combined 4,030 metres (13,222 ft), each with a recommended azimuth, incline and hole length oriented perpendicular to the local vein strike, plus 3D drill-target vectors and an economic heat map showing where value concentrates in three dimensions. To size the first move, the report also costed a leaner Phase-1 confirmation pass — one hole per zone, roughly 876 m in total — at about US$131,000–219,000 across a US$150–250/metre all-in band, achievable in around 29 rig-days on a single rig.
| Zone | Planned m | Cost @ $150/m | Cost @ $250/m | Rig-days |
|---|---|---|---|---|
| Zone 1 | 117 | $17,617 | $29,362 | 3.9 |
| Zone 2 | 68 | $10,130 | $16,883 | 2.3 |
| Zone 3 | 76 | $11,451 | $19,085 | 2.5 |
| Zone 4 | 107 | $16,076 | $26,793 | 3.6 |
| Zone 5 | 110 | $16,516 | $27,527 | 3.7 |
| Zone 6 | 113 | $16,956 | $28,261 | 3.8 |
| Zone 7 | 73 | $11,011 | $18,351 | 2.4 |
| Zone 8 | 72 | $10,790 | $17,984 | 2.4 |
| Zone 9 | 69 | $10,350 | $17,250 | 2.3 |
| Zone 10 | 70 | $10,570 | $17,617 | 2.3 |
| Total | 876 | $131,467 | $219,112 | 29.2 |
Parametric, planning-grade figures — one confirmation hole per zone at the recommended length plus a 15% contingency, ~30 m/day single-rig advance excluding mobilisation. A drilling-contractor quote supersedes them.

A conceptual mining study — clearly labelled as an exploration target
To help stakeholders visualise the path forward, the report included a conceptual, synthetic mining study: a floating-cone pit shell, a block model, and a life-of-mine schedule. We flag this explicitly, exactly as the report does: these figures are satellite-derived exploration-target estimates only. No drilling, trenching, sampling or assaying stands behind any of them. The confidence classes used (Class A / B / C) are deliberately not a mineral-resource classification, and the study is not a Mineral Resource or Reserve under JORC, NI 43-101 or SAMREC — and must not be used for disclosure or investment decisions.
Within that framing, the conceptual exercise is useful for one thing: rehearsing the full software workflow and quantifying what a real Phase-1 campaign should test. It converts satellite targets into an importable synthetic drillhole database that engineers can load into standard mine-planning packages, so the moment real assays arrive, the geological model is ready to receive them.
Within the study, the target inventory is split into satellite-confidence classes — Class A / B / C. These are explicitly not the Measured / Indicated / Inferred categories of a mineral resource; they simply rank how strongly the remote-sensing evidence supports each block:
| Confidence class | Meaning | Expected ore (t) | Expected gold | % of metal |
|---|---|---|---|---|
| Class A | Strongest remote-sensing signal, low false-positive risk | 66,508 | 4,428 oz | 51% |
| Class B | Moderate signal or elevated false-positive risk | 78,253 | 4,234 oz | 49% |
| Class C | Weak / marginal signal or high false-positive risk | 0 | 0 oz | 0% |
SYNTHETIC — satellite-derived conceptual model; no drill data exists. Figures reconcile to the 8,662 oz detection total and must not be used for disclosure or investment decisions.
The recommended phased exploration roadmap
The report closed with a concrete, three-phase plan that turns the satellite targets into a defensible development path. Each phase is scoped so that capital escalates only as confidence is earned — the opposite of the traditional “drill first, learn later” pattern.
- Phase 1 — Confirmatory drilling (Months 0–6). Diamond-core holes on the two highest-value zones (a 3,318 oz target and a 2,451 oz target), a composite sample for bottle-roll cyanide and column-leach metallurgy, and detailed 1:1,000 geological mapping with structural measurements at every bedrock outcrop.
- Phase 2 — Expansion & resource definition (Months 7–12). Confirmation holes on the next-priority zones, a ground-magnetic and induced-polarisation survey across the licence, and a first NI 43-101 / SK-1300 compliant resource estimate built on a kriged block model.
- Phase 3 — Pre-feasibility & permitting (Months 13–24). Infill drilling on a 25 m × 25 m grid for measured-and-indicated categories, geotechnical and hydrogeological drilling, environmental baseline studies, plan-of-operations permitting, and a pre-feasibility study with a capital estimate to ±25% accuracy.
Because the satellite deliverable already includes 3D drill-target vectors and an importable synthetic drillhole database, Phase 1 begins with the geological model pre-built. When real assays land, they flow straight into a framework that is ready to receive them — shaving weeks off the transition from raw data to a first resource estimate.

The impact: months to days, and a fraction of the cost
The strategic value of this satellite gold exploration Zimbabwe project is best understood as a change in when money gets spent. Instead of committing a field crew and a drill rig to open-ended reconnaissance, the operator received a ranked, quantified, drill-ordered target set before spending on the ground at all.
- ✔ Timeline compressed — early exploration screening shifts from months of fieldwork to days of analysis.
- ✔ Cost reduced — remote screening can lower early-exploration spend by up to 80–85% versus ground-first approaches.
- 📊 Capital focused — 86% of the licence was de-prioritised, so drilling dollars concentrate on the 14% that matters.
- 🌱 ESG-aligned — no ground disturbance during the exploration phase.
To date, our satellite mineral-detection platform has scanned 100,000+ hectares across 25+ countries for 20+ mineral types, with gold projects spanning Kenya, Tanzania, Ghana, Zimbabwe, Mauritania, the DRC, Peru and beyond. The workflow is commodity-agnostic — the same fusion approach detects copper, lithium, cobalt, uranium, rare earths and more.

How to get this analysis for your own concession
The workflow behind this case study is available to any exploration team, junior miner, or investment committee evaluating a licence. The process is simple: you provide an area of interest (coordinates, KML/KMZ, or a polygon), the country/region, and your target mineral(s). We select the appropriate data source, acquire and analyse it, and deliver a georeferenced report — typically in 5–20 business days depending on size and mineral complexity.
- ✔ Premium report — high-potential zones, prospectivity heatmaps, estimated location and depth ranges, indicative quantity, and geological interpretation, delivered as PDF plus georeferenced GIS files.
- ✔ Premium+ report — adds TargetMax™ Drilling Intelligence: optimal drilling angles, interactive 3D subsurface models of vein structures, and commercial next-step guidance.
Turn your licence into a ranked drill plan
Send us an area of interest and a target mineral — we handle the satellites, the science and the deliverable. Investor-grade targeting in 5–20 business days.
You can also review our satellite-based mineral detection overview and our satellite-driven 3D mineral prospectivity mapping guide.


Glossary of key terms
A quick reference for the technical vocabulary used throughout this case study:
- Gold Prospectivity Index (GPI)
- The single composite score, computed per 10-metre pixel, that fuses 21+ satellite and geophysical layers into one measure of how favourable the ground is for gold.
- Gossan
- An iron-oxide-rich weathering cap formed above an oxidising sulfide body — a classic surface fingerprint of buried mineralisation.
- Low-sulfidation epithermal
- A near-surface gold deposit style formed by hot hydrothermal fluids; here indicated by the iron-oxide + sericite + felsic-host alteration triplet.
- Sericite / phyllic alteration
- A halo of fine white mica (with the diagnostic AlOH signature) that surrounds many hydrothermal gold systems and is mappable by ASTER SWIR.
- Lineament
- A linear terrain feature — fault, fracture or vein trace — extracted from radar and DEM data; dense, consistently oriented lineaments signal structural control.
- Head grade & g/t
- The average gold concentration of the ore, in grams of gold per tonne of rock (g/t). This project’s tonnage-weighted head grade is 1.934 g/t.
- Cut-off grade (COG)
- The minimum grade worth including in the resource; blocks below the 0.25 g/t cut-off are treated as waste.
- Strip ratio
- Tonnes of waste that must be moved per tonne of ore. The portfolio’s 2.65 weighted ratio is favourable for open-pit gold.
- Dilution
- Waste rock unavoidably mined with the ore, which lowers the effective grade; modelled here at 10–18% per zone.
- In-situ vs recoverable
- In-situ value is the metal in the ground; recoverable value applies mining and metallurgical losses (an 81% blended factor here).
- Exploration Target
- A satellite-derived, pre-drilling estimate of potential quantity and grade — deliberately distinct from, and never a substitute for, a drilled Mineral Resource.
- NI 43-101 / JORC / SK-1300 / SAMREC
- The national codes that govern how a Mineral Resource or Reserve may be publicly reported once confirmatory drilling exists.
Frequently asked questions
Can satellite gold exploration in Zimbabwe really replace drilling?
No — and it is not meant to. Satellite analysis is a targeting and prioritisation layer. It tells you which parts of a concession are prospective and in what order to drill them, so that expensive ground validation is aimed where multiple independent signals already agree. Drilling remains the step that converts a satellite exploration target into a defined resource.
How accurate are the contained-gold figures?
They are satellite-derived exploration-target estimates, modelled from grade and tonnage per pixel and cross-checked against six independent risk filters. In this project the figures split into 2 high-confidence and 6 medium-confidence zones, with every scoping item disclosed. They are not a Mineral Resource under JORC, NI 43-101 or SAMREC — confirmatory drilling is required before any such classification.
Which satellites and data go into the analysis?
More than 21 layers, including Sentinel-2 multispectral, ASTER short-wave infrared, Sentinel-1 and PALSAR-2 radar, MODIS/ASTER thermal, EMAG-2 magnetics and a high-resolution DEM. These are fused into a single Gold Prospectivity Index at 10-metre resolution, then filtered through a conservative cascade that removes false positives.
How long does a report take, and what do I need to provide?
Typically 5–20 business days. You provide the area of interest (coordinates, KML/KMZ or polygon), the country/region, and the target mineral(s). We handle data-source selection, acquisition, analysis and delivery of a georeferenced PDF plus GIS files.
Does this work for minerals other than gold?
Yes. The same multi-sensor fusion approach detects copper, cobalt, nickel, lithium, uranium, rare earth elements, and specialty minerals such as tantalum and diamonds. Farmonaut has applied it across 20+ mineral types in 25+ countries.
Is the exploration phase environmentally invasive?
No. The entire satellite targeting workflow involves zero ground disturbance — no trenching, roads or drill pads. Field impact is deferred until a small, focused validation program is justified, which aligns exploration with modern ESG expectations.
What happens after the satellite report?
The recommended path is: satellite targeting → confirmatory Phase-1 drilling (0–6 months) → resource definition with an NI 43-101 / SK-1300 estimate (7–12 months) → pre-feasibility and permitting (13–24 months). The satellite deliverable front-loads and de-risks the earliest, most uncertain stage of that journey.
All project-specific figures in this article are reported from a delivered Farmonaut satellite analysis; the concession identity, coordinates and precise location have been redacted at the client’s request. Conceptual mining-study figures are satellite-derived exploration-target estimates only and are not a Mineral Resource or Reserve under any reporting code.
Discussion
Questions, corrections or field experience? Share them below. First-time comments are reviewed before they appear, and your email is never published.
No comments yet. Be the first to add a question or your experience.

 Comfix & Engineering Limited
 Congo Mining Solutions
 Mining SARL
 SenGold Invest SAS
 Sania Corporation
 Sean Mining Limited
 NTS Group (Pty) Ltd
 Mine4Africa
 Lithspo Minerals Limited
 Tintina Mining Group
 Dalgety Minerals Pty Ltd
 Vortex Minerals Pty Ltd
 Faith At Work (Pty) Ltd
 Geotech Mining Solutions plc
 Vulcan International Limited
 Kidepo Associates
 GKY Mining
 Alkimy SARL
 Double A Trading
 GemSprout Metals Limited
 Qader Group
