

Client case study · Platinum group metals · Somalia
How Makhir Mining Narrowed 100 Hectares to 16 Platinum Targets in Somalia
Makhir Mining used satellite platinum exploration in Somalia to narrow a 99.5-hectare licence to 16 platinum-group target zones covering about 8% of the land. The company then drilled, ran laboratory tests and reports finding mineralisation, saving 3 to 6 months and up to US$25,000.
Key takeaways
- Makhir Mining, a mining company in northern Somalia, narrowed its 99.5-hectare licence to 16 platinum-group target zones covering 8.35 ha, about 8% of the land.
- Five priority zones hold about 65% of the report’s estimated metal, and Zone 3 alone runs for about 714 m along strike.
- The report gives an exploration target of about 210,000 tonnes at estimated 4E grades of 1.78 to 2.15 g/t, from about 30 m to no deeper than about 101 m below surface.
- Makhir Mining then drilled, ran laboratory tests and reports finding mineralisation.
- The client reports saving 3 to 6 months and up to US$25,000. These are the client’s own estimates.
In this article
- Who Makhir Mining is and what the project set out to answer
- Why a platinum project in Somalia needs a clear starting point
- How satellite platinum exploration in Somalia worked on this project
- What the report found across the 99.5 hectares
- Depth, continuity and confidence: why these targets suit a first programme
- The drill plan: near-vertical holes and a two-phase programme
- Drilled, lab-tested and mineralisation found: the results Makhir Mining reports
- What other platinum explorers can learn from this case
- Satellite platinum exploration Somalia: frequently asked questions
Who Makhir Mining is and what the project set out to answer
Makhir Mining is a mining company in northern Somalia and a Farmonaut client. The company came to us in April 2026 with a licence area of 99.5 hectares, about one square kilometre of ground, and a clear goal: find out where platinum-group metals were most likely to sit on that land, and decide where to put the first holes.
Platinum-group metals, often shortened to PGMs, are a family of six rare metals: platinum, palladium, rhodium, ruthenium, iridium and osmium. They are some of the most valuable metals mined anywhere. The US Geological Survey lists their uses, which include catalytic converters that clean car exhaust, catalysts for chemical plants and oil refineries, electronics, medical devices, glass making and jewellery.
The company’s approach is the one a careful explorer takes. It started with a satellite study of the whole licence, used the ranked targets to choose where to test, and then took those targets into the field. In October 2026 the company told us it was working at the first target point from the satellite map, and that the results would guide its next steps. By November it had drilled, sent samples to a laboratory and reported finding mineralisation.
Many early-stage projects stop at the target map. Makhir Mining followed its map to the drill and the laboratory, which is exactly the path a satellite target is meant to start. This case study shows how satellite platinum exploration in Somalia produced those targets and what the company did with them.
The project used our satellite-based mineral detection service at the Premium level. The report gave Makhir Mining mapped target zones, depth estimates, a quantity estimate, structural confidence scores and a recommended drilling direction, angle and depth for every zone. It was delivered in April 2026.
Why a platinum project in Somalia needs a clear starting point
Somalia has real geological promise for platinum-group metals. A US Geological Survey evaluation of Somalia’s mineral potential lists platinum-bearing mafic and ultramafic complexes among the deposit types worth exploring in the country’s ancient Precambrian rocks. The same report says the mafic and ultramafic rocks of parts of northern Somalia are good targets for nickel, chromium and platinum-group metals, and should be mapped and sampled.
What the country lacks is modern public exploration data. The USGS notes that mineral production made up only a minor part of Somalia’s economy in 2019. A company working its own licence usually starts without detailed geological maps, earlier drilling or a grid of soil samples to build on.
Platinum adds a second challenge. The metals themselves sit in tiny grains, far too small and too scarce for any satellite to see. Explorers look instead for the rocks that host them. Most of the world’s platinum comes from a few large layered intrusions, such as the Bushveld Complex in South Africa, where the metals are concentrated in thin, continuous layers called reefs. Finding the right host rock, and the right layer within it, is the heart of platinum exploration.
The usual ways of doing that all take time and money before the first hole goes in:
- Geological mapping: skilled people walk the ground and record the rocks, which takes many days on a licence of this size.
- Rock and soil sampling: sampling gives chemical results, but each sample needs collecting, transport and laboratory fees.
- Ground geophysics: magnetic and gravity surveys can see dense ultramafic rock below the surface, but they need specialist crews on site.
- Drilling on instinct: the fastest way to an answer, and the most expensive way to a wrong one.
Satellite analysis sits in front of all of these. Its job is to rank the ground, so the mapping, the sampling and the drill rig all start in the same place. For Makhir Mining, that meant field work could focus on about 8 hectares instead of 100.
How satellite platinum exploration in Somalia worked on this project
The client’s part was simple. Makhir Mining sent the boundary of its licence and named platinum as the target. No one needed to visit the site for this stage, and no ground was disturbed.
Infographic
How the project moved from a boundary to drilled targets
- 1Send the boundaryMakhir Mining sent the outline of its 99.5-hectare licence and named platinum.
- 2Hunt the host rockOptical, radar, thermal and terrain data from 2020 to 2025 mapped mafic rock, chromite and structure.
- 3Rank the targets16 reef-style zones were mapped with depth, grade, continuity and confidence.
- 4Plan the drillingEvery zone received a direction, an 85° angle, a hole depth and a hole count.
- 5Drill and testMakhir Mining drilled, ran laboratory tests and reports finding mineralisation.
The analysis was built on what we call hunting the host, not the metal. Instead of looking for platinum grains, it looks for the rocks, minerals and structures that platinum deposits are found in. To do that, it combined several kinds of satellite data covering 2020 to 2025:
- Landsat 8, Landsat 9 and Sentinel-2: optical images from the Landsat and Sentinel-2 missions, combined into one set of six colour bands from blue to shortwave infrared. Only images with less than 30% cloud were used, grouped into dry-season and wet-season views.
- Sentinel-1 radar: Sentinel-1 sees through cloud and maps the texture of the ground, which helps trace faults and fractures.
- ASTER thermal data: the ASTER Global Emissivity Dataset adds surface temperature and emissivity at 100 metres. Dense mafic and ultramafic rocks hold and release heat differently from the rocks around them.
- SRTM elevation: the Shuttle Radar Topography Mission supplies 30-metre elevation, slope and roughness.
From that data the analysis measured the signs that platinum-bearing rocks leave at the surface:
- Mafic and ultramafic rock: iron- and magnesium-rich rocks such as pyroxenite and dunite, the usual hosts of platinum reefs.
- Chromite: dark, dense layers rich in chromium, which often travel with platinum in layered intrusions.
- Serpentinite: altered ultramafic rock with a clear absorption in the shortwave infrared.
- Magnetite and ferrous iron: iron minerals that mark fresh mafic rock and magnetite-rich layers.
- Serpentine barrens: patches of thin, stressed plant cover, because soils over ultramafic rock are rich in nickel and chromium and poor for most plants.
- Structure: faults, fractures and lineaments from radar and terrain, which control where reefs are offset or exposed.
These signs were combined into one map, the PGE Potential Index. Signals that overlap were capped, so that one kind of evidence could not dominate. A place scores higher when several independent signs agree and when the signal holds steady across seasons and years.

▶ How mineral exploration from space helps you stop drilling blind. · 4:26
What the report found across the 99.5 hectares
The analysis found 16 target zones inside the licence. Together they cover 8.35 hectares, about 8% of the land checked. For planning, that means the first field work could focus on less than one hectare in every ten.
Chart
Target zones cover about 8% of the land checked
Hectares, across the 99.5-hectare licence
The report classifies all 16 zones as reef-style targets of the kind found in layered intrusions, the same family as the Merensky Reef of South Africa. It estimates an average reef thickness of about 1 metre, consistent across the zones. That consistency is what you would expect from a reef that formed as one layer across an intrusion.
Here is how the zones compare. We use the zone numbers from the report so the figures can be matched to the drill plan later in this article.
| Target zone | Strike length | Estimated depth | Estimated grade (4E) | Share of modelled 4E metal |
|---|---|---|---|---|
| Zone 3 | 714 m | 42–101 m | 1.80 g/t | 26.7% |
| Zone 2 | 448 m | 50–98 m | 1.78 g/t | 14.7% |
| Zone 6 | 267 m | 40–82 m | 1.79 g/t | 9.2% |
| Zone 11 | 307 m | 33–72 m | 1.86 g/t | 7.3% |
| Zone 16 | 208 m | 49–88 m | 1.82 g/t | 7.0% |
| Zone 14 | 178 m | 53–90 m | 1.78 g/t | 6.6% |
| Zone 9 | 184 m | 46–81 m | 1.85 g/t | 5.1% |
| Other 9 zones | 59–156 m each | 30–79 m | 1.78–2.15 g/t | 23.5% |
| All 16 zones | 30–101 m | 1.84 g/t average | 100% |
Source: Farmonaut detection report for Makhir Mining, April 2026. 4E means platinum, palladium, rhodium and gold combined. Grades are diluted estimates and shares are rounded.
The table shows a clear order of work. Zone 3 is the flagship target. It runs for about 714 metres along strike and holds about 27% of the metal estimated in the whole licence. The five largest zones, Zones 3, 2, 6, 11 and 16, hold about 65% between them.
Chart
Five zones hold about 65% of the estimated metal
Share of the report’s central 4E estimate, %
Grades are also very even. The report estimates 1.78 to 2.15 grams per tonne of 4E metals across all 16 zones, with a weighted average of about 1.84 g/t. Grams per tonne, written g/t, tells you how much metal is estimated in each tonne of rock. Four smaller zones, Zones 12, 13, 1 and 4, sit at the top of that band, above 2.1 g/t, which makes them good follow-up targets.
Across all 16 zones, the report estimates about 210,000 tonnes of target rock. Its central estimate of contained 4E metal is about 386 kg, or about 12,400 troy ounces. Not all metal in the ground is recovered in a plant, so the report also tests three recovery cases. Those give a band of about 285 to 327 kg of recoverable 4E metal.
If you want to run the same arithmetic on a target of your own, the calculator below turns tonnage and grade into contained metal and a gross value. Gross value is metal multiplied by price, before any mining or processing cost, so it is a way to compare targets, not a forecast of profit.
Calculator
What is a platinum-group target worth on paper?
Enter your own target. All amounts are in US dollars.
- Contained 4E metal (kg): 200.0
- Contained 4E metal (troy oz): 6,430
- Value after recovery (US$): $6,172,939
Example values only, not a benchmark, and not related to this project. 1 troy ounce is 31.1035 g. The basket price is an example for a 4E mix of platinum, palladium, rhodium and gold, so check today’s prices. Gross value is before mining and processing costs.
Depth, continuity and confidence: why these targets suit a first programme
A target is only useful if a project can reach it and trust it. The report checks each zone for how deep it sits, how continuous it is and how well it is supported by structure.
Depth first. The zones are estimated to start between about 30 and 53 metres below surface and to reach no deeper than about 101 metres. That is well within reach of standard exploration drilling, so a first programme can test the full estimated depth of every zone.
Chart
Estimated depth of the leading zones
Metres below surface, top to base of each zone
Continuity matters most for a reef. A platinum reef is valuable because it runs as one layer over a long distance. The report gives each zone a continuity index from 0 to 100, and four zones score the maximum of 100: Zones 2, 3, 6 and 11. These are also four of the five longest zones, which makes them natural first targets for drilling along strike.
Confidence is strong across the board. The report’s structural confidence score combines the number of mapped lineaments, how continuous the zone is and the density of faults seen in radar. Every one of the 16 zones scores above the high-confidence threshold of 100, with scores from about 103 to 123. Zone 11 has the highest score, and Zone 3 has the best mix of grade, size and continuity.
Access is good too. The report rates terrain access as high for all 16 zones, which makes it easier to plan how a rig and a field crew would reach each site.
What Makhir Mining received went beyond the PDF. The data pack included a GeoTIFF map of platinum potential across the whole licence, GeoJSON outlines of every zone, a data dictionary and a coordinate table with a map link for every corner of every zone. A geologist can open these in standard mapping software and use them to place drill collars.
The drill plan: near-vertical holes and a two-phase programme
A map of targets tells a company where to look. The drill plan tells it how to test them. For every one of the 16 zones, the report gives a direction, an angle, a hole depth, a hole spacing and an estimated number of holes.
Reef-style targets call for a different geometry from gold veins. A gold vein usually stands steeply, so holes are angled to cut across it. A platinum reef usually lies close to flat, so the best way to cross it is almost straight down. The report recommends diamond core holes at 85 degrees, pointed across the trend of each zone, so each hole cuts the reef cleanly and gives a true thickness.
| Target zone | Direction | Angle | Suggested hole depth | Strike length | Estimated holes |
|---|---|---|---|---|---|
| Zone 3 | 157° | 85° | 129 m | 714 m | 14 |
| Zone 2 | 160° | 85° | 125 m | 448 m | 9 |
| Zone 11 | 160° | 85° | 92 m | 307 m | 6 |
| Zone 6 | 153° | 85° | 105 m | 267 m | 5 |
| Zone 16 | 151° | 85° | 112 m | 208 m | 4 |
| Zone 9 | 162° | 85° | 103 m | 184 m | 4 |
| Zone 14 | 157° | 85° | 115 m | 178 m | 4 |
| Other 9 zones | 152–169° | 85° | 75–101 m | 59–156 m each | 20 |
| Total | 66 |
Source: Farmonaut detection report for Makhir Mining, April 2026. Directions and depths are rounded. A geologist and drilling contractor confirm the final plan on site.
Chart
Suggested drill holes by target zone
Estimated number of holes, 66 in total across 16 zones
The report then sets out a phased programme, the normal way to explore a property like this:
- Phase 1, priority targets: drill Zones 3, 2, 6, 11 and 16, which hold about 65% of the estimated metal. The report suggests 25 to 35 holes and about 2,500 to 3,500 metres of drilling, with collars 50 to 100 metres apart along strike. The aim is to confirm grade and continuity and collect samples for metallurgical tests.
- Phase 2, step-out and infill: extend drilling to the other 11 zones, step out beyond the mapped outlines to test how far the reef runs, and drill more closely in the higher-grade zones. The report suggests 30 to 45 more holes and about 3,000 to 5,000 metres.
Makhir Mining took the first step. The company told us it began at the first target point on the satellite map, and its feedback form confirms that the ground has been drilled and that samples have been tested in a laboratory. The targets did their job: they gave the company a clear place to start.
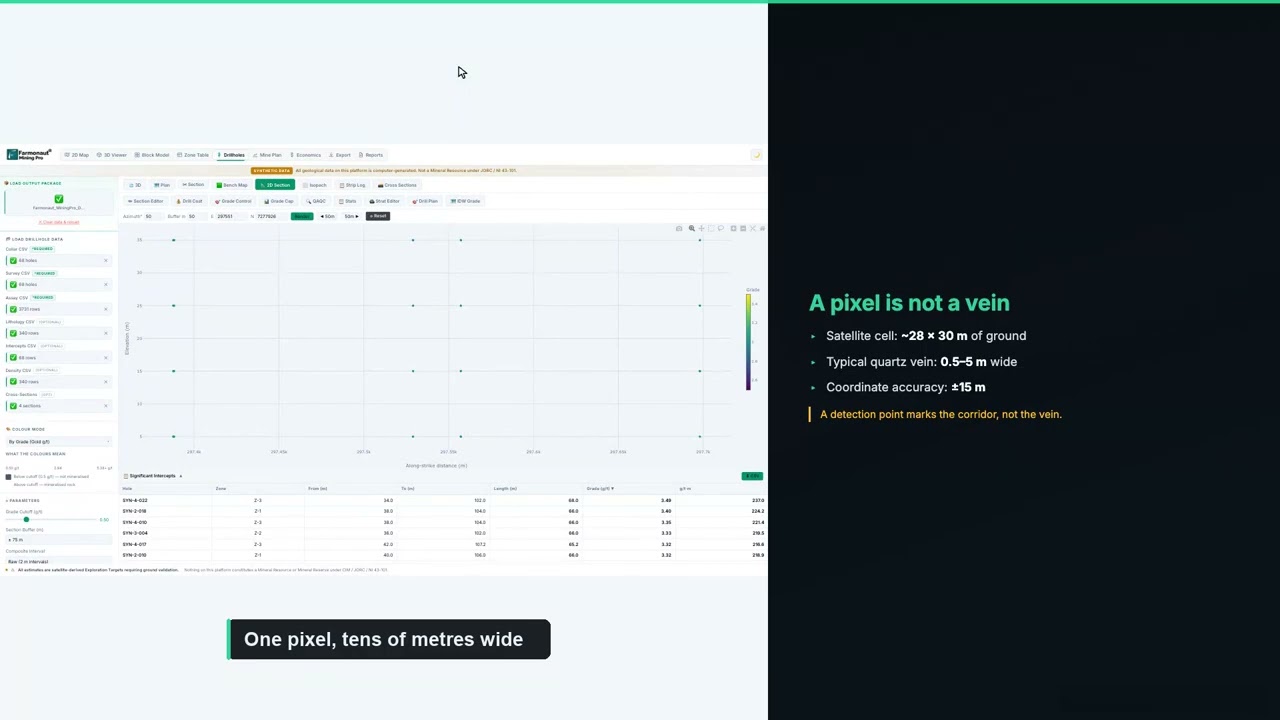
▶ How to plan a drilling programme once you have targets. · 5:49
If you are budgeting a similar programme, enter your own contractor’s rates below. The default values are round examples, not typical prices, because costs vary widely with location, rock type and rig availability.
Calculator
What would a first drill programme cost?
Enter your contractor’s quote. All amounts are in US dollars.
- Total metres: 3,300
- Cost per hole (US$): $16,283
Example values only, not typical prices. Costs vary with location, rock type and rig availability, so use real quotes from your contractor and laboratory.
Drilled, lab-tested and mineralisation found: the results Makhir Mining reports
Makhir Mining completed our client feedback form in November 2026. Here is what the form records, in the company’s own selections:
- Narrowed locations: yes. The analysis helped narrow down where to look.
- Time: yes, it reduced time, with savings in the band of 3 to 6 months.
- Cost: yes, it reduced cost, with savings in the band of up to US$25,000.
- Drilling: yes, the ground has been drilled.
- Laboratory testing: yes, samples have been tested.
- Mineralisation: yes, mineralisation was found.
- Case study: yes, the company agreed to be featured.
That is the full path from a satellite map to physical evidence. The report said where to look. The company went there, drilled, sent samples to a laboratory and reports finding mineralisation. For anyone asking whether satellite targets lead anywhere real, this is the kind of answer that counts.
The time saving stands out. Three to six months is a large share of a field season, and on a frontier project it can be the difference between drilling this year and drilling next year. Time is saved because the slow job of mapping and sampling all 99.5 hectares is replaced by a short, ranked list of places to check.
The cost saving follows the same logic. People, vehicles and the drill rig go to about 8% of the land first, and holes go where the data points rather than where someone guesses. On a licence of this size, savings of up to US$25,000 can pay for a meaningful part of the next round of drilling and assays.
The company has also become an advocate for the approach. Its principal joined the Farmonaut mining affiliate programme and has since brought us enquiries from other explorers in the region who want their own ground scanned. That is perhaps the clearest sign of how the work landed: a client who brings others to the same method.
What other platinum explorers can learn from this case
Several parts of this project would work on other platinum-group metal licences, in Somalia or anywhere with little earlier exploration.
- Hunt the host rock: platinum grains cannot be seen from space, but mafic and ultramafic rocks, chromite and serpentinite can. Target those first.
- Map the whole licence at once: one study of all 99.5 hectares ranked every zone against every other, so the order of work was clear from day one.
- Let continuity lead: reefs pay because they run. Zones with long strike and full continuity, such as Zone 3, deserve the first holes.
- Drill the right geometry: flat-lying reefs are best crossed by near-vertical holes, so ask for the angle as well as the location.
- Use the data files in the field: zone outlines and corner coordinates on a GPS make it easy for crews to find each target.
- Follow through to the laboratory: Makhir Mining drilled and tested, which is the step that turns a satellite target into evidence.
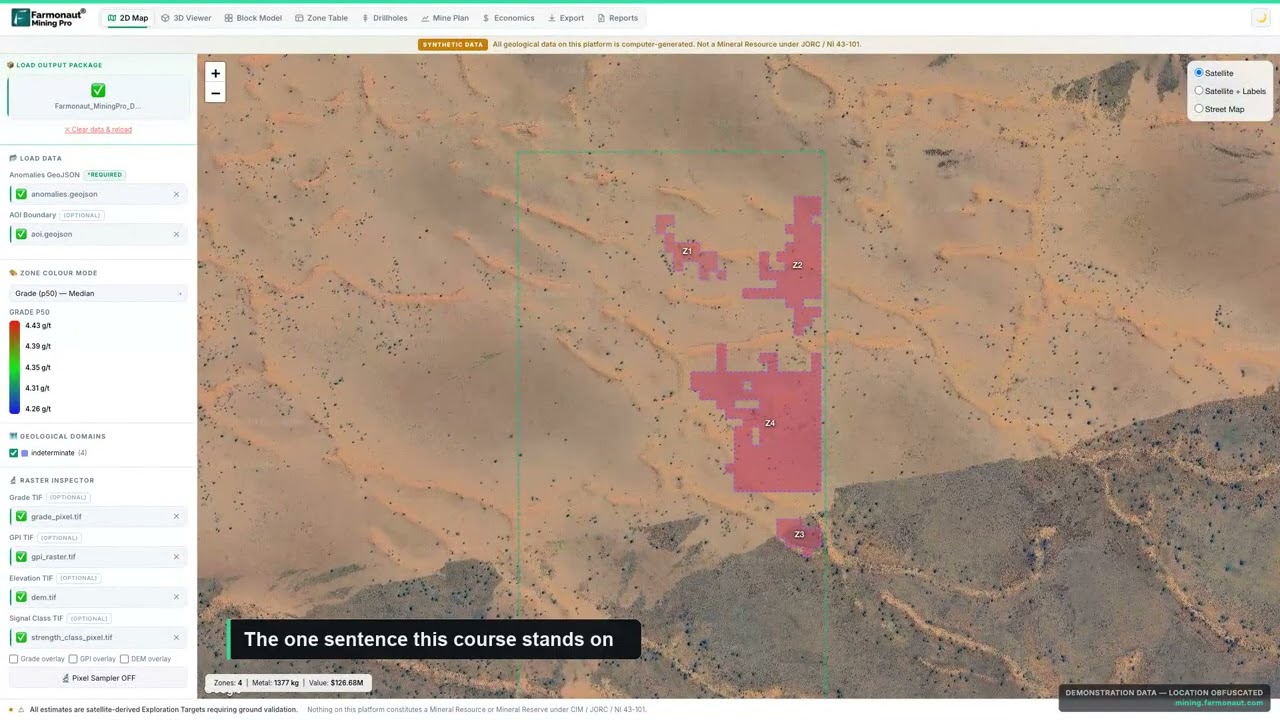
▶ What an exploration target is, and how it differs from a resource. · 4:14
Getting a similar study for your own ground follows the same steps. Send your boundary as coordinates, a KML or KMZ file, or a polygon, and name your target mineral. Delivery usually takes 5 to 20 business days, depending on the size of the area and the mineral. You can map your mining site yourself or get a quote from our team.
Want to see the same approach on other ground? Read how another Somali client took gold targets to the drill in our Somalia gold case study, or see what clients report after satellite exploration across all our projects.
Satellite platinum exploration Somalia: frequently asked questions
What did satellite platinum exploration find on Makhir Mining’s licence in Somalia?
It found 16 platinum-group target zones across 99.5 hectares, covering 8.35 hectares in total, about 8% of the land. Five zones hold about 65% of the metal estimated in the report. Makhir Mining then drilled, ran laboratory tests and reports finding mineralisation.
Who is Makhir Mining?
Makhir Mining is a mining company working in northern Somalia. It used a Farmonaut satellite study to target platinum-group metals on a 99.5-hectare licence, drilled the targets, ran laboratory tests and reports finding mineralisation. Its principal is also a Farmonaut mining affiliate partner.
How much time and money did the client save?
Makhir Mining reported saving 3 to 6 months and up to US$25,000 on our feedback form. These are the client’s own estimates for this project.
Can a satellite detect platinum directly?
No. Platinum grains are microscopic. Satellites detect the rocks and minerals that host platinum, such as mafic and ultramafic rock, chromite and serpentinite, along with faults and fractures. The analysis combines those signs to rank where platinum is more likely, and drilling and assays confirm it.
What does 4E mean?
4E is the combined grade of four precious metals: platinum, palladium, rhodium and gold. It is the usual way platinum-group projects report grade, in grams per tonne.
Is this a JORC or NI 43-101 resource?
No. The report gives an exploration target, which comes before a resource estimate. A resource under JORC or CIM definition standards needs closely spaced drilling, assays and a qualified person’s work.
How deep are the platinum targets?
The report estimates that the zones start between about 30 and 53 metres below surface and reach no deeper than about 101 metres. The suggested holes are 75 to 129 metres long.
Why are the suggested drill holes almost vertical?
Platinum reefs usually lie close to flat. A near-vertical hole, at 85 degrees, crosses a flat reef cleanly and gives its true thickness. Steep gold veins, by contrast, are usually drilled at a lower angle.
Which satellites were used?
The report used Landsat 8, Landsat 9 and Sentinel-2 optical images, Sentinel-1 radar, ASTER thermal data and the SRTM elevation model, covering 2020 to 2025.
How long does a satellite platinum report take?
Delivery usually takes 5 to 20 business days, depending on the size of the area and the mineral.
What do I need to send to get a report for my own land?
Send your boundary as coordinates, a KML or KMZ file, or a polygon, along with the country and your target mineral. Our team checks the boundary with you before the work starts.
Published with the client’s consent. All resource figures are satellite-based exploration targets and are not Mineral Resources or Ore Reserves under JORC, NI 43-101 or similar codes. Drilling, laboratory testing and the finding of mineralisation are reported by the client; assay results were not shared with us, and no grade from them is stated here. Time and cost savings are client-reported bands. Makhir Mining’s principal is also a Farmonaut mining affiliate partner and can earn commission on projects referred to us. Nothing here is investment advice. The exact location is withheld.
Farmonaut mineral detection
Map your mining site from space
Send your claim or licence boundary as KML, KMZ or a polygon. Farmonaut returns ranked satellite exploration targets for it, usually in 5 to 20 business days.

Keep reading
Sources
- US Geological Survey, A preliminary evaluation of the nonfuel mineral potential of Somalia, Open-File Report 82-788 (1982): pubs.usgs.gov
- US Geological Survey, Minerals Yearbook: Somalia (2019): pubs.usgs.gov
- US Geological Survey, Mineral Commodity Summaries: Platinum-group metals (2025): pubs.usgs.gov
- US Geological Survey, Critical Mineral Resources of the United States, Chapter N: Platinum-group elements (2017): pubs.usgs.gov
- US Geological Survey, Platinum-group elements in southern Africa: mineral inventory and assessment (2010): pubs.usgs.gov
- USGS, Landsat 8 mission: usgs.gov
- USGS, Landsat 9 mission: usgs.gov
- Copernicus SentiWiki, Sentinel-2 mission: sentiwiki.copernicus.eu
- Copernicus SentiWiki, Sentinel-1 mission: sentiwiki.copernicus.eu
- NASA LP DAAC, ASTER Global Emissivity Dataset 100 m (AG100 v003): lpdaac.usgs.gov
- USGS EROS, Shuttle Radar Topography Mission (SRTM) 1 arc-second: usgs.gov
- JORC, Australasian Code for Reporting of Exploration Results, Mineral Resources and Ore Reserves (2012): jorc.org
- CIM, Definition Standards for Mineral Resources and Mineral Reserves: cim.org
Discussion
Questions, corrections or field experience? Share them below. First-time comments are reviewed before they appear, and your email is never published.
No comments yet. Be the first to add a question or your experience.

 Southbridge & Wess PDC Ltd
 Qader Group
 Ileys General Trading
 SG Gold Mining LLC
 VRV Global Pte Ltd
 Omsri International FZE
 G.I.T.T.
 Jaunita Erss Ltd
 Almosi SARL
 SRK Consulting
 Berks Gold Limited
 Mwerezi Minerals Company Limited
 Mining SARL
 SenGold Invest SAS
 Sean Mining Limited
 NTS Group (Pty) Ltd
 Mine4Africa
 Lithspo Minerals Limited

 Client · Oregon, USA · Gold










