

Satellite exploration · Buyer guide
Satellite Underground Scanning: How Deep Can It See?
No ground penetrating satellite sees an orebody at depth: radar from Earth orbit reaches about 5 m in dry sand (ESA). Satellites read surface minerals, structures and ground movement, which point to where to drill.
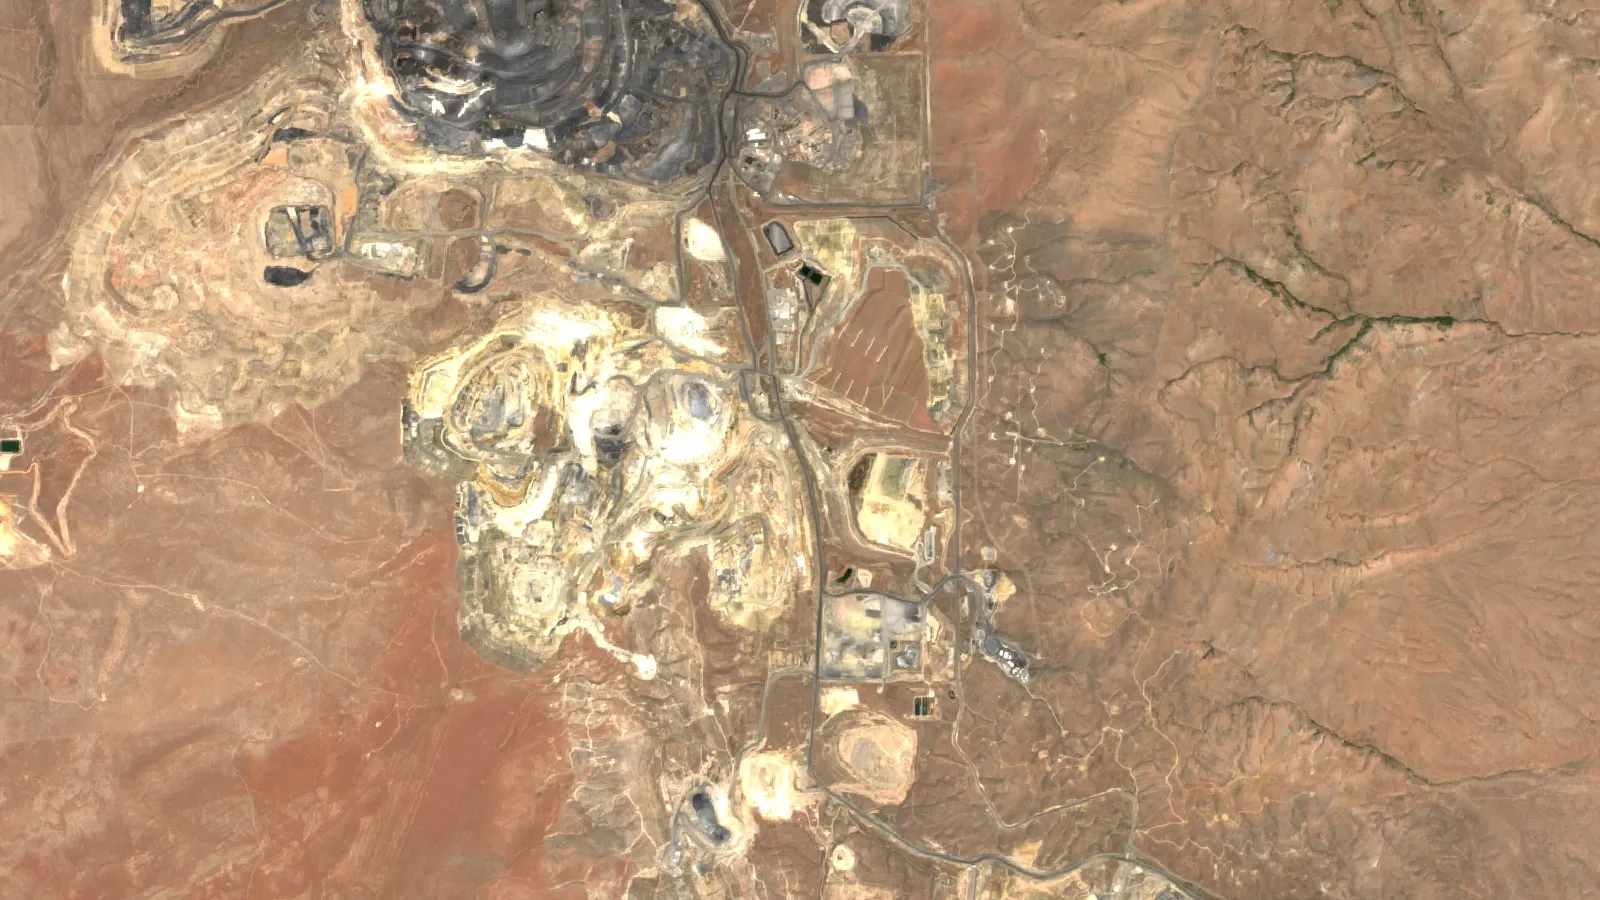
Key takeaways
- ESA says the P-band radar on Biomass can penetrate dry sand by as much as five metres; Earth-orbiting radar is not built for exploration depth.
- NASA’s Shallow Radar at Mars looks up to about 1 km down; no such satellite exists for Earth.
- Ground penetrating radar on the ground reached from a few feet to over 50 feet in a USGS Florida study, and clay cut the depth.
- Satellite gravity (GOCE) works at scales near 100 km and the EMAG2v3 magnetic grid has 2 arc-minute cells (about 3.7 km), so both are regional tools.
- Sentinel-2 samples 13 bands at 10 to 60 m and EMIT records 285 bands; they map surface alteration, not metal or grade.
In this article
- Satellite underground scanning: what a ground penetrating satellite can and cannot see
- Is there a ground penetrating satellite for gold exploration?
- How deep can radar from space go on Earth
- Subsurface mineral exploration by satellite: reading the surface clues
- What satellites read below the surface: gravity and magnetics
- Satellite scanning of mines: ground movement, not what is underneath
- From satellite screen to drill hole: a workflow that holds up
- How to test a vendor's underground scanning claim
- What it costs to test your ground by drilling, and why screening comes first
- Water and soil moisture are a different question
- Frequently asked questions
Satellite underground scanning: what a ground penetrating satellite can and cannot see
No satellite in orbit around Earth can scan a gold deposit hundreds of metres underground. The deepest figure given for an Earth-orbiting satellite radar is as much as five metres through dry sand, according to the European Space Agency for its P-band Biomass radar. A ground penetrating satellite in the true sense, a radar sounder that sees about a kilometre down, flies only around other worlds such as Mars. What satellite underground scanning does well on Earth is read the surface: rock colour, clay and iron minerals, faults, ground movement and regional gravity and magnetic trends. Those clues tell a licence owner where to send a geologist and where to drill.
This guide explains what each family of sensors can reach, with depths and pixel sizes from the agencies that run them. It shows the difference between a satellite screen and ground-based radar, gives a checklist for testing any vendor’s claim, and ends with a calculator that shows what drilling your own ground on a grid would cost. It is written for licence and claim owners, consultants and investors who keep meeting the phrase “satellite underground scanning” in sales material and want to know what is behind it.
Search terms for this topic overlap, so here is what each one usually means. “Ground penetrating radar satellite” and “ground penetrating satellite” ask whether radar from orbit can see below the soil. “Subsurface mineral exploration satellite” asks how orbital data helps find ore. “Satellite scanner for gold” asks whether a satellite can find gold. The answers follow in that order.
Is there a ground penetrating satellite for gold exploration?
Not for gold at depth. Ground penetrating radar (GPR) is a method in which an antenna sends short radio pulses into the ground and records the echoes from layers and objects below. On Earth it is a ground-based tool: a cart, a drone or a vehicle moves over the surface. Satellites carry radar too, but the signal has to cross hundreds of kilometres of space and back, and it loses most of its strength in damp soil, so only very dry ground lets it through.
The clearest orbital examples are on another planet. NASA’s Shallow Radar on the Mars Reconnaissance Orbiter looks for liquid or frozen water in the first few hundred feet, up to about one kilometre, of the Martian crust (NASA). Mars is dry and cold, and ice is a good target for radar, so the signal travels deep. Earth has wet soil, vegetation and groundwater, which stop most of it.
On Earth, orbital radar has reached below the surface in one setting: hyperarid desert. The shuttle imaging radar flown on Columbia in November 1981 penetrated the extremely dry Selima Sand Sheet, dunes and drift sand of the eastern Sahara and showed buried valleys, structures and possible Stone Age occupation sites. The USGS paper describes radar returns from bedrock and gravel beneath windblown sand that is several centimetres to possibly metres thick (USGS, 1982). Gold deposits sit under wet soil, forest, weathered rock and cover far thicker than a few metres, so that result does not transfer to most exploration ground.
How deep can radar from space go on Earth
Depth depends on two things: the wavelength of the radar and how wet or conductive the ground is. Long wavelengths go deeper. ESA’s Biomass satellite is the first to carry a P-band radar, with a wavelength of around 70 cm, and ESA states that the signal can penetrate dry sand by as much as five metres, which it plans to use for mapping buried desert features such as ancient riverbeds and lakes (ESA). Biomass was built mainly to measure forest carbon, not minerals.
Chart
Reported radar depth: satellite design figure vs ground radar
metres; Biomass is a design figure for dry sand, ground radar is a Florida study (more than 50 ft)
Ground-based radar does better, but it also has hard limits. A USGS study of karst terrain in west-central Florida found effective GPR depths in sand and clay ranged from a few feet to more than 50 feet (about 15 metres), with the shallow results where high-conductivity clay was present and the deeper ones in sand (Barr, USGS, 1993). The chart shows the two figures side by side. Both are small next to the depth of an orebody.
The table below compares every sensor family that is sold as “underground scanning” and states what each one actually measures.
| Method | Platform | What it measures | Depth or scale (source) | Role in gold exploration |
|---|---|---|---|---|
| Multispectral optical | Sentinel-2, ASTER | Sunlight reflected by the surface | Surface only; 13 bands at 10 to 60 m for Sentinel-2 (ESA); ASTER shortwave bands at 30 m (NASA) | Maps iron stain, clay and alteration zones |
| Hyperspectral optical | EMIT and other imaging spectrometers | 285 narrow bands from 381 to 2,493 nm | Surface only (NASA Earthdata) | Separates individual clay and mica minerals |
| Long-wavelength radar | Biomass (P-band) | Radar echoes from ground and below | About 5 m in dry sand (ESA) | Buried geology in deserts; not for deep targets |
| Radar interferometry | Sentinel-1 (C-band) | Ground movement at the surface | Surface motion only; 12-day revisit at the Brumadinho site (Nature Communications Earth and Environment) | Monitors dams, pits and waste dumps |
| Satellite gravity | GOCE | Gravity gradients caused by density | Resolution on the order of 100 km (ESA via eoPortal) | Regional crust and basin structure |
| Satellite magnetics | EMAG2v3 grid (satellite, ship and airborne data) | Magnetic anomalies of the crust | 2 arc-minute grid, about 3.7 km (NOAA NCEI) | Regional structure and rock type |
| Ground penetrating radar | Cart, vehicle or drone | Radio echoes from layers and objects | A few feet to over 50 feet in the Florida study (USGS) | Shallow targets, cover thickness, voids |
| Drilling | Rig | Rock samples and assays | As deep as the hole | The only direct test of grade |
The pattern is clear. Every method that reaches deep is coarse, and every method that is fine-scale is shallow. That trade-off is why exploration teams combine several data sets instead of trusting one.
Subsurface mineral exploration by satellite: reading the surface clues
If a satellite cannot see the ore, why does it help? Because many gold systems leave a footprint on the surface. Hot, mineral-rich water that moves through rock changes it, and the altered rock has a different colour and chemistry from the rock around it. The shortwave infrared part of the spectrum is the best region for sensing this alteration, because hydroxyl-bearing minerals such as clays and sulphates, and carbonate minerals, have diagnostic absorption features there (Pour and Hashim, Springerplus). Rusty iron stains show up at shorter wavelengths.
Chart
Pixel size range of two multispectral sensors
metres per pixel across their bands
Chart
Spectral bands recorded by three surface sensors
number of bands; ASTER total is 3 visible, 6 shortwave and 5 thermal
That is how a satellite screen is built. It does not look through the ground. It maps the surface minerals, structures and drainage that point to a system underneath, and ranks areas by how closely they match known deposit settings. The result is a target, not a resource estimate.
The sensor you use sets how fine the map is. Sentinel-2 samples 13 spectral bands: four at 10 m, six at 20 m and three at 60 m, over a 290 km swath (ESA SentiWiki). ASTER offers up to six shortwave infrared bands at 30 m and three visible bands at 15 m (NASA LP DAAC). NASA’s EMIT imaging spectrometer records 285 bands (NASA Earthdata), which can separate minerals that look alike in a 13-band sensor. The two charts below show the difference in spectral detail and in pixel size.
Our own video on the subject answers the first question every buyer asks, which is whether a satellite sees gold itself.
▶ Can a satellite detect gold? It maps the alteration halo, not the gold itself. · 2:00
What satellites read below the surface: gravity and magnetics
Satellite gravity and magnetic data are the nearest thing to a deep scan from orbit, and they are also the coarsest. ESA’s GOCE mission was designed to measure Earth’s gravity field at spatial scales on the order of 100 km, flying at an operational altitude of 240 to 280 km (eoPortal, ESA mission page). At that scale it separates basins, thick crust and large density contrasts. It cannot resolve a vein, a shear zone a few hundred metres wide or a single licence.
The same applies to magnetics. NOAA’s EMAG2v3 grid combines satellite, ship and airborne magnetic measurements on a 2 arc-minute grid, which is about 3.7 km of latitude per cell, at 4 km above the geoid over land (NOAA NCEI). It is useful for choosing a region, not a drill collar. Detail at the licence scale comes from airborne or ground magnetic surveys flown or walked much closer to the rock.
Treat claims that a satellite has “revealed subsurface density contrasts” at property scale with caution. Ask which mission, at what grid size and at what depth, because the public data sets above cannot support property-scale detail.
▶ Remote sensing for mining in plain words: the instrument families and why agreement between them matters. · 2:01
Satellite scanning of mines: ground movement, not what is underneath
Where satellite radar is proven in mining is on the surface of the mine itself. Interferometric synthetic aperture radar (InSAR) compares radar images taken on different dates and measures how far each patch of ground has moved between them. Using Sentinel-1 C-band images with a 12-day revisit over the site, researchers measured ground surface displacements across the tailings beach behind the Brumadinho dam in Brazil over the 17 months before it failed on 25 January 2019, a collapse that released 11.7 million cubic metres of tailings. The paper notes that the dam’s other monitoring methods had not reported significant precursors (Nature Communications Earth and Environment).
The lesson for owners is narrow and useful. InSAR measures how the surface moves, which helps with tailings dams, pit walls, waste dumps and subsidence above old workings. It does not map the shape of a void or an orebody below. Sentinel-1 itself is a two-satellite constellation designed for a six-day global revisit (ESA), so the time series can be long.
From satellite screen to drill hole: a workflow that holds up
A sound programme moves from coarse to fine and spends little at each stage until the evidence builds. The order below is the one most exploration teams follow.
Infographic
Coarse to fine in four stages
- 1ScreenMap surface minerals and structures from orbit.
- 2OverlayAdd public gravity and magnetic grids.
- 3CheckSample the top targets on the ground.
- 4DrillTest the best ranked targets.
- Define the boundary. Load the licence or claim outline as a polygon, and add a buffer to see the setting around it.
- Screen from orbit. Map iron oxide, clay and mica zones, silica, faults and drainage from multispectral or hyperspectral images, and rank areas by how well they fit the deposit type you are after.
- Add regional geophysics. Overlay public gravity and magnetic grids and any government airborne surveys to place the licence in its regional structure.
- Check the ground. Walk the top targets with a geologist, collect soil and rock samples and compare them with the satellite map.
- Run ground geophysics. Non-invasive surveys such as surface resistivity, ground penetrating radar, electromagnetic conductivity and magnetometer surveys can show stratigraphy, sudden changes and buried features before any drilling (US Federal Highway Administration subsurface manual).
- Drill the best targets. Core and assays are the only direct measure of grade. See our guide to types of drilling in mineral exploration and to what a rock core sample tells you.
Farmonaut provides the satellite mineral screen: you send a KML, KMZ or polygon and receive a screen of your ground. More on the method is on our satellite-based mineral detection page. Our guide to remote sensing for mineral exploration covers the sensors in more detail, and the types of ore deposits page helps you choose which alteration pattern to look for.
The next video shows how the surface clues are used in practice.
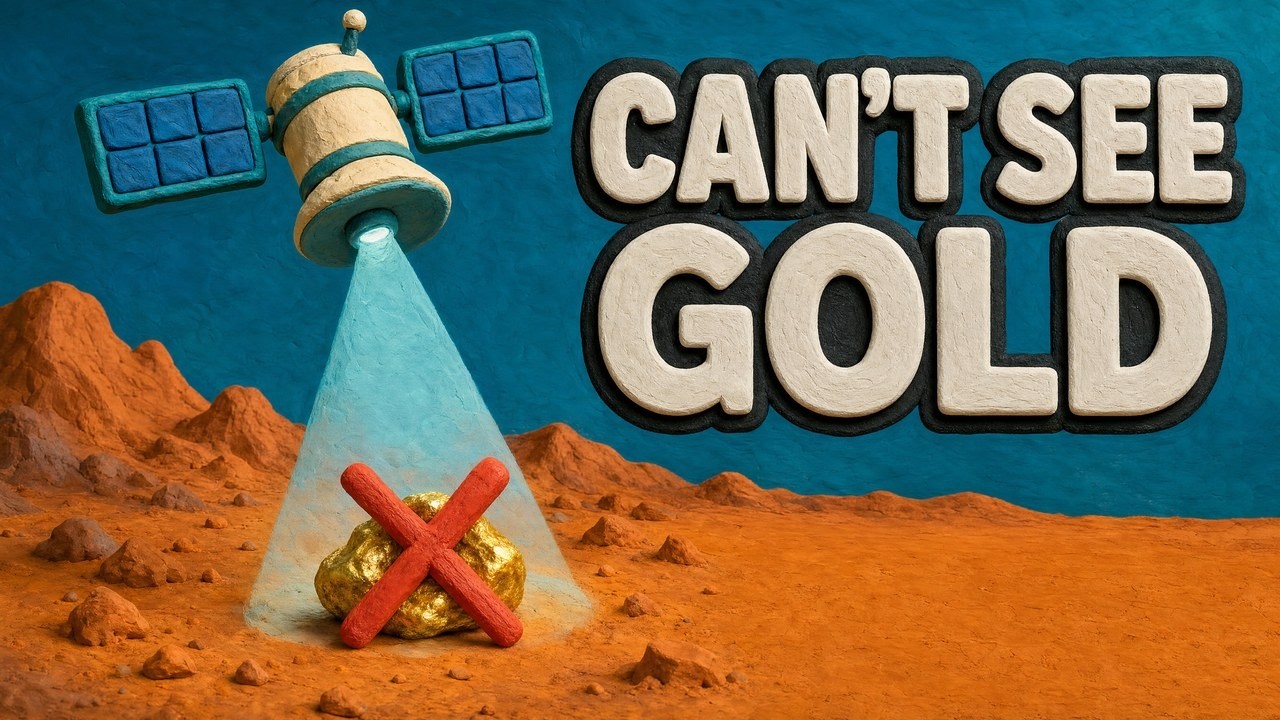
▶ How satellites help find gold: rust stains, clay minerals and faults left by hot water. · 4:25
How to test a vendor’s underground scanning claim
Marketing for satellite underground scanning often promises depth and accuracy figures that no public mission supports. Put these questions to any provider before you pay.
- Which sensor and which data? A credible answer names the mission, such as Sentinel-2, ASTER, EMIT or Sentinel-1, and the pixel size.
- What depth does the result describe? Optical and hyperspectral data describe the surface only. A claim of detection at 50 to 500 m needs a named method and a validation hole, not a satellite alone.
- How was accuracy measured? An “85% accuracy” figure means nothing unless it states what was tested, on which ground and against which drill results.
- Is the output a target or a resource? Satellite results are exploration targets. They are not a JORC or NI 43-101 resource and should never be presented as one.
- What happens next? A good report ends with a list of ground checks, not a promise.
- What does the report not cover? A screen is not an environmental, social or land-tenure clearance.
The same test applies to claims of treasure hunting from orbit. A satellite cannot find buried coins, caches or single objects. The SIR-A result above was about valleys and possible occupation areas under dry sand, at the scale of landforms.
What it costs to test your ground by drilling, and why screening comes first
Satellite screening is a cheap way to decide where not to drill. The calculator below shows the other side of the ledger: how many holes, how many metres and how much money it takes to test a licence on a regular grid. Enter your own area, grid spacing, hole depth and cost per metre. The default cost is an example, not a price list; use a quote from your drilling contractor.
Chart
Metres drilled to test 1,000 ha on a regular grid
hole depth 200 m; spacing between holes in metres
The chart that follows uses the same arithmetic on a 1,000-hectare block with 200 m holes. Halving the grid spacing multiplies the number of holes by four, and the metres drilled with it. A screen helps because it lets you drill the ranked targets at close spacing and leave low-ranked ground at wide spacing or untested. For what drilling programmes can add up to, see our page on mining profitability.
Calculator
How many metres to drill my licence on a grid?
Enter your own area, spacing, hole depth and cost per metre.
- Total metres drilled: 12,500
- Drilling cost at your price (US$): $1,875,000
Example values only, not a benchmark. Cost per metre is an input: example, use today’s contractor quote in US$. The grid ignores edge effects and access.
Water and soil moisture are a different question
Some satellite products do describe moisture in the top layer of soil and changes in groundwater storage. They answer water questions, not mineral ones, and they serve a different reader; our post on agriculture and water management covers that use. For a mining licence the same radar and thermal data matter mostly for water on site: wet, clay-rich ground limits how deep ground penetrating radar can see, as the USGS Florida study found.
Frequently asked questions
Can satellites see underground?
Only a little. Optical and hyperspectral sensors see the surface. Radar can reach a few metres in very dry sand, as ESA states for Biomass, and satellite gravity and magnetic data reflect structure at scales of kilometres to about 100 km. None of them shows a gold deposit at depth.
Is there a ground penetrating satellite?
Around Mars, yes: NASA’s Shallow Radar looks for water and ice up to about 1 km down. Around Earth, no satellite is designed to image the ground at exploration depth. Ground penetrating radar on Earth is flown on drones and aircraft or pulled over the ground.
How deep can a ground penetrating radar satellite scan?
For Earth, the figure ESA gives is as much as five metres in dry sand for a P-band radar. Wet soil and clay cut that sharply. Ground-based radar in the USGS Florida study reached from a few feet to more than 50 feet.
What is satellite underground scanning?
It is a sales term for combining satellite data to infer what lies below the surface: alteration minerals, structures, gravity and magnetic trends, ground movement and moisture. It is a screening step ahead of ground work, not a scan of the ground itself.
How is subsurface mineral exploration by satellite done?
Analysts map surface clues such as iron oxides, clays, silica and faults from multispectral and hyperspectral images, combine them with public gravity and magnetic grids and rank areas against a deposit model. Geologists then check the top areas on the ground.
Can a satellite scanner find gold?
A satellite cannot detect gold itself. It can map the alteration pattern that often surrounds gold systems, which narrows where to look. Only samples and drilling confirm grade.
What is the difference between ground penetrating radar and satellite radar?
Ground penetrating radar works from a few centimetres above the ground with antennas tuned to resolve layers; its depth is limited by soil conductivity. Satellite radar flies hundreds of kilometres up and is built mainly to map surfaces, forests, ice and ground movement.
Can a satellite detect underground mine workings or voids?
It cannot image them directly. InSAR can show whether the ground above a mine is moving, and sudden or progressive movement can point to a problem. A survey on the ground is needed to locate the void.
Can satellites find buried treasure?
No. Radar from orbit has shown buried river valleys and possible occupation areas under dry desert sand, at landform scale. It cannot locate small buried objects.
Does satellite screening replace drilling?
No. It helps you choose where to drill and where not to. Drilling and assays remain the only direct test of grade and tonnage.
Where can I get a satellite screen of my licence?
Farmonaut offers a satellite mineral screen of a licence or claim boundary, delivered as targets for ground follow-up. Request a quote through the mining quote form.
This page is for information only. It is not investment advice. Satellite results are exploration targets, not a resource estimate. Get permission and any licence before sampling or surveying on the ground.
Farmonaut mining
Screen your licence from space
Send your boundary and get a quote for a satellite mineral screen of your ground.
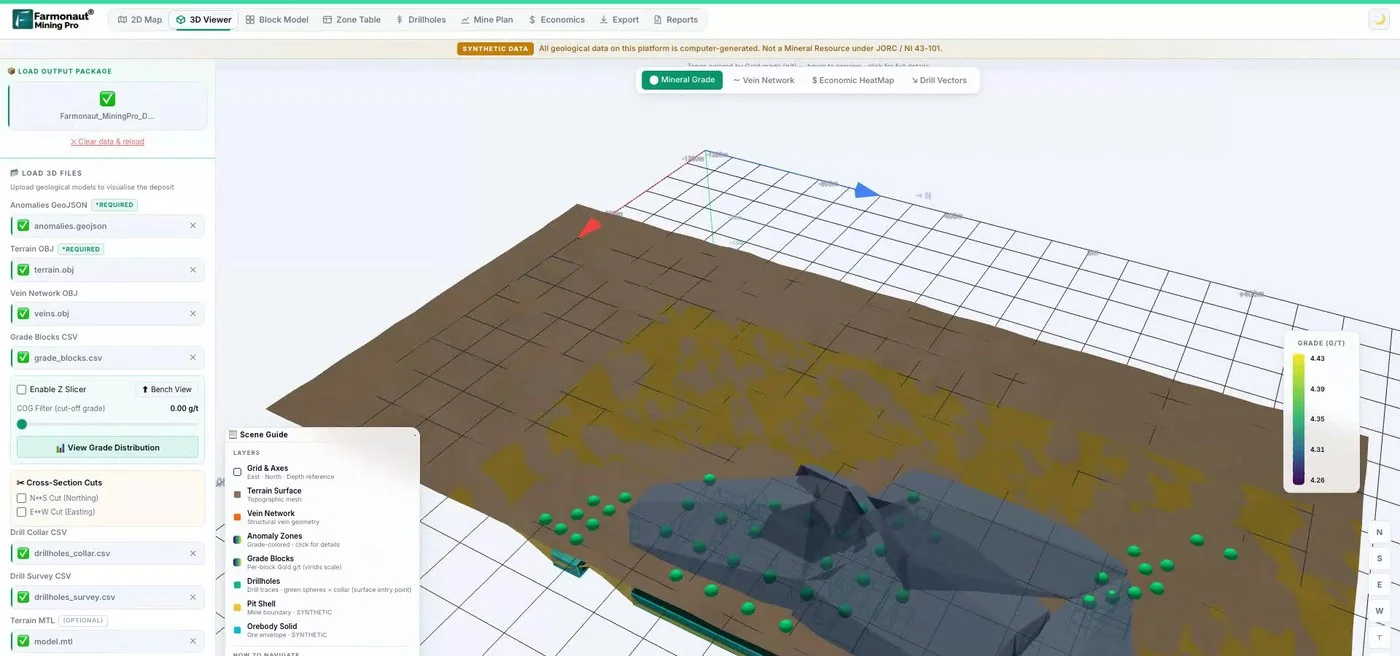
Mining Pro sample view, synthetic data
Keep reading
Sources
- ESA, Biomass beyond forests: esa.int
- USGS, Subsurface valleys and geoarcheology of the eastern Sahara revealed by shuttle radar (1982): usgs.gov
- USGS, Barr, GPR in a karst area, west-central Florida (WRI 92-4141): pubs.usgs.gov
- NASA, MRO science instruments (SHARAD): mars.nasa.gov
- eoPortal, GOCE mission: eoportal.org
- NOAA NCEI, EMAG2v3 Earth Magnetic Anomaly Grid: ncei.noaa.gov
- ESA SentiWiki, Overview of the Sentinel-2 mission: sentiwiki.copernicus.eu
- NASA LP DAAC, ASTER L1T product: earthdata.nasa.gov
- NASA Earthdata, EMIT spectral bands: earthdata.nasa.gov
- Pour and Hashim, ASTER, ALI and Hyperion for ore mineral exploration (Springerplus): pmc.ncbi.nlm.nih.gov
- Nature Communications Earth and Environment, ground deformation precursors to the Brumadinho dam collapse: nature.com
- ESA, Introducing Sentinel-1: esa.int
- US Federal Highway Administration, Subsurface investigations manual: research.engineering.ucdavis.edu
Discussion
Questions, corrections or field experience? Share them below. First-time comments are reviewed before they appear, and your email is never published.
No comments yet. Be the first to add a question or your experience.

 Critica Metals Limited
 Congo Mining Solutions
 Mining SARL
 SenGold Invest SAS
 Sania Corporation
 Sean Mining Limited
 NTS Group (Pty) Ltd
 Mine4Africa
 Lithspo Minerals Limited
 Tintina Mining Group
 Dalgety Minerals Pty Ltd
 Vortex Minerals Pty Ltd
 Faith At Work (Pty) Ltd
 Geotech Mining Solutions plc
 Vulcan International Limited
 Kidepo Associates
 GKY Mining
 Alkimy SARL
 Double A Trading
 GemSprout Metals Limited
 Qader Group
 Ileys General Trading











