

Gold stocks · Price data and filed facts
Seabridge Gold Stock and Wallbridge: Price Data, Facts
Seabridge traded at US$26.13 (3:50 pm EDT, 15 October 2026) and Wallbridge at C$0.085 (delayed quote). This page sets out KSM’s 47.3 Moz of reserves, Wallbridge’s 2.10 Moz indicated, the filed costs, funding and court dates, with a calculator.

Key takeaways
- Seabridge (TSX: SEA, NYSE: SA) traded at US$26.13 at 3:50 pm EDT on 15 October 2026; its 52-week range is US$21.67 to US$40.06 (Stockanalysis.com).
- KSM has 47.3 Moz of gold in 2022 reserves and 88.7 Moz measured and indicated resource; the 2022 study shows US$6.4 billion initial capital (Seabridge, 2022).
- On 8 June 2026 a BC court upheld the KSM ‘substantially started’ decision as reasonable but ordered further consultation before it is reconsidered (Seabridge, June 2026).
- Wallbridge (TSX: WM) was quoted at C$0.085 (delayed, 15 October 2026) on about 1.83 billion shares; Fenelon is in Quebec, with 1.75 Moz indicated (Wallbridge, 2025).
- Wallbridge’s March 2025 Fenelon PEA shows C$706 million after-tax NPV at US$2,200 gold and C$1,381 million at US$3,000 (Wallbridge, 2025).
In this article
- Seabridge Gold and Wallbridge side by side
- Seabridge Gold stock price: six weeks of price data
- KSM in numbers: reserves, resources and cost
- KSM permits, the court ruling and funding
- Wallbridge Mining stock: Fenelon and Martiniere
- Wallbridge share price and financing
- Fenelon economics at your gold price
- Risks written in the filings
- How to check a gold stock yourself
- What satellite data adds before a resource exists
- Frequently asked questions
Seabridge Gold (TSX: SEA, NYSE: SA) traded at US$26.13 at 3:50 pm EDT on 15 October 2026, and Wallbridge Mining (TSX: WM, OTCQB: WLBMF) at C$0.085 in a delayed quote at 3:24 pm the same day (Stockanalysis.com closing data). The two are different kinds of company. Seabridge holds KSM, a permitted gold-copper project in British Columbia with 47.3 million ounces of gold in its 2022 reserve estimate. Wallbridge explores two gold projects in Quebec and reports about 2.10 million ounces of indicated resource. This page lines up the filed numbers, the dates and the risks for both. It does not say whether to buy; see the disclaimer at the end.
Money is shown as US$ for Seabridge’s New York price and C$ for Wallbridge’s Toronto price. A troy ounce is 31.1035 grams. Grade is written as g/t, grams of gold per tonne of rock. Each other term is explained where it first appears.
Seabridge Gold and Wallbridge side by side
The table uses each company’s own releases and filings, plus one price site for the 15 October 2026 quotes. Where a figure comes from a study, the study’s date is given, because both companies’ studies assumed gold prices that differ from today’s.
| Item | Seabridge Gold | Wallbridge Mining |
|---|---|---|
| Listings | TSX: SEA; NYSE: SA | TSX: WM; OTCQB: WLBMF |
| Flagship | KSM, northwestern British Columbia (100% owned) | Fenelon, Nord-du-Québec (100% owned) |
| Other assets named by the company | Bronson Corridor (BC), Snowstorm (Nevada), 3 Aces (Yukon); Slaughterhouse (Wyoming) under an agreement reported 13 October 2026 | Martiniere (Quebec, 100%), Casault option (50% earn-in), Grasset |
| Stage | Permitted developer; feasibility-level work under way | Fenelon at preliminary economic assessment stage; Martiniere still being drilled |
| Latest published study | Pre-feasibility study, June 2022 | Preliminary economic assessment, March 2025 (Fenelon only) |
| Gold resource base | 88.7 Moz measured and indicated; 71.5 Moz inferred; 47.3 Moz reserves | About 2.10 Moz indicated; about 2.04 Moz inferred (March 2025 estimate) |
| Funding facts, 2026 | Loan of up to US$100 million arranged July 2026; none drawn at the August report | Cash C$74.3 million at 30 June 2026; 2026 spending planned near C$27 million |
| Quote on 15 October 2026 | US$26.13 at 3:50 pm EDT (52-week range US$21.67 to US$40.06) | C$0.085 at 3:24 pm, delayed (52-week range C$0.07 to C$0.135) |
| Market value on 15 October 2026 | About US$2.81 billion on 107.9 million shares | About C$155.6 million on 1.83 billion shares |
Sources for the table are listed at the foot of the page; the Seabridge resource figures are from the company’s KSM page and the Wallbridge figures from its Fenelon and Martiniere project pages. Fenelon is in Quebec, not Ontario. Wallbridge’s land does run along the Detour-Fenelon gold trend, which starts near Agnico Eagle’s Detour Lake mine in Ontario and runs east into Quebec.
Seabridge Gold stock price: six weeks of price data
The chart below plots Seabridge’s NYSE closing price on selected dates from 25 August to 14 October 2026, with the 15 October point being the intraday quote of US$26.13 at 3:50 pm EDT. The 25 August close of US$35.03 is the highest in the 50 sessions that the price page lists (from 6 August). By 14 October the stock closed at US$25.32, 27.7% lower, and it traded at US$26.13 at 3:50 pm EDT on 15 October. The 52-week low on the same page is US$21.67 and the high US$40.06, so the recent move sits inside a wide yearly range.
Chart
Seabridge (NYSE: SA) closing price
US$ per share; closes to 14 October 2026, intraday quote for 15 October
For the same month, gold was steadier than the stock. From the 15 September close of US$29.30 to the 15 October intraday quote of US$26.13, a drop of 10.8%, while spot-linked gold fell 2.35% to US$4,163.51 an ounce (Trading Economics, 15 October 2026). The same page records a record high of US$5,608.35 in January 2026. A developer’s shares carry company news and financing risk on top of the metal price, so they can move by more than gold does in either direction.
What moves a developer’s share price
The filings point to four groups of drivers. None of them is a forecast, and the price data above does not show which one explains a given day.
- The gold and copper price. KSM holds gold and copper, and the 2022 study assumed prices from a three-year trailing average at 20 June 2022. Higher metal prices raise the value of the same ounces; the company has not published a new study at today’s prices.
- Permitting news. A court ruling in June 2026 (covered below) put one provincial decision back to the regulator.
- Financing and dilution. New share sales and loans change what each share is worth. Wallbridge’s share count shows this clearly.
- Drill results and studies. For explorers, assay results and resource updates are the main news flow.
For a wider view of how junior and mid-tier gold names are compared, see our junior mining stocks overview and the broader gold stocks comparison. Neither page replaces company filings.
KSM in numbers: reserves, resources and cost
KSM (Kerr-Sulphurets-Mitchell) is Seabridge’s 100% owned gold-copper project in the Golden Triangle of northwestern British Columbia. The company describes it as the world’s largest undeveloped gold project by resources, with 88.7 million ounces measured and indicated plus 71.5 million ounces inferred (Seabridge, KSM page). That is the company’s own ranking, not an independent one.
Chart
Gold grade: bulk tonnage against high grade
Grams of gold per tonne
Chart
KSM gold by category
Million ounces; categories are separate tests, not additive
Two terms matter here. A mineral resource is rock that could be mined; it is graded by confidence into measured, indicated and inferred. A mineral reserve is the economically mineable part of the measured and indicated resource, after a study applies prices, costs and recoveries (CIM Definition Standards, 2014). Inferred material is the least certain and cannot be turned into reserves directly. So the 47.3 million ounces of reserves and the resource figures are different tests of the same ground and should not be added together.
For scale, 47.3 million troy ounces is about 1,470 tonnes of gold. The US Geological Survey puts Canada’s gold reserves at 3,200 tonnes and its 2025 mine output at about 200 tonnes (USGS, Mineral Commodity Summaries 2026). The definitions differ between a company study and a national summary, so treat this as a size comparison only.
KSM is a bulk-tonnage deposit: a very large amount of rock at a low grade. The 2022 study release gives the measured and indicated resource as 5.4 billion tonnes at 0.51 g/t gold with 0.16% copper, and the inferred resource as 5.7 billion tonnes at 0.36 g/t gold (Seabridge, 2022 pre-feasibility study release). Fenelon is the opposite: much less rock, at a higher grade. The grade chart below puts the two side by side.
The pre-feasibility study in one table
A pre-feasibility study (PFS) is a mid-stage engineering and cost study, more detailed than a preliminary economic assessment. Seabridge’s 2022 study was prepared by Tetra Tech. It covers open-pit mining of the Mitchell, East Mitchell and Sulphurets deposits only and leaves out the Kerr and Iron Cap deposits.
| Measure | 2022 PFS base case |
|---|---|
| Proven and probable reserves | 47.3 Moz gold, 7.3 billion lb copper, 160 Moz silver |
| Mine life | 33 years, open pit |
| Average yearly output | About 1.0 Moz gold, 178 million lb copper, 3.0 Moz silver |
| Initial capital | US$6.4 billion |
| Sustaining capital | US$3.2 billion over the mine life |
| After-tax NPV at a 5% discount rate | US$7.9 billion |
| After-tax IRR | 16.1% |
| Payback after tax | 3.7 years |
| Total life-of-mine cost per ounce of gold | US$601, after base-metal credits |
NPV (net present value) is future cash flow discounted back to today. IRR (internal rate of return) is the yearly return that makes the NPV zero. Both come from the 2022 metal-price and cost assumptions, so they are a snapshot of that study, not a current valuation. The numbers are from the 2022 study release and the KSM page cited above.
The production side of this process, from drilling and crushing to concentrate and refined metal, is shown in a short video from our channel.

▶ Follows a gold nugget from rock to ring, the production steps behind the ounces a reserve estimate counts. · 5:27
KSM permits, the court ruling and funding
KSM received a provincial environmental assessment certificate in 2014 (certificate number M14-01, listed in the BC Environmental Assessment Office extension report). A certificate can lapse if a project is not “substantially started” by a set date; once the minister decides it has been, the certificate stays in force for the life of the project. The deadline for KSM was 29 July 2026 (Canadian Mining Journal, 2022), and the province made a substantially started determination in July 2024.
On 8 June 2026 the Supreme Court of British Columbia ruled on two challenges. It found the determination reasonable but held that the Environmental Assessment Office had not consulted enough with one petitioner, the Tsetsaut Skii km Lax Ha. The office must give that nation 90 days to make written submissions and then reconsider the determination. A second petition was dismissed. The company said work at KSM continues during that process (Seabridge release, 8 June 2026).
Power, financing and the partner search
- Power: BC Hydro energised the Treaty Creek Terminal on 27 August 2026, on Highway 37 about 2 km north of the KSM entrance. It is expected to be ready for service by November 2026 (Seabridge, 8 September 2026).
- Loan: in July 2026 Seabridge arranged an unsecured loan of up to US$100 million from a strategic investor, at 7% interest compounded monthly, maturing 31 December 2026. It can be repaid in cash or, subject to TSX approval, in shares. No amount was drawn when the loan was announced (Seabridge, 20 July 2026).
- Liquidity: the second-quarter report shows net working capital of C$53.6 million at 30 June 2026, down from C$109.8 million at 31 December 2025.
- Partner: the same report says engagement with a preferred candidate for an earn-in joint venture on KSM continues (Seabridge, 13 August 2026). An earn-in means a partner earns a share of a project by spending money on it.
- Courageous Lake: the spin-out of this Northwest Territories project to shareholders was completed in the second quarter of 2026, and gains from the distribution drove second-quarter net income of C$117.5 million. The project held 11.0 Moz of measured and indicated resource when the plan was announced in December 2025, and it was to be renamed Valor Gold (Seabridge, 16 December 2025). It is no longer part of Seabridge’s portfolio.
The point for a reader: KSM has no mine revenue yet, so what the company reports as income, spending and cash comes from financing, asset moves and project spending, not from selling metal.
Wallbridge Mining stock: Fenelon and Martiniere
Wallbridge is a Toronto-based explorer with a contiguous 598 km2 land position covering 82 km of the Detour-Fenelon gold trend in northwestern Quebec (Wallbridge release, 17 February 2026). The trend is part of the Abitibi greenstone belt, an old volcanic belt that hosts many Canadian gold camps; our pieces on the Abitibi greenstone belt and its mines and on faults and targets in the belt cover the geology.
Chart
Wallbridge gold resources by project
Million ounces, effective 20 March 2025
The company’s March 2025 resource estimate, with an effective date of 20 March 2025, is shown in the chart above. Fenelon holds 1.75 million ounces indicated and 1.65 million ounces inferred; Martiniere holds 346,000 ounces indicated and 387,000 ounces inferred (Wallbridge project pages). Indicated resources have more drilling behind them than inferred ones, which are the less certain category.
The Fenelon preliminary economic assessment
A preliminary economic assessment (PEA) is an early-stage study. It may include inferred resources in its mine plan, and the company states that there is no certainty its results will be achieved. Wallbridge published an updated PEA for Fenelon on 27 March 2025; it does not include Martiniere. Key results, all in Canadian dollars unless marked US$ (Wallbridge, 27 March 2025):
- 16-year mine life, averaging 107,000 oz of gold a year, with 127,000 oz a year in the first five years, at 96% average recovery.
- 16.6 million tonnes of mineralised material mined at an average 3.34 g/t.
- Initial capital of C$579 million and sustaining capital of C$449 million.
- Total cash costs of US$851 per ounce and an all-in sustaining cost (AISC) of US$1,046 per ounce.
- After-tax NPV of C$706 million at a base gold price of US$2,200, a 5% discount rate and 1.35 Canadian dollars to the US dollar; after-tax IRR of 21%; annual cash flow after capital costs averaging C$120 million.
- At US$3,000 per ounce, after-tax NPV of C$1,381 million, IRR of 34% and payback in 2.4 years.
AISC is a reporting standard from the World Gold Council that adds sustaining capital, closure and some overheads to the cash cost of an ounce, and leaves out growth capital (World Gold Council guidance note). Wallbridge’s PEA says its AISC excludes corporate general and administrative costs, so compare it with other companies’ figures only after checking each definition.
The drilling plan and recent results
The February 2026 programme plans about 25,000 metres of drilling. Fenelon gets about 3,500 metres: 2,000 metres of large-diameter core for metallurgical test work, then 1,500 metres of nearby targets. Martiniere gets about 17,000 metres in two phases, Casault about 3,000 metres (Wallbridge holds an option to earn 50% from Midland Exploration), and Grasset about 1,500 metres. Total 2026 spending is planned near C$27 million.
Phase 1 at Martiniere was six holes along the Bug Lake corridor, which hosts most of the Martiniere resource. In the final four holes, reported on 14 July 2026, hole MR-26-144 cut 4.34 g/t gold over 10.0 metres and 10.49 g/t over 2.5 metres (Wallbridge, 14 July 2026). These are lengths measured along the drill hole, not true thickness of the zone, and a handful of intercepts does not by itself change a resource estimate.
Two company decisions changed the asset base. On 2 October 2025 Wallbridge sold its Detour East claims to Agnico Eagle for C$8 million in cash plus a 2% net smelter return royalty, with a C$4 million buyback option for Agnico. An NSR royalty is a share of mine revenue after smelting costs, paid to the royalty holder. The company’s February 2026 release describes a 598 km2 land position, with Fenelon as flagship and Martiniere as the earlier-stage project. The 2026 programme covers only Fenelon, Martiniere, Casault and Grasset.
Wallbridge share price and financing
Wallbridge was quoted at C$0.085 (delayed, 3:24 pm, 15 October 2026), with a 52-week range of C$0.07 to C$0.135 and about 1.83 billion shares outstanding, giving a market value near C$155.6 million (Stockanalysis.com, 15 October 2026). At prices this low, one tick is a large share of the price: the data shows daily moves of 5% to 10% from a one-cent change. Stock sites round the price to two decimals, so the exact daily history is easier to read on the TSX itself.
The main 2026 financing event was a private placement that closed on 22 May 2026 and added 608,267,096 shares, recorded at C$54.7 million in the equity statement (Wallbridge Q2 2026 financial statements). That is about C$0.09 per share, a figure we calculated from those two numbers. Cash rose from C$28.9 million at 31 December 2025 to C$74.3 million at 30 June 2026. The same filing says the placement came with a new investor rights agreement with Agnico Eagle, which ended the 2019 agreement and its property-related terms.
Together, these numbers explain why a headline price alone says little about Wallbridge. Share count and cash per share matter as much as the price, and the 608 million placement shares alone equal about a third of today’s 1.83 billion.
Fenelon economics at your gold price
The calculator below uses Wallbridge’s published Fenelon PEA inputs: 107,000 oz of yearly output, an AISC of US$1,046 an ounce, a 1.35 exchange rate and C$579 million of initial capital. Replace the gold price with today’s quote and see how the yearly margin and the simple payback change. It is a simplified before-tax check, not a model of the project, and it ignores ramp-up, tax, financing and the timing of spending.
Calculator
What yearly margin does Fenelon leave at your gold price?
Enter a gold price; the other inputs start at the Wallbridge PEA values and can be changed.
- Margin per ounce (C$): 2,638 C$/oz
- Simple payback of initial capital (years, before tax): 2.1 years
Example values only. The gold price is an input: example, use today’s price. Output, AISC, exchange rate and initial capital default to Wallbridge’s March 2025 PEA (average 107,000 oz a year; AISC US$1,046/oz; 1.35 C$ per US$; initial capital C$579 million). Before tax; ignores ramp-up, financing, closure timing and the PEA’s own cash-flow model. The default US$3,000 matches the PEA sensitivity case; gold was about US$4,163.51 on 15 October 2026 (Trading Economics).
Risks written in the filings
These are risks the companies and their documents describe, listed without ranking.
- Seabridge: permitting and consultation. The June 2026 ruling requires further consultation with one nation before the substantially started decision is reconsidered, and the company expects work to continue meanwhile.
- Seabridge: funding a very large build. The 2022 study put initial capital at US$6.4 billion, and the company is looking for a joint-venture partner. The US$100 million loan matures on 31 December 2026.
- Seabridge: study age. The reserve and economics are from 2022 prices and costs; a feasibility study is the next step the company is working toward.
- Wallbridge: study stage. The Fenelon PEA includes inferred resources, and a pre-feasibility study is still ahead.
- Wallbridge: dilution. The share count is about 1.83 billion after the May 2026 placement, so any new financing is spread over many shares.
- Both: metal prices and cost inflation. The PEA and PFS results are sensitive to gold price; Wallbridge’s own sensitivity table shows after-tax NPV rising from C$706 million to C$1,381 million between US$2,200 and US$3,000.
How to check a gold stock yourself
You can verify every figure on this page in a few steps, and the same steps work for any listed explorer or developer.
- Read the company’s latest news release first. It states the exchange, ticker, project ownership and the date of the figures.
- Open the technical report behind the numbers. Canadian companies file them on SEDAR+; look at the table of resources and reserves and the gold price used.
- Check the category. Reserves, measured and indicated, and inferred ounces are not the same, and they should not be added together.
- Check the currency. Seabridge’s price is in US$ on the NYSE; Wallbridge’s is in C$ on the TSX.
- Count the shares. Market value is the price times shares outstanding, and new placements raise the count.
- Read the latest financial statements for cash, debt and spending plans. Compare cash with the next 12 months of planned spending.
- Note the study’s price assumption. A study run at US$2,200 gold says little about a US$4,000 market without being re-run.
Our guide to the Golden Triangle of British Columbia, where KSM sits, covers the geology, ice and access conditions that shape work there.
What satellite data adds before a resource exists
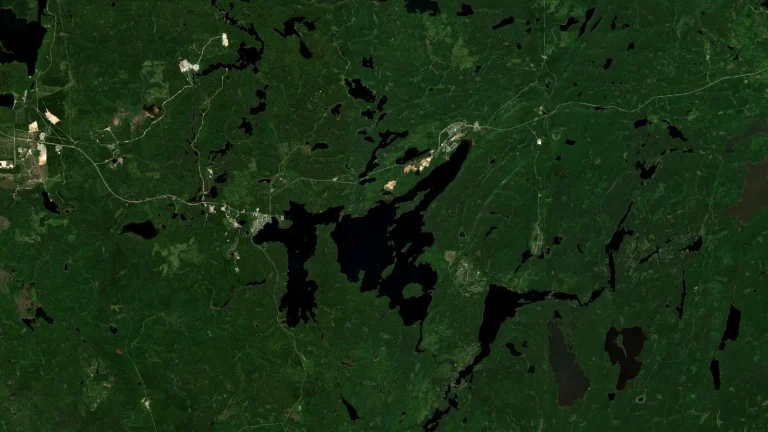
Satellite data cannot show how many ounces a company holds or what a share is worth. It can show where surface clues such as iron staining, clay minerals and large fault lines line up on a licence area, which helps an explorer decide where to drill first. Results of this kind are exploration targets that come before a resource estimate, and they are not a mineral resource or reserve under Canadian reporting rules. Farmonaut’s mining service takes a licence boundary as a KML, KMZ or polygon file and returns a mapped target report in days to weeks. For a quote, use the mining enquiry form or contact the team; the satellite mineral detection page explains the method.

▶ Explains how satellites map the rock and alteration around gold rather than the gold itself. · 4:25
Frequently asked questions
Is Seabridge Gold a good stock to buy?
This page does not give investment advice. It lists what the filings show: KSM has 47.3 million ounces of gold reserves from a 2022 study, no mine production yet, a court-ordered reconsideration of one permitting decision, and a short-term loan facility of up to US$100 million. The share traded at US$26.13 at 3:50 pm EDT on 15 October 2026. Whether those facts suit your goals is a question for a licensed adviser.
What is the Seabridge Gold stock ticker?
Seabridge trades on the Toronto Stock Exchange as SEA and on the New York Stock Exchange as SA. The NYSE price is in US dollars and the TSX price in Canadian dollars.
Where is the KSM project?
KSM is in the Golden Triangle of northwestern British Columbia. The Treaty Creek Terminal power facility sits on Highway 37, about 2 km north of the project entrance.
How much gold does KSM hold?
The company reports 47.3 million ounces of proven and probable gold reserves from its 2022 pre-feasibility study, plus 88.7 million ounces of measured and indicated resource and 71.5 million ounces inferred. Reserves and resources are different categories and are not added together.
What did the court decide about KSM in June?
On 8 June 2026 the Supreme Court of British Columbia found the substantially started determination reasonable, but required the Environmental Assessment Office to consult the Tsetsaut Skii km Lax Ha further, giving them 90 days for written submissions, and then reconsider. A second petition was dismissed.
What is Wallbridge Mining’s ticker, and where does it trade?
Wallbridge trades on the Toronto Stock Exchange as WM and on the OTCQB market in the US as WLBMF. It is not listed on the TSX Venture Exchange.
Is Fenelon in Ontario or Quebec?
Fenelon is in Quebec, in the Nord-du-Québec region about 75 km west-northwest of Matagami. The Detour Lake mine, owned by Agnico Eagle, lies about 80 km west of Fenelon, across the border in Ontario.
How much gold does Wallbridge have?
In the March 2025 estimate, Fenelon has 1.75 million ounces indicated and 1.65 million ounces inferred, and Martiniere has 346,000 ounces indicated and 387,000 ounces inferred. Inferred ounces are the less certain category.
Why is the Wallbridge share price under ten cents?
The filings do not state a reason for the price level. They do show about 1.83 billion shares outstanding, a May 2026 placement of 608 million shares, and a delayed quote of C$0.085 at 3:24 pm on 15 October 2026. Market value is the price times shares, which stood near C$155.6 million.
What is the difference between a PEA and a pre-feasibility study?
A preliminary economic assessment is an early look at a project’s potential and may include inferred resources. A pre-feasibility study uses more engineering, cost and recovery detail and the reserves that come from measured and indicated resources. KSM has a pre-feasibility study from 2022; Fenelon has a PEA from March 2025.
Did Seabridge spin out Courageous Lake?
Yes. Seabridge reported the spin-out to shareholders as completed in its second-quarter 2026 report, after announcing the plan in December 2025. The project, renamed Valor Gold in the plan, is no longer held by Seabridge.
Does satellite data replace a resource estimate?
No. A resource estimate needs drilling and a qualified person’s report. Satellite mapping gives exploration targets that come before that work and can help decide where to drill.
This page is for information only. It is not investment advice. It gives no price targets and does not consider your goals or risk tolerance. Share prices change daily; check a live quote and each company’s filings, and speak to a licensed adviser before you invest.
Farmonaut mining
See a licence area from space before drilling
Investors can see how satellite data screens a licence area for minerals as an exploration target, ahead of a resource estimate.

Mining Pro sample view, synthetic data
Keep reading


Sources
- Stockanalysis.com, Seabridge Gold (SA) price history, to 15 October 2026: stockanalysis.com
- Stockanalysis.com, Seabridge Gold (SA) overview, 15 October 2026: stockanalysis.com
- Stockanalysis.com, Wallbridge Mining (TSX:WM) overview, 15 October 2026: stockanalysis.com
- Trading Economics, Gold price, 15 October 2026: tradingeconomics.com
- Seabridge Gold, KSM: The Opportunity: seabridgegold.com
- Seabridge Gold, Completes Updated Pre-Feasibility Study for KSM (June 2022): seabridgegold.com
- Seabridge Gold, BC Supreme Court decision on KSM (8 June 2026): newsfilecorp.com
- Seabridge Gold, Second quarter 2026 report (13 August 2026): newsfilecorp.com
- Seabridge Gold, US$100M credit facility (20 July 2026): newsfilecorp.com
- Seabridge Gold, Treaty Creek Terminal energized (8 September 2026): seabridgegold.com
- Seabridge Gold, plan to spin out Courageous Lake (16 December 2025): newsfilecorp.com
- Canadian Mining Journal, Seabridge raises US$225m for KSM (28 February 2022): mining.com
- BC Environmental Assessment Office, KSM Certificate M14-01, Amendment 2 summary evaluation report: projects.eao.gov.bc.ca
- CIM, Definition Standards for Mineral Resources and Mineral Reserves (2014): mrmr.cim.org
- World Gold Council, Guidance note on non-GAAP metrics: AISC and AIC: gold.org
- USGS, Mineral Commodity Summaries 2026: Gold: pubs.usgs.gov
- Wallbridge Mining, Updated PEA for Fenelon (27 March 2025): wallbridgemining.com
- Wallbridge Mining, 2026 exploration and technical studies programs (17 February 2026): nasdaq.com
- Wallbridge Mining, Fenelon project page: wallbridgemining.com
- Wallbridge Mining, Martiniere project page: wallbridgemining.com
- Wallbridge Mining, Q2 2026 interim financial statements: wallbridgemining.com
- Wallbridge Mining, Martiniere drill results (14 July 2026): wallbridgemining.com
- The Deep Dive, Seabridge picks up Wyoming copper-gold project from Orogen (13 October 2026): thedeepdive.ca
Discussion
Questions, corrections or field experience? Share them below. First-time comments are reviewed before they appear, and your email is never published.
No comments yet. Be the first to add a question or your experience.

 Swati Minerals
 Faith At Work (Pty) Ltd
 Geotech Mining Solutions plc
 Vulcan International Limited
 Kidepo Associates
 GKY Mining
 Alkimy SARL
 Double A Trading
 GemSprout Metals Limited
 Qader Group
 Ileys General Trading
 SG Gold Mining LLC
 VRV Global Pte Ltd
 Omsri International FZE
 G.I.T.T.
 Jaunita Erss Ltd
 Almosi SARL
 SRK Consulting
 Berks Gold Limited
 Mwerezi Minerals Company Limited
 Mining SARL
 SenGold Invest SAS

 Exploration consultancy · South Africa · Gold










