

Silver royalty and streaming companies · Ranked list
Silver Royalty Companies Ranked by Silver Exposure
Silver was 37% of Triple Flag’s and 36% of Wheaton’s 2025 revenue, against 13% at Franco-Nevada and 12% at Royal Gold. Six listed names ranked by silver share, with ounces, pros, cons and a stream margin calculator.
Key takeaways
- Silver was about 37% of Triple Flag’s 2025 revenue (US$145.7M of US$388.7M) and 36% of Wheaton’s; it was 52% of Wheaton’s revenue in the second quarter of 2026 (company filings and call).
- Franco-Nevada earned US$235.6M from silver in 2025 (about 13% of revenue) and Royal Gold got 12% of revenue from silver; both are gold-led.
- Wheaton produced 22.289 million ounces of silver in 2025 and guides 27.0 to 29.0 million ounces for 2026, after closing a US$4.3 billion Antamina silver stream in April 2026.
- Silver revenue grew faster than silver volume: Triple Flag’s streams sold 3.4 million silver ounces in both 2024 and 2025 while its silver revenue rose from US$97.7M to US$145.7M.
- Sandstorm Gold and EMX no longer trade as separate stocks; Royal Gold bought Sandstorm and EMX merged into Elemental Royalty (company releases).
In this article
- How we chose these silver royalty companies
- Silver royalty companies compared at a glance
- The ranked list: six silver royalty and streaming companies
- Royalty or stream: how silver cash flows differ
- Stream margin and payback calculator
- Silver price: what the filings and the market data show
- Silver revenue grew faster than silver ounces
- What to check on the mines behind the royalties
- Silver royalty companies that changed or left the list
- Where satellite screening fits for licence owners
- Frequently asked questions
If you want silver exposure from a royalty or streaming company, the filings give a clear order. In 2025, silver was about 37% of Triple Flag’s revenue and 36% of Wheaton Precious Metals’ revenue. At Franco-Nevada it was about 13% and at Royal Gold 12%. Silver Crown Royalties is a much smaller company that describes itself as a silver royalty company. This page ranks six listed names on that measure and shows what each one actually owns.
It is written for people who own mining licences, advise on mining finance, or invest in the sector. These companies matter to a licence owner for a second reason: they are the buyers when a project sells a royalty or a stream to raise money. Everything below is a fact from a filing or release, with its date. It is not advice to buy or sell anything.
How we chose these silver royalty companies
We started with listed companies that hold royalties or streams on silver-bearing mines and that published full-year 2025 results or a recent quarterly report. We then ranked them by silver exposure. Four companies publish a comparable number, the share of 2025 revenue that came from silver, and they are ranked on it (places 2 to 5). Silver Crown is placed first because it describes itself as silver-only, and Metalla is placed last because it does not disclose a silver split. Those two places are a judgement, not a measured share, and we do not estimate what a company has not published.
- Silver share of revenue. Taken from the company’s own filing or results release for 2025. Company-reported only.
- Listing and name checked. Each ticker was confirmed in a 2026 filing or release. Companies that have been bought or merged are listed separately near the end.
- Scale and ounces. Silver ounces produced or delivered, where published, so you can tell a large silver stream from a small royalty.
- Honest pros and cons. Each entry names a strength and a weakness that come from the company’s own documents.
One caution before the table. Most of these companies report sales in gold equivalent ounces (GEOs), which convert silver, copper and other metals into gold at the company’s own price ratios. A GEO at one company is not the same as a GEO at another, so we use revenue shares and raw silver ounces for comparison instead.
Silver royalty companies compared at a glance
The table lists the six companies in ranked order. “Silver share” is silver revenue divided by total revenue for the 2025 financial year, from each company’s own filing. Silver Crown (silver only) and Metalla (no split disclosed in the release we read) have no comparable percentage, so their positions are explained above.
Chart
Silver share of 2025 revenue
Per cent of total revenue, company-reported. Silver Crown (silver only) and Metalla (no split disclosed) are not shown: no comparable figure
| Rank | Company | Listing | Model | Silver share of 2025 revenue |
|---|---|---|---|---|
| 1 | Silver Crown Royalties | Cboe Canada: SCRI; OTCQX: SLCRF | Silver royalties only | Silver only, by its own description |
| 2 | Triple Flag Precious Metals | TSX and NYSE: TFPM | 16 streams, 223 royalties | 37% (US$145.7M of US$388.7M) |
| 3 | Wheaton Precious Metals | TSX, NYSE and LSE: WPM | Mainly streams | 36% (52% in Q2 2026) |
| 4 | Franco-Nevada | TSX and NYSE: FNV | Royalties and streams | 13% (US$235.6M of US$1,822.8M) |
| 5 | Royal Gold | Nasdaq: RGLD | Streams and royalties | 12% |
| 6 | Metalla Royalty & Streaming | TSXV and NYSE American: MTA | Royalties and streams | Not disclosed in the release |
Rank one goes to Silver Crown only because it is pure silver, not because it is the safest or the largest. It earned about C$1.9 million in its latest quarter, against US$929 million at Wheaton. Scale is covered in each entry below.
The ranked list: six silver royalty and streaming companies
1. Silver Crown Royalties (Cboe Canada: SCRI)
Best for: readers who want a silver-only royalty company and accept that it is small.
Silver Crown describes itself as a silver royalty company and says it holds seven royalties. In the quarter to 30 June 2026 it reported royalty revenue of C$1,867,056, up 598% on a year earlier, and net income of C$137,983. Attributable silver deliveries were 18,062 ounces. Growth came mainly from the Igor 4 royalty in Peru. Effective 30 June 2026 it also bought two 1% net smelter return (NSR) royalties on the Madre Sierra deposit in Peru for US$6 million, with US$2 million more payable after the first royalty payment.
Pros: every dollar of royalty income links to silver. Revenue and deliveries are rising from a low base. It reported net income in the period, which the company called its first positive earnings since it listed in July 2024.
Cons: very small, and it reports in Canadian dollars. One payer, PPX Mining, settled a C$1.2 million royalty payment by issuing shares rather than cash, and another, Pilar Gold, had not yet paid its royalty due on 30 June 2026. A net smelter return royalty is a share of a mine’s sales after smelting and refining deductions, so it depends on that operator keeping its mine running and paying (Clayton Utz, August 2024).
2. Triple Flag Precious Metals (TSX and NYSE: TFPM)
Best for: the highest silver share of revenue among the established mid-size names, with a large royalty count.
Triple Flag’s 2025 revenue was US$388.7 million, of which silver was US$145.7 million and gold US$243.0 million, according to its annual management discussion filed with the SEC. It sold 113,237 GEOs, of which 40,471 came from silver. As of 18 February 2026 its portfolio held 239 assets: 16 streams and 223 royalties. The Arcata silver and gold mine began production in the fourth quarter of 2025.
Pros: a ninth straight annual record in GEOs sold, and a portfolio that is mostly royalties by count. Silver revenue rose from US$97.7 million in 2024 to US$145.7 million in 2025.
Cons: the company’s own filing says the stream rate at its Cerro Lindo silver stream in Peru steps down from 65% to 25% from the second quarter of 2026, after 19.5 million ounces of silver were delivered since 2016. It guides 2026 sales of 95,000 to 105,000 GEOs, below the 113,237 sold in 2025. Part of its Australian income is taxed in Australia (24% cash tax rate in 2025).
3. Wheaton Precious Metals (TSX, NYSE and LSE: WPM)
Best for: the largest silver stream book by ounces, built mainly from by-product silver at big copper, zinc and gold mines.
In 2025 Wheaton earned about US$2.3 billion in revenue: 62% gold, 36% silver, 1% palladium and 1% cobalt. It produced 22.289 million ounces of silver and 416,171 ounces of gold, per its fourth-quarter 2025 results. In April 2026 it closed a US$4.3 billion silver stream with BHP on the Antamina mine in Peru, which lifted its share of Antamina silver from 33.75% to 67.5%. In the second quarter of 2026 silver was 52% of revenue, per the company’s call, and its slides give a realized silver price of US$73.41 an ounce and 2026 silver guidance of 27.0 to 29.0 million ounces.
Pros: by far the most silver ounces of any company here, a long list of mostly life-of-mine streams, and a stream holder is not normally asked to pay a mine’s operating or capital costs (Ecora, royalties and streams explained). It still pays a set price per ounce on delivery.
Cons: one asset now carries a lot of weight. Antamina produced 2.3 million ounces of attributable silver in the second quarter of 2026, up about 56% on a year earlier, and Wheaton said output was affected by the timing of planned maintenance, with a July shutdown brought forward into June. The deal was financed with cash, a new US$1.5 billion term loan and a draw on the revolving credit line. The company also said its revenue split is expected to move back toward gold as new projects start.
4. Franco-Nevada (TSX and NYSE: FNV)
Best for: a gold-led, diversified royalty book where silver is a smaller but real part.
Franco-Nevada’s 2025 results show revenue of US$1,822.8 million and 519,106 GEOs sold. Silver brought in US$235.6 million from 63,697 silver GEOs, about 13% of the total, up from US$117.8 million in 2024. Gold was US$1,275.8 million. In the fourth quarter, precious metals were 90% of revenue (71% gold, 17% silver, 2% platinum group metals). It also holds oil, gas and iron ore interests. The company said it had no debt and US$3.1 billion of available capital in March 2026.
Pros: a very wide portfolio, mostly in the Americas (89% of Q4 revenue), and no debt as reported. Silver comes from several assets, including the Cobre Panama copper mine stream.
Cons: silver is a minor line. Cobre Panama operations were suspended, and the March 2026 release said about 265,000 silver ounces and 23,100 gold ounces from processing stockpiled ore were awaiting formal approval and were not in 2026 guidance. Silver share is lower than at Triple Flag or Wheaton.
5. Royal Gold (Nasdaq: RGLD)
Best for: a US-listed company with steady, mostly gold income and a smaller silver and copper stream behind it.
In its annual report (Form 10-K) for 2025, Royal Gold said about 90% of revenue came from precious metals, including 78% from gold and 12% from silver, with 7% from copper. The average silver price it used was US$40.03 an ounce. Five properties produced about 53% of revenue, led by Mount Milligan at 22%. During 2025 it closed the Sandstorm Gold, Horizon Copper and Kansanshi gold stream transactions. On its fourth-quarter call it said it expected about 1.45 to 1.5 million ounces of silver to its account in 2026, and about 60% of the 4.0 to 4.5 million ounces a year that MMG targets at the Khoemacau expansion, with concentrate expected in the first half of 2028.
Pros: large, listed in the US, with 2025 revenue near US$1.0 billion and acquisitions in 2025 that added to its stream and royalty book.
Cons: silver is only about one-eighth of revenue, so price swings in gold and copper matter more. The company said it expected to repay its revolving credit facility in early 2027 unless it made further large acquisitions, so debt from the deals is still being paid down.
6. Metalla Royalty & Streaming (TSXV and NYSE American: MTA)
Best for: readers who want a small royalty company with a growing set of silver-bearing assets and accept high risk.
Metalla’s 2025 results show revenue of US$11.7 million, up from US$5.9 million, and 3,436 attributable GEOs, below its guide of 3,500 to 4,500. It reported a net loss of US$4.2 million. Its silver-related assets include a 4.0% NSR royalty on lead, zinc and silver from the Endeavor mine in Australia, where the operator said high-grade silver mining began in the Upper North Lode in February 2026. The company expects cash flow in 2026 from Endeavor, La Guitarra, La Encantada and, based on operator disclosures, La Parrilla.
Pros: several silver-heavy royalties at or near production, and revenue roughly doubled in 2025.
Cons: small, loss-making in 2025, and it missed its own GEO guidance. Deliveries at Endeavor were hit by a fatal accident in October 2025 that suspended mining for a time. The release does not split revenue by metal, so its silver share cannot be stated.
Royalty or stream: how silver cash flows differ
A royalty is a right to a share of a mine’s revenue or output. Ecora describes it as a payment to the operator up front in return for a percentage of revenue from production, and notes that a stream is not a royalty because it is not an interest in land and the holder pays an ongoing price to buy the metal. In plain terms, a stream holder pays a mine a large sum now and then buys silver at a set low price per ounce for as long as the contract runs.
A net smelter return royalty takes a fixed percentage of the money the mine receives from selling its concentrate, after allowed costs such as transport to the smelter and treatment charges. Because the cost deductions are written into each contract, two 2% royalties can pay differently. A gross revenue royalty has fewer deductions.
For a silver investor, the stream or royalty sets how the silver price reaches the company. With a stream, cash margin per ounce is the market price minus the fixed price paid, so a rise in the silver price raises the margin one for one. With a royalty, the company gets a share of revenue, so the mine’s costs do not reduce it, but the operator’s output, grade and recovery decide the volume. Neither structure lets the holder control mining decisions.
Stream margin and payback calculator
This calculator shows the arithmetic of a silver stream. Enter your own ounces, silver price, fixed payment per ounce and upfront payment to see the yearly cash margin and a simple payback period. Prices are examples, not forecasts.
Calculator
What does a silver stream earn per year?
Enter your own ounces, price, fixed payment and upfront cost. Results update as you type.
- Gross value of silver delivered: $40,000,000
- Cash margin per ounce: $35
- Simple payback, years: 8.6
- Margin as share of price, %: 87.5
Example values only, not benchmarks or forecasts. Silver price is an input: use today’s price. The fixed payment per ounce is set in each stream contract and differs by deal. Payback is a simple upfront cost divided by yearly cash margin, with no tax, no discounting and no change in price or ounces. Money is in US$.
Silver price: what the filings and the market data show
All six companies are tied to the silver price, so it helps to see how much it moved. The U.S. Geological Survey estimated the 2025 average silver price at US$38 per troy ounce, 34% higher than in 2024. The Silver Institute measured a 42% rise in the annual average and reported an all-time high above US$121 on 29 January 2026, then a drop to the mid-US$70s by early April. The two agencies use different price series and averaging, so the percentages differ.
Chart
Silver price points reported in company filings
US$ per troy ounce; averages use the LBMA fix, the last bar is Wheaton’s realized price
The companies’ own filings use the London Bullion Market Association (LBMA) fix. Triple Flag and Royal Gold both report an LBMA average of US$28.27 in 2024 and US$40.03 in 2025, with a fourth-quarter 2025 average of US$54.73 in Triple Flag’s filing. Wheaton’s realized silver price in the second quarter of 2026 was US$73.41 an ounce, against US$34.05 a year earlier. Price is quoted here only as dated, sourced values.
Silver revenue grew faster than silver ounces
Higher prices, not larger volumes, explain most of the gain at Triple Flag. Its streams sold 3.4 million ounces of silver in both 2024 and 2025, while the average silver price rose from US$28.27 to US$40.03 and its silver revenue rose from US$97.7 million to US$145.7 million, about half as much again. Franco-Nevada’s silver revenue doubled, from US$117.8 million to US$235.6 million. A silver GEO is silver revenue divided by a gold price, so GEO counts are not a count of ounces and are not used as a volume measure here. The pattern shows why a drop in silver price would work in the opposite direction.
Chart
Silver revenue, 2024 and 2025
US$ million, as reported by each company
The Silver Institute’s World Silver Survey adds the supply side. Global mine production rose 3% to 846.6 million ounces in 2025, and the market was in deficit for a fifth straight year. The Institute forecasts flat mine output in 2026 and a wider deficit of 46.3 million ounces. Those figures describe the market, not any company’s earnings.
What to check on the mines behind the royalties
A royalty is only as good as the mine that pays it. Silver is mostly a by-product: the U.S. Geological Survey says it is recovered as a byproduct of lead-zinc, copper and gold mining, in descending order of silver output, and the Silver Institute says lead and zinc mines remained the largest source in 2025. That is why several of the assets above are copper or zinc mines such as Antamina or Khoemacau. For each royalty, check these items in the operator’s own reports:
- Silver grade and recovery. Grade is the amount of metal per tonne of ore. A fall in silver grade, as Wheaton noted at Peñasquito in the fourth quarter of 2025, cuts royalty income even when the mine runs at full throughput.
- Mine life and reserves. A reserve is the part of a resource that can be mined at a profit with current methods. Compare reserves with the annual rate of mining.
- Where the stream stops. Some streams step down after a set number of ounces, as Triple Flag’s Cerro Lindo stream does.
- Operator and country. Permits, tax changes and shutdowns affect payments. Several names above hold assets in Peru, Mexico or Panama.
- How the operator pays. Cash or shares, on time or late, as the Silver Crown example shows.
Our video below explains how a satellite image becomes a tonnage and grade, and which inputs in that chain are measured and which are assumed. The same distinction applies to the mine plans that stand behind any royalty.
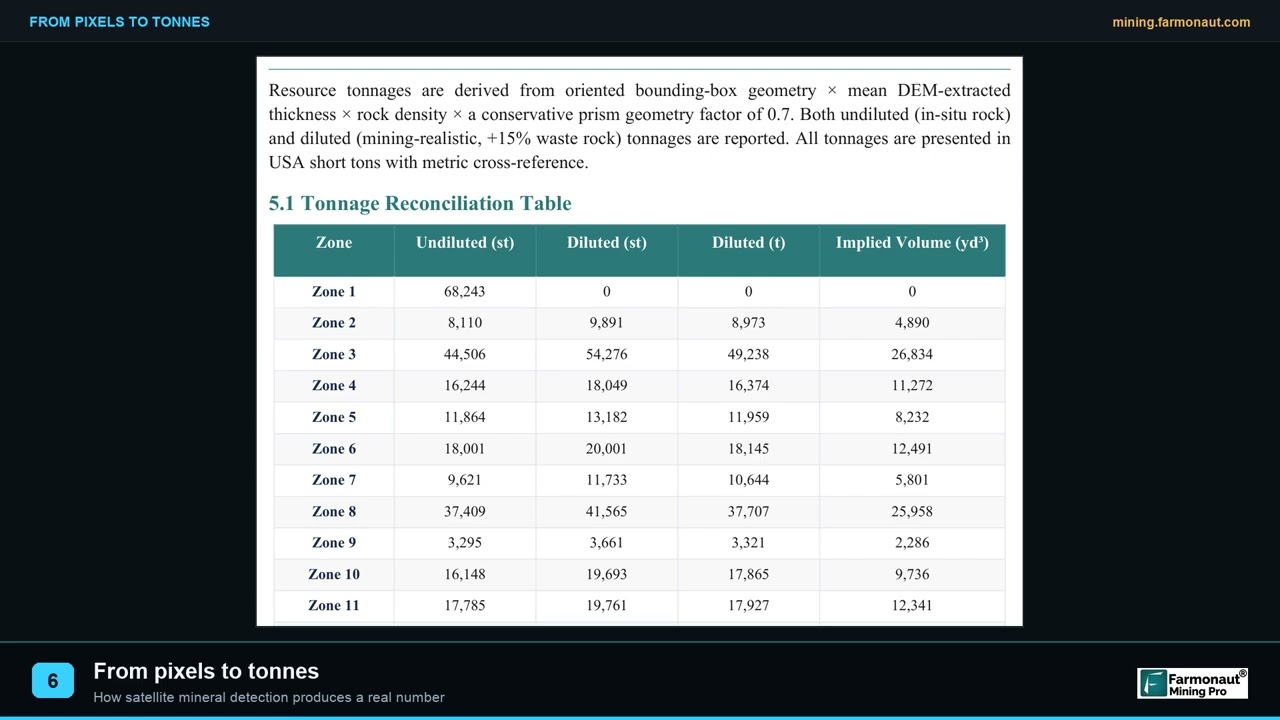
▶ Explains how a satellite picture becomes a tonnage and a grade, and which inputs are measured and which are assumed. · 2:54
Silver royalty companies that changed or left the list
- Sandstorm Gold. Royal Gold closed its purchase of Sandstorm during 2025, so Sandstorm no longer trades as a separate stock. Its assets now sit inside Royal Gold’s figures.
- EMX Royalty. It merged with Elemental Altus in November 2025. The combined company is Elemental Royalty Corporation (TSXV: ELE), which describes its portfolio as gold-focused. EMX shares were delisted.
- Osisko Gold Royalties. It is now OR Royalties (TSX and NYSE: OR). It reported 80,775 GEOs and record revenue of US$277.4 million in a preliminary January 2026 release, but we did not find a silver revenue split, so it is not ranked.
For the gold-focused side of the same industry, see our separate guide to gold royalty stocks. For where the underlying silver is mined, see our pages on silver mining and ore trends, silver production in Mexico, and copper stocks, since much silver comes with copper.
Where satellite screening fits for licence owners
Royalty and stream buyers pay for projects that already have a resource estimate, so a licence holder with only a claim and a map is usually earlier than their interest. Satellite screening is an earlier step. Farmonaut maps clay, iron and other alteration signals from satellite imagery of a licence area to rank targets before drilling; these are exploration targets, not a resource estimate. To discuss an area, use the mining quote form or the contact page.
▶ A three-minute explanation of remote sensing for mining and the six instrument families behind it. · 2:01
Related reading on this site: Mining Stocks With China Exposure: Revenue Shares.
We cover a connected topic in Silicon Mining Companies: Who Mines, Smelts and Sells.
Frequently asked questions
What is a silver royalty company?
It is a company that pays a mine owner money now in return for a right to part of the mine’s silver sales or output later. It does not run the mine. Income is a share of revenue or a supply of silver at a set price.
What is the difference between a silver royalty and a silver stream?
A royalty gives a percentage of revenue or output. A stream gives the right to buy silver at a fixed low price per ounce, so the holder earns the gap between that price and the market price. Ecora notes that a stream is not an interest in land.
Which silver royalty company has the most silver exposure?
Silver Crown Royalties is silver-only but very small. Among the larger names, silver was 37% of Triple Flag’s 2025 revenue and 36% of Wheaton’s. Wheaton’s silver share was 52% in the second quarter of 2026.
Who are the biggest silver streaming companies?
By silver ounces produced, Wheaton Precious Metals leads, at 22.289 million ounces in 2025 and a 2026 guide of 27.0 to 29.0 million ounces. Franco-Nevada, Triple Flag and Royal Gold hold smaller silver books inside broader precious-metal portfolios.
Is Sandstorm Gold still a separate company?
No. Royal Gold closed its purchase of Sandstorm during 2025. Sandstorm’s streams and royalties are now reported inside Royal Gold.
What is a gold equivalent ounce, and why can’t I compare GEOs?
A GEO converts silver and other metals into gold ounces at a price ratio the company chooses. Each company uses its own ratios and assumptions, so GEO counts do not line up. Triple Flag, for example, assumed gold-to-silver ratios of 64 to 80 across the quarters of 2026 in its guidance.
Do silver royalty companies pay the mine’s costs?
Royalty holders normally do not pay operating or capital costs, and a stream holder usually does not either. A stream holder does pay a set price for each ounce delivered. This is the main difference from owning a mining company.
Where does the silver behind these deals come from?
Mostly from mines whose main product is another metal. The U.S. Geological Survey says silver is recovered as a by-product of lead-zinc, copper and gold mining. Wheaton’s silver comes from mines such as Peñasquito in Mexico and Antamina, a copper-zinc mine in Peru.
What are the main risks of silver royalty companies?
The filings point to the silver price, operator problems such as lower grade or shutdowns, stream step-downs, country risk, and for small names late or share-based payments. Some also carry debt from acquisitions, as Wheaton and Royal Gold said.
Where can I find a royalty company’s silver revenue?
Look in the annual report or results release for a table of revenue by metal. US-listed filers file them with the SEC (Form 10-K or 40-F), and Canadian filers on SEDAR+. If a company only gives GEOs, silver revenue is not stated.
How does a licence owner sell a royalty or stream on a project?
The owner agrees terms with a royalty company: an upfront payment in return for a percentage of revenue or a supply of metal. Buyers generally want a defined resource and a development plan, and the contract needs legal review in the project’s country. Get legal and tax advice before signing.
This page is for information only. It is not investment advice. Company figures are as reported by each company on its own definitions and are not directly comparable. Check current filings before relying on any number.
Farmonaut mining
See satellite exploration for your project area
Farmonaut screens an area of interest from satellite images to rank exploration targets before ground crews go in, and takes KML, KMZ or polygon input.

Mining Pro sample view, synthetic data
Keep reading
Sources
- USGS, Mineral Commodity Summaries 2026: Silver: pubs.usgs.gov
- Silver Institute, World Silver Survey 2026 press release (15 April 2026): silverinstitute.org
- Triple Flag Precious Metals, MD&A for 2025 (SEC EDGAR exhibit 99.3): sec.gov
- Royal Gold, Form 10-K for 2025 (SEC EDGAR): sec.gov
- Wheaton Precious Metals, Q4 and full-year 2025 results (12 March 2026): s203.q4cdn.com
- Wheaton Precious Metals, 2025 production and 2026 guidance (16 February 2026): s203.q4cdn.com
- Wheaton Precious Metals, second quarter 2026 conference call slides: s203.q4cdn.com
- Wheaton Precious Metals, Q2 2026 earnings call transcript (Motley Fool, 14 August 2026): fool.com
- Franco-Nevada, 2025 results (10 March 2026): newswire.ca
- Royal Gold, Q4 2025 earnings call highlights (Yahoo Finance, 20 February 2026): finance.yahoo.com
- Metalla Royalty & Streaming, Q4 and 2025 results (26 March 2026): metallaroyalty.com
- Silver Crown Royalties, second quarter 2026 results (11 August 2026): investingnews.com
- Elemental Altus and EMX, completion of merger (13 November 2025): newsfilecorp.com
- OR Royalties, preliminary Q4 2025 GEO deliveries (6 January 2026): finviz.com
- Ecora Royalties, royalties and streams explained: ecora-resources.com
- Clayton Utz, Digging into mining royalties (August 2024): claytonutz.com
Discussion
Questions, corrections or field experience? Share them below. First-time comments are reviewed before they appear, and your email is never published.
No comments yet. Be the first to add a question or your experience.

 Almosi SARL
 SRK Consulting
 Berks Gold Limited
 Mwerezi Minerals Company Limited
 Mining SARL
 SenGold Invest SAS
 Sean Mining Limited
 NTS Group (Pty) Ltd
 Mine4Africa
 Lithspo Minerals Limited
 Tintina Mining Group
 Dalgety Minerals Pty Ltd
 Vortex Minerals Pty Ltd
 Faith At Work (Pty) Ltd
 Geotech Mining Solutions plc

 Licence holder · Nigeria · Gold + lithium










