

Silicon and silver · Company comparison
Silicon Mining Companies: Who Mines, Smelts and Sells
Silicon is smelted from mined quartz. Six companies are compared by role, from quartz to polysilicon, with sourced scale figures. China made about 87% of world silicon metal in 2025 (USGS).
Key takeaways
- China produced an estimated 4,000 of 4,600 thousand tons of world silicon metal in 2025 (USGS, 2026).
- US silicon metal averaged about 130 cents per pound in 2025 (estimate), down from 361.86 in 2022 (USGS, 2026).
- Hoshine listed 1.22 million tons of metallurgical silicon capacity at end-2025 and a CNY 2.991 billion net loss (pv magazine, April 2026).
- Wacker’s polysilicon sales fell to EUR 882.9 million in 2025 from EUR 2,287.2 million in 2022 (Wacker, 2026).
- Silver is a separate business: 26,000 tons mined worldwide in 2025 (USGS). This page is not investment advice.
In this article
- Silicon mining companies compared by role in the chain
- How we chose these companies
- Which countries make silicon metal
- Silicon metal and ferrosilicon prices
- United States trade in silicon metal and ferrosilicon
- What the solar squeeze did to polysilicon sales
- Silver mining stocks are a different business
- Silicon furnace revenue calculator
- What to check before researching a silicon producer
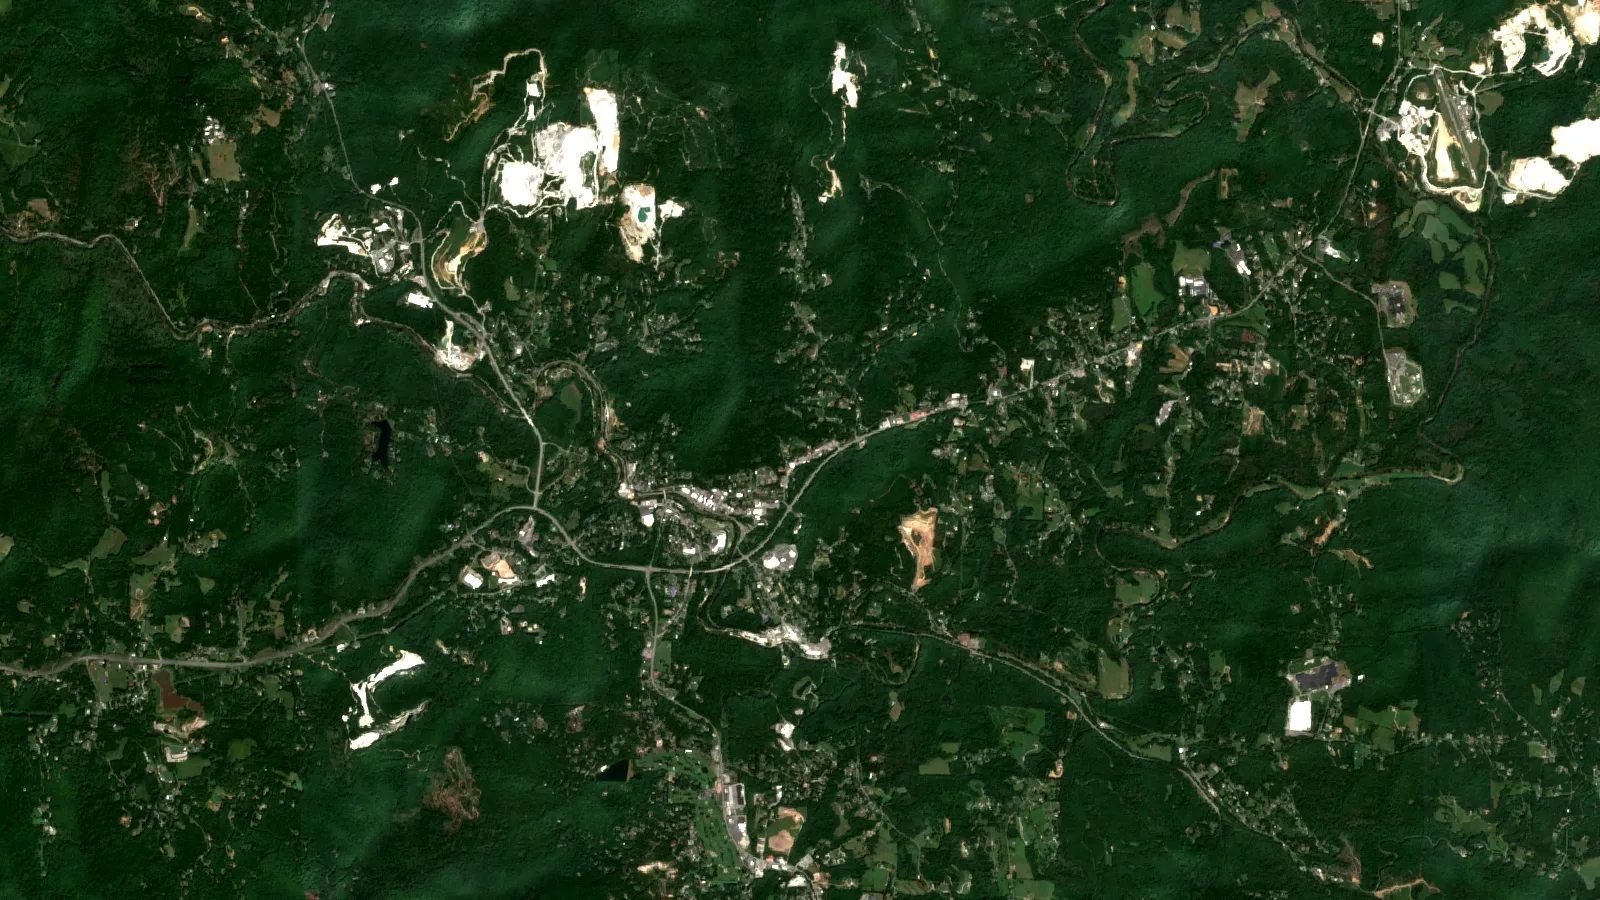
- Finding quartz deposits from space
- Frequently asked questions
Silicon is rarely “mined” in the way gold or copper is. The companies that investors and buyers call silicon miners dig quartz or quartzite (silica rock), smelt it in electric furnaces into silicon metal or ferrosilicon, and some refine it further into polysilicon for solar cells and chips. The USGS says silicon metal and its alloys are made from silica in forms such as quartzite, and that world resources are large enough to supply demand for many decades (USGS Mineral Commodity Summaries, 2026). So the useful question is not “who has the biggest deposit” but “who runs the furnaces, where is the cheap power, and which step of the chain does each company sell”.
This page sorts the main names by their step in the chain, gives one verified scale figure for each, and shows the country, price and trade data behind the sector. It gives facts only. It is not investment advice.
Silicon mining companies compared by role in the chain
The table groups six companies by what they do. The scale column uses the latest figure from a company filing, a company page or a trade-press report of its results, with the date. Figures are not like-for-like: one is capacity, another is output, another is sales. Read each row on its own terms.
Infographic
From quartz to polysilicon in 4 steps
- 1Mine quartzQuartz or quartzite is dug from open pits.
- 2SmeltElectric furnaces turn silica into silicon metal or ferrosilicon.
- 3RefineSilicon metal is purified into polysilicon.
- 4SellAlloys, silicones, solar wafers and chips are the end uses.
| Company | Role in the chain | Listing | Scale figure (source and date) |
|---|---|---|---|
| Hoshine Silicon Industry | Silicon metal, silicones, some polysilicon | Shanghai: 603260 | 1.22 million tons a year of metallurgical silicon capacity at end-2025 (pv magazine, April 2026) |
| Ferroglobe | Silicon metal and silicon alloys, with its own quartz mines | Nasdaq: GSM | About 330,000 tons a year of silicon metal capacity (Form 20-F for 2024) |
| Elkem | Silicon products and carbon solutions | Oslo: ELK | Yongdeng plant in China: 50,000 tons a year of chemical-grade silicon metal (Elkem site) |
| Wacker Chemie | Polysilicon for solar and semiconductors | Frankfurt: WCH | Polysilicon sales of EUR 882.9 million in 2025 (annual report 2025) |
| Daqo New Energy | Polysilicon for solar | NYSE: DQ | 123,652 metric tons of polysilicon produced in 2025 (results, 27 Feb 2026) |
| Sibelco | High-purity quartz from Spruce Pine, North Carolina | Private | US$200 million project to double high-purity quartz capacity, announced 2023 (Sibelco) |
Hoshine Silicon Industry
Best for: readers who want the clearest view of Chinese silicon metal volumes.
Hoshine reported 2025 revenue of CNY 20.499 billion and a net loss attributable to shareholders of CNY 2.991 billion. It blamed disruption in its photovoltaic (PV, solar) business and CNY 1.699 billion of asset impairments. Metallurgical silicon (MG-Si, the grade used in alloys and silicones) brought in CNY 9.077 billion, down 34.05% on 2024. At end-2025 it listed capacity of 1.22 million tons of MG-Si, 1.73 million tons of silicones and 50,000 tons of polysilicon (pv magazine, 17 April 2026).
Pros: large, integrated from silicon metal into silicones. Cons: a heavy loss year, exposure to Chinese solar prices, and reporting in yuan on a Shanghai listing.
Ferroglobe
Best for: readers who want a company that reports in US filings and mines its own quartz.
Ferroglobe files annual reports on Form 20-F with the US SEC. Its Form 20-F for 2024 (filed in 2025) says its facilities could make about 330,000 tons of silicon metal a year, plus capacity for silicon-based and manganese-based alloys, and that it was not running at full capacity. The same filing says quartz is mined at open pits and lists operations in the United States, Spain, France, Canada, South Africa and elsewhere (Ferroglobe Form 20-F exhibit, 2024).
Pros: plants in several countries, quartz supply under its own control. Cons: its own filing says it was not running at full capacity, and it names a power contract at its Alloy, West Virginia plant that was due to expire in 2025.
Elkem
Best for: readers who want a Norwegian-listed silicon producer.
Elkem is listed on the Oslo Stock Exchange under ELK and published its integrated annual report for 2025 on 19 March 2026 (Inderes release). Its own site gives one clear scale figure for the Yongdeng plant in China, which makes chemical-grade silicon metal at 50,000 tons a year using four large electric furnaces (Elkem, Yongdeng). Read the full annual report for plant-by-plant capacity in Norway.
Pros: a listed group that reports silicon products as a stated business line. Cons: the row shows one plant, not group capacity, so it is not a capacity ranking.
Wacker Chemie
Best for: readers focused on semiconductor-grade polysilicon.
Wacker’s polysilicon sales fell 7.0% to EUR 882.9 million in 2025, and segment EBITDA (earnings before interest, tax, depreciation and amortisation) fell 50.3% to EUR 96.2 million. The company said solar-grade volumes fell, while hyperpure semiconductor-grade polysilicon “performed very well”. A new cleaning line in Burghausen started in May 2025 and lifted hyperpure capacity by more than 50% (Wacker Annual Report 2025).
Pros: strength in the higher-purity chip segment. Cons: high German energy costs and weak solar-grade prices hit earnings.
Daqo New Energy
Best for: readers who want a pure solar polysilicon producer reporting in US dollars.
Daqo produced 123,652 metric tons of polysilicon in 2025 and sold 126,707 tons. It guided to 140,000 to 170,000 tons for 2026 (TaiyangNews, 27 February 2026).
Pros: single-product focus, transparent volume guidance. Cons: fully tied to the solar cycle.
Sibelco
Best for: readers who want the quartz-mining end of the chain.
The USGS counted two companies producing high-purity quartz (HPQ) in the United States in 2025, both around Spruce Pine, North Carolina, from pegmatite rock that is also mined for feldspar and mica (USGS quartz summary, 2026). Sibelco is one of them. It announced a US$200 million project in April 2023 to double installed HPQ capacity, described then as planned for completion in 2025 (Sibelco’s page does not report completion), and a larger second stage, estimated at about US$500 million, for 2024 to 2027 (Sibelco).
Pros: access to some of the world’s scarcest quartz. Cons: private, so there are no public shares to follow.
How we chose these companies
We did not rank them. Capacity, output and sales are reported on different bases, and no neutral source lists every producer on one basis. We picked one company for each step of the chain (quartz, silicon metal, polysilicon) with recent published figures: a company filing, a company web page or a dated trade-press report of results. The USGS lists producers in many other countries, including Brazil, Norway and France. Their omission is not a judgement on them.
Which countries make silicon metal
China dominates. The USGS estimates world silicon metal production at 4,600 thousand tons in 2025, of which China made 4,000 thousand tons, about 87%. Brazil (180) and Norway (130) follow far behind. For ferrosilicon, the iron alloy used in steelmaking, China made 3,500 of 5,000 thousand tons (USGS, 2026).
Chart
World silicon metal production by country, 2025 estimate
Thousand metric tons; selected countries
Silicon metal and ferrosilicon prices
The USGS publishes annual average US prices in cents per pound of contained silicon. Silicon metal averaged 220.31 cents per pound in 2021, peaked at 361.86 in 2022 and fell to 130 in 2025 (estimate). Ferrosilicon with 75% silicon went from 192.28 in 2021 to 312.10 in 2022 and 140 in 2025 (estimate). One cent per pound equals about US$22.05 per tonne, so 130 cents per pound is roughly US$2,866 per tonne. These are USGS annual averages, not today’s quotes. Check a current price source before you use any figure in a model.
Chart
US average prices, cents per pound of silicon
Silicon metal and 75% ferrosilicon, annual averages; 2025 is an estimate
United States trade in silicon metal and ferrosilicon
US production figures are withheld by the USGS to protect company data, so trade is the clearest window. Silicon metal imports rose from 97 thousand tons in 2021 to an estimated 180 thousand tons in 2025, while exports fell from 53 to 30. The USGS puts net import reliance for silicon metal above 50% in 2025. Ferrosilicon imports eased from 125 to 110 thousand tons (USGS, 2026). The USGS also notes five ferrosilicon and silicon metal facilities in the country, all east of the Mississippi River, and three polysilicon producers.
Chart
US imports and exports, thousand tons
Silicon metal and ferrosilicon
What the solar squeeze did to polysilicon sales
Polysilicon is the downstream product most exposed to solar demand. Wacker’s polysilicon sales were EUR 1,529.8 million in 2021, EUR 2,287.2 million in 2022 and EUR 1,599.3 million in 2023, then EUR 949.2 million in 2024 and EUR 882.9 million in 2025 (Wacker Annual Report 2025). Wacker linked the sales drop to lower solar-grade volumes and low plant utilisation, and the earnings drop to low prices and higher German energy costs. The IEA reported in 2022 that China’s share of every manufacturing stage of solar PV, including polysilicon, exceeded 80% (IEA, Solar PV Global Supply Chains, 2022). The same pressure shows in Hoshine’s yuan loss and in Daqo’s 2025 net loss of US$170.5 million.
Chart
Wacker polysilicon sales, EUR million
Segment sales, 2021 to 2025
Silver mining stocks are a different business
Silicon and silver share little. Silicon is a high-volume industrial input made in smelters. Silver is a metal mined at low tonnages and traded as an investment asset. The USGS estimates world silver mine production at 26,000 tons in 2025, led by Mexico (6,300 tons), Peru (3,600) and China (3,400). In the United States, silver came from 4 silver mines and 31 base- and precious-metal operations, which shows how much silver is a by-product of other metals. The USGS puts average US bullion at about US$38 per troy ounce for 2025 (estimate), and lists photovoltaics at 15% of estimated domestic uses (USGS silver summary, 2026). Silver miners are valued on reserves, grade and by-product credits, not on furnace capacity. Neither the silicon nor the silver data on this page is a recommendation about any share.
Silicon furnace revenue calculator
The calculator below converts a USGS-style price in cents per pound into a revenue figure for a furnace of your own size. Enter your own capacity, utilisation and price.
Calculator
What is a silicon metal furnace worth per year?
Enter your own capacity, utilisation and price. Results update as you type.
- Output per year (tonnes): 35,000
- Price per tonne (US$): $2,866
Example values only, not benchmarks. The price is an input in US cents per pound: example, use today’s price. One cent per pound equals US$22.0462 per metric tonne. Revenue ignores power, quartz and labour costs.
What to check before researching a silicon producer
- Which step of the chain? Quartz, silicon metal, ferrosilicon and polysilicon have different buyers and prices.
- Capacity or output? A plant that can make 330,000 tons may ship far less in a weak year. Ferroglobe’s own filing says it is not running at full capacity.
- Power contracts. Furnaces run on electric power, so the term and source of the contract matter. Ferroglobe’s filing names one such contract.
- Currency and reporting basis. Yuan, euro, krone and dollar results do not compare without conversion.
- Trade rules. Tariffs and anti-dumping cases change which markets a producer can reach. Check the regulator’s current notices.
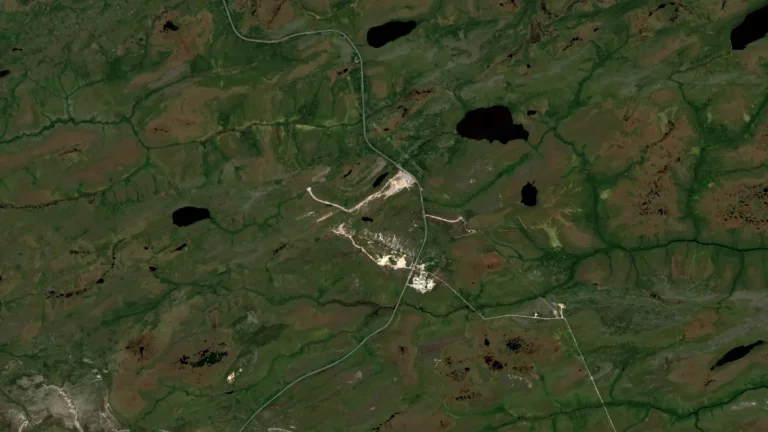
If you hold a quartz or silica licence and want to know what the ground looks like before you drill, a satellite screen is one early step. For a wider read on critical minerals projects, see our guides to spodumene pegmatites in James Bay and tungsten and antimony in Canada.
▶ What satellite exploration can and cannot do when you assess a mining project. · 2:08
Finding quartz deposits from space
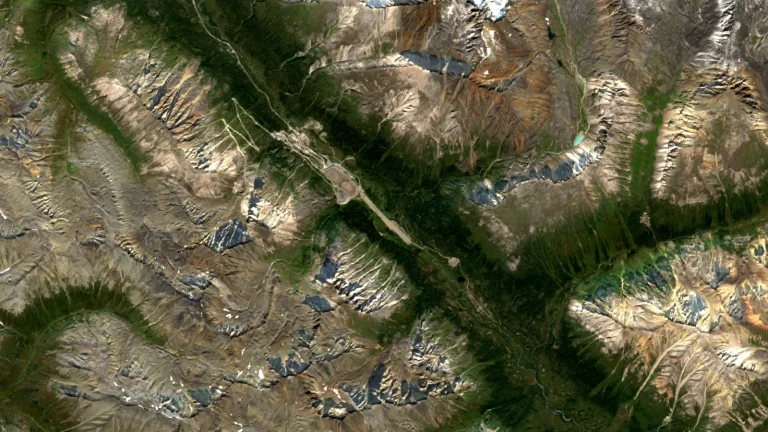
Satellite images can help map rock units, outcrops and access across a licence, but they cannot say how pure the quartz is. Only samples and lab work can. Farmonaut takes a KML, KMZ or polygon of your licence and returns a satellite screen of the area in 5 to 20 business days, as an early-stage step ahead of any resource estimate. You can request a quote or read about satellite-based mineral detection.
▶ A three-minute plain-language explanation of remote sensing for mining. · 2:01
Related reading on this site: Maine Tourmaline Mines: Where to Dig, What It Sells For.
We cover a connected topic in Uranium Royalty Companies: Who Holds Uranium Royalties.
Frequently asked questions
Are there silicon mining companies?
Not in the strict sense. Silicon is made from quartz or quartzite, which is mined, and then smelted. Companies such as Ferroglobe mine their own quartz and smelt it, while others buy quartz from third parties.
Which country produces the most silicon metal?
China. The USGS estimates 4,000 thousand tons of a world total of 4,600 thousand tons in 2025, with Brazil and Norway next.
What is the difference between silicon metal and ferrosilicon?
Silicon metal is nearly pure silicon, used in aluminium alloys, silicones and, after further refining, polysilicon. Ferrosilicon is an iron-silicon alloy, mostly used in steel and foundries, according to the USGS.
What is polysilicon?
Polysilicon is ultra-pure silicon made from silicon metal. It is the raw material for solar wafers and chips. Three companies made it in the United States in 2025, per the USGS.
What is high-purity quartz?
The USGS defines it as natural quartz with under 100 parts per million of impurities, or 99.99% purity. It is used for crucibles that hold molten silicon, fibre optics and lamp tubing.
How much does silicon metal cost?
The USGS gives an estimated 2025 average of 130 cents per pound in the United States, about US$2,866 per tonne. Prices moved from 361.86 cents per pound in 2022, so check a current quote.
Is the United States self-sufficient in silicon metal?
No. The USGS estimates imports of 180 thousand tons in 2025 against exports of 30 thousand, and net import reliance above 50%.
Why are polysilicon companies losing money?
Wacker and Hoshine cited low prices or weak demand, and Daqo cited industry excess capacity, in their 2025 reporting. Wacker’s hyperpure semiconductor-grade business performed very well.
Are silicon and silver stocks the same kind of investment?
No. Silicon producers earn money from smelting and refining volumes, while silver miners depend on ore grade, by-product credits and the silver price.
Where can I check a company’s figures?
Use its annual report, a Form 20-F or 10-K on the SEC’s EDGAR system, or the exchange filing page. Trade-press summaries are a starting point only. This page is not investment advice.
This page is for information only. Not investment advice. It names companies for context and does not recommend buying or selling any share. Licence rules, local law and site safety are not covered here; confirm them with the regulator and get permission before entering land.
Farmonaut mining
Get a quote to screen your licence area from space
Send a KML, KMZ or polygon and get a satellite screen of your quartz or mineral licence before ground crews go in.

Mining Pro sample view, synthetic data
Keep reading
Sources
- USGS, Mineral Commodity Summaries 2026: silicon: pubs.usgs.gov
- USGS, Mineral Commodity Summaries 2026: quartz: pubs.usgs.gov
- USGS, Mineral Commodity Summaries 2026: silver: pubs.usgs.gov
- pv magazine, Hoshine Silicon 2025 results (17 April 2026): pv-magazine.com
- Ferroglobe, Form 20-F exhibit (2024): sec.gov
- Inderes, Elkem integrated annual report for 2025: inderes.se
- Elkem, Yongdeng plant: elkem.com
- Wacker Chemie, Annual Report 2025: Polysilicon: reports.wacker.com
- TaiyangNews, Daqo New Energy Q4 2025 results: taiyangnews.info
- Sibelco, Spruce Pine high-purity quartz expansion: sibelco.com
- IEA, Solar PV Global Supply Chains (2022): iea.org
Discussion
Questions, corrections or field experience? Share them below. First-time comments are reviewed before they appear, and your email is never published.
No comments yet. Be the first to add a question or your experience.

 Congo Mining Solutions
 Mining SARL
 SenGold Invest SAS
 Sania Corporation
 Sean Mining Limited
 NTS Group (Pty) Ltd
 Mine4Africa
 Lithspo Minerals Limited
 Tintina Mining Group
 Dalgety Minerals Pty Ltd
 Vortex Minerals Pty Ltd
 Faith At Work (Pty) Ltd
 Geotech Mining Solutions plc
 Vulcan International Limited
 Kidepo Associates
 GKY Mining
 Alkimy SARL
 Double A Trading
 GemSprout Metals Limited
 Qader Group
 Ileys General Trading
 SG Gold Mining LLC
 VRV Global Pte Ltd











