

US uranium · Mine status guide
Uranium Mines in the United States: Status and Output
Nine US uranium mines and sources reported output in 2025, seven of them in-situ recovery wellfields. This guide sorts producers, standby plants and projects, with EIA output, cost and price data and a margin calculator.
Key takeaways
- The EIA counted 9 US uranium mines and sources in 2025, 7 of them ISR; concentrate output was 2.1 million lb U3O8, over three times 2024 (EIA, June 2026).
- ISR plants had 13.3 million lb a year of operating capacity, 8.8 million on standby and 10.5 million planned at the end of 2025 (EIA).
- US-origin uranium was 7% of deliveries to US reactors in 2025; Canada supplied 32%, Kazakhstan 28% and Australia 15% (EIA, August 2026).
- Spot uranium was about US$90 a lb on 14 October 2026 and long-term contracts US$96.50 at end September (Trading Economics; Cameco).
- Smith Ranch-Highland is listed as operating by the EIA, yet Cameco reports no commercial production since 2018.
In this article
- Which US uranium mines are producing
- Mines on standby, in restoration or in development
- How much uranium the US mines produce
- Which states have uranium mines
- How in-situ recovery and underground mines differ
- Uranium prices and what they mean for US mines
- Rules and legacy issues that shape new mines
- Reading a producer's quarterly report
- How to check a mine's status yourself
- Where satellite screening fits in uranium exploration
- Frequently asked questions
Nine uranium mines and recovery sources reported production in the United States in 2025, and seven of them were in-situ recovery (ISR) wellfields, according to the US Energy Information Administration (EIA) Domestic Uranium Production Report published in June 2026. Together the country’s plants made about 2.1 million pounds of uranium concentrate (U3O8, also called yellowcake), more than three times the 657,000 pounds of 2024. This page lists who is producing, who is on standby and what is being built, with the output, cost and price data behind each group.
A quick unit note for investors and licence holders: uranium is sold by the pound of U3O8, while government surveys often use tonnes of uranium metal (tU). One pound of U3O8 holds about 0.385 kg of uranium metal, calculated from the molar masses. Grade is the percentage of U3O8 in the rock, and a pound count without a date or a source tells you very little, so every figure below carries both.
Which US uranium mines are producing
The table combines the EIA’s end-of-2025 facility status with the latest company reports we opened. EIA lists a plant as operating when it was usually producing concentrate at year end. That is not the same as commercial mining, and the Smith Ranch-Highland row shows why.
| Operation | State | Operator | Method | Latest status (source date) |
|---|---|---|---|---|
| Lost Creek | Wyoming | Ur-Energy | ISR | Operating; 140,873 lb U3O8 drummed in Q2 2026, a quarterly record since ramp-up began in 2022 (company, 10 Aug 2026) |
| Shirley Basin | Wyoming | Ur-Energy (EIA names Pathfinder Mines Corporation as owner) | ISR | Final state approval for full production in late June 2026; loaded resin goes to Lost Creek for processing (company, 10 Aug 2026) |
| Christensen Ranch and Irigaray plant (Willow Creek project) | Wyoming | Uranium Energy Corp (UEC) | ISR | Restarted August 2024; first dried and drummed concentrate in February 2025 (World Nuclear Association) |
| Ross central plant (Lance project) | Wyoming | Strata Energy, a Peninsula Energy subsidiary | ISR | Operating at end 2025 (EIA); Peninsula withdrew its 2026 output guidance on 22 July 2026 after a slower wellfield ramp-up, and reconfirmed 2027 guidance of 500,000-600,000 lb (ASX announcement, 22 July 2026) |
| Smith Ranch-Highland | Wyoming | Cameco | ISR | Plant listed as operating by EIA, but Cameco reports no commercial production since 2018 and a 2026 production outlook of zero |
| Alta Mesa | Texas | enCore Energy | ISR | Operating; 131,274 lb extracted in the first half of 2026, down from 317,613 lb a year earlier; Wellfield 7 due to stop recovery in Q3 2026 (company, 13 Aug 2026) |
| Burke Hollow | Texas | UEC | ISR | Standby in the EIA’s end-2025 table; UEC reports 17,352 lb produced there in its fiscal fourth quarter to July 2026 |
| Pinyon Plain, La Sal and Pandora | Arizona (Pinyon Plain); Utah (La Sal, Pandora) | Energy Fuels | Underground | 315,000 lb of contained U3O8 mined in Q2 2026 and 740,000 lb in the first half (company, 5 Aug 2026) |
| White Mesa Mill | Utah | Energy Fuels | Conventional mill | The only conventional uranium mill operating in the US; 1,015,000 lb U3O8 produced in 2025 (World Nuclear Association) |
Two things stand out. First, ISR dominates the list: wells and surface plants, not shafts. Second, Ur-Energy describes itself as the largest US ISR producer, and UEC is described by the World Nuclear Association as the largest US uranium mining company following a series of acquisitions. Those are different measures, so we do not rank the operators against each other.
Mines on standby, in restoration or in development
Most US capacity is not running. The EIA counted five ISR plants on standby at the end of 2025 with 8.8 million pounds of U3O8 a year of capacity, and seven planned plants in South Dakota, Texas and Wyoming with 10.5 million pounds. Operating plants had 13.3 million pounds, down from 14.1 million in 2024.
Chart
US ISR plant capacity by status, end of 2025
Million pounds U3O8 per year
- Nichols Ranch (Wyoming, Energy Fuels): standby, 2 million lb a year of capacity; Energy Fuels said in 2024 it was preparing a restart (World Nuclear Association).
- Crow Butte (Nebraska, Cameco): in wellfield restoration, 1 million lb of capacity. Cameco applied in September 2024 for a 20-year licence renewal.
- Rosita (Texas, enCore): standby at end 2025. enCore expects start-up from the Upper Spring Creek wellfield once final permits arrive.
- Hobson plant and La Palangana (Texas, UEC): standby; Goliad, Reno Creek, Moore Ranch and Sweetwater (Wyoming) are permitted and licensed but not producing.
- Dewey-Burdock (South Dakota, enCore): listed as developing, 1 million lb a year of planned capacity.
- Sunday Mine Complex (Colorado, Western Uranium & Vanadium): five permitted mines in San Miguel County. Western delivered about 1,600 tons of mined material to White Mesa from late June to September 2025, then paused; none were delivered in the first half of 2026 (company Q2 2026 MD&A).
- Shootaring Canyon mill (Utah, Anfield Resources): standby, 750 short tons of ore a day. Sheep Mountain in Wyoming is partly permitted and licensed.
EIA statuses are snapshots at 31 December 2025; the company reports dated June to September 2026 in the table above show what changed since.
How much uranium the US mines produce
US output peaked at 16,800 tU in 1980, when more than 250 mines were working; by 1984 there were about 50 (World Nuclear Association). Production then slid for decades. In 2024 the US supplied 0.4% of world production and held 2.5% of global uranium resources, per the same fuel-cycle profile. The chart shows the long slide and the 2024-2025 recovery in concentrate output.
Chart
US uranium concentrate production, selected years
Thousand pounds U3O8 (2020 withheld by EIA)
Mine output and concentrate output are different series. The EIA reports 1.39 million pounds of total mine production in 2025 but 2.11 million pounds of concentrate, because mills also recover uranium from stockpiles, alternate feed and restoration solutions. Domestic producers sold 1.19 million pounds in 2025 at a weighted-average US$68.45 a pound.
Reactor buyers still rely on imports. Of the U3O8 delivered to US plants in 2025, Canada supplied 32%, Kazakhstan 28% and Australia 15%, while US-origin material was 7% (EIA Today in Energy, 28 August 2026). Nuclear plants have supplied about 20% of US electricity generation since 1990 (EIA).
Activity is rising from a low base. Exploration drilling reached 1,824 holes and development drilling 3,708 holes in 2025, the most holes since 2012. Industry employment was 711 person-years, up 41%, and spending was US$234.7 million, the highest since 2014.
Which states have uranium mines
- Wyoming: the main producing state. Most US output comes from the Powder River Basin, and Wyoming accounted for 348 of the industry’s 711 person-years in 2025. Wyoming became an NRC agreement state in 2018, so the state regulates ISR mining.
- Texas: south Texas ISR wellfields, with Alta Mesa producing and Burke Hollow starting.
- Utah, Colorado and Arizona: Colorado Plateau sandstone mines and northern Arizona breccia pipes, all hauled to White Mesa. Pinyon Plain began mining in December 2023 and produced ore with about 1.53 million lb of U3O8 at 1.62% in 2025, among the highest grades in US history.
- Nebraska: Crow Butte, in restoration.
- New Mexico: about 40% of US resources, suited to ISR, but no production; enCore sold its New Mexico assets to Verdera Energy in April 2025. See our guide to New Mexico districts, claims and the Mining Act and the Colorado claim and permit guide for the land rules that apply to uranium claims too.
- South Dakota: Dewey-Burdock, licensed but not yet built.
How in-situ recovery and underground mines differ
ISR dissolves uranium where it lies in a sandstone aquifer and pumps the solution out; it is the method with the least surface disturbance, and it is not licensed where drinking water is at risk (World Nuclear Association). Worldwide about 52% of uranium comes from ISR and 44% from conventional mines. Underground mines such as Pinyon Plain suit narrow, high-grade pipes and trucked ore.
Infographic
How an ISR operation works in 4 steps
- 1InjectWells pump a leach solution into the uranium-bearing sandstone aquifer.
- 2RecoverProduction wells pump the uranium-rich solution to the surface.
- 3CaptureIon-exchange resin at the plant takes up the dissolved uranium.
- 4RestoreGroundwater is restored to its pre-mining quality or an equivalent use class.
Chart
Reported 2026 costs per pound against spot
US$ per lb U3O8; company definitions differ
ISR groundwater must be restored afterwards. Cameco’s 2025 annual information form says restoration aims at pre-mining quality or an equivalent use class, and it puts decommissioning at US$252.4 million for Smith Ranch-Highland and US$68.2 million for Crow Butte, a reminder that closure is part of the cost.
Costs differ by operator and by definition. The chart compares the figures companies reported in 2026 against the spot price. The definitions are not identical, so treat it as a range, not a ranking.
Uranium prices and what they mean for US mines
Trading Economics showed uranium at about US$90 a pound on 14 October 2026, up 12.6% on a year earlier. Cameco’s month-end series gives a spot price of US$89.63 and a long-term contract price of US$96.50 at the end of September 2026, above the 2007 peak of US$95 (Cameco). Long-term prices matter more to producers because utilities sign contracts years ahead. The EIA says US reactor owners paid a weighted-average US$58.46 a pound in 2025 across all purchases.
Chart
Uranium spot and long-term prices, year-end and September 2026
US$ per lb U3O8; last point is 30 September 2026
The calculator below turns a pound count, a price, a cash cost and a royalty into a simple annual margin. It is a before-tax, before-capital screen, not a valuation.
Calculator
What margin could an ISR wellfield earn?
Enter your own pounds, price, cost and royalty.
- Revenue (US$): $45,000,000
- Margin per pound: 40.50 US$/lb
- Uranium metal in that output: 192.3 tU
Example values only, not any company’s figures. The example cost sits near the US$34-57 per lb range reported by US producers in 2026 (UEC, Ur-Energy, enCore). The price is an input: example, use today’s price. Result is before tax, capital and closure costs. 0.3847 kg U per lb U3O8 is calculated from molar masses.
Rules and legacy issues that shape new mines
- Permitting: most producing states are agreement states that issue their own licences; the NRC role is then small, and the Bureau of Land Management reviews federal land (World Nuclear Association).
- Grand Canyon region: on 8 August 2023 a national monument covering nearly 4,000 square km permanently barred new uranium mining claims there. Existing valid claims are not affected. In April 2026 the Ninth Circuit dismissed Arizona’s appeal.
- Russian supply: a May 2024 law banned imports of Russian-produced unirradiated low-enriched uranium (LEU) from August 2024, with waivers possible until 1 January 2028 (World Nuclear Association).
- Abandoned mines: the EPA counts over 500 abandoned uranium mines on and near the Navajo Nation, where nearly 30 million tons of ore were extracted between 1944 and 1986 (US EPA). Current projects are judged against that record.
Reading a producer’s quarterly report
US producers report several pound counts that mean different things, and mixing them up is the commonest mistake in reading this sector. Drummed pounds are concentrate packed at the plant. Shipped pounds have left for the conversion facility. Sold pounds are delivered into contracts and bring in revenue. Inventory is what is left in between.
Ur-Energy’s second-quarter 2026 release shows all four. It drummed 140,873 lb, shipped 149,747 lb and sold 215,000 lb for US$14.4 million of product sales, at a cash cost of US$40.20 a pound sold, and it held 348,292 lb of finished inventory at the conversion facility. Sales can exceed production in a quarter because pounds come out of inventory or from purchases.
enCore’s first-half 2026 numbers show the purchased-pound effect. It delivered 485,000 lb at an average US$70.10, but only 131,274 lb were extracted; the rest came partly from 360,000 purchased pounds, which lifted the weighted average cost of delivered uranium to US$75.54 a pound. UEC reported fiscal 2026 sales of 400,000 lb from inventory at US$93.13 a pound, production of 229,294 lb, and 1.256 million lb of inventory at 31 July 2026. Compare cost per pound only with the same definition: cash cost, total cost, extraction cost and delivered cost are not interchangeable.
Three questions help with any release: how many pounds were produced versus bought, how many wellfields are in recovery and when the next ones are permitted, and how much of next year’s output is already sold under contract at what price.
How to check a mine’s status yourself
- Open the EIA Domestic Uranium Production Report and read the facility status tables for mills and ISR plants.
- Read the operator’s latest quarterly report for pounds drummed, wellfields and permits.
- Check the state regulator and NRC licence status for restarts.
- Compare the stated cash cost with the spot and long-term prices.
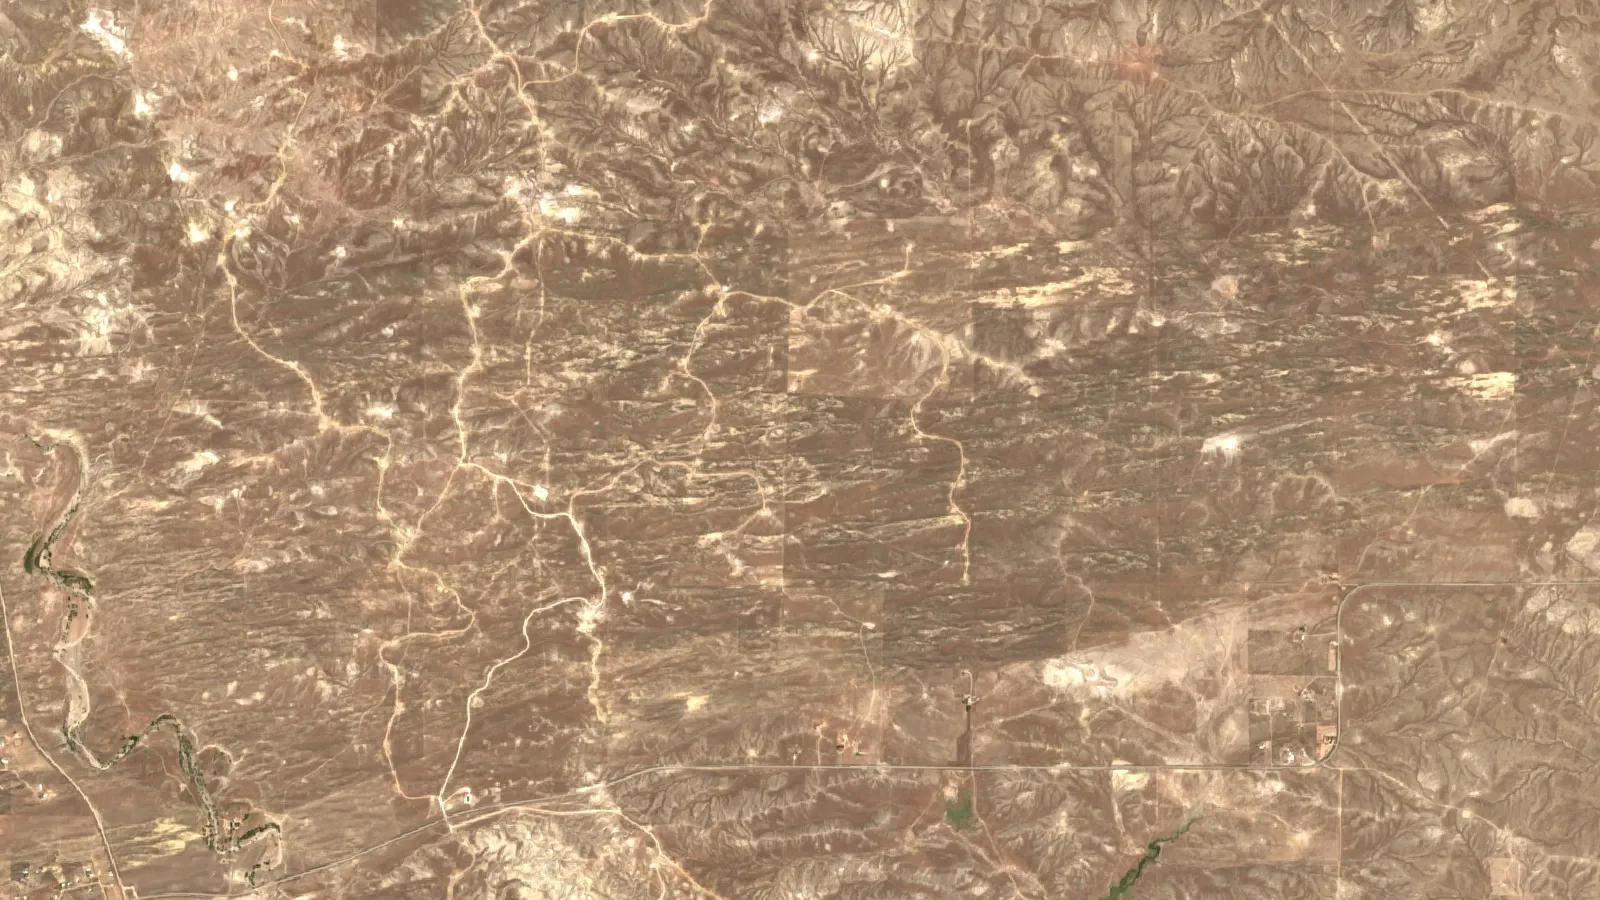
- Look at the ground: wellfield layouts and header-house footprints show up in recent satellite imagery.
For more on US ground, see our guides to US deposits by state and satellite exploration in the United States.
▶ Explains remote sensing for mining in three minutes, including why agreement between instruments matters. · 2:01
Where satellite screening fits in uranium exploration
Satellite data does not measure uranium directly. It maps alteration, clays, iron staining and structure that can point to ground worth sampling. Farmonaut screens licence areas for uranium and more than 20 other minerals from satellite data and returns exploration targets in 5 to 20 business days, ahead of any resource estimate and not as JORC or NI 43-101 work. See the satellite mineral detection service, send a licence outline through the mining query form or contact the team.
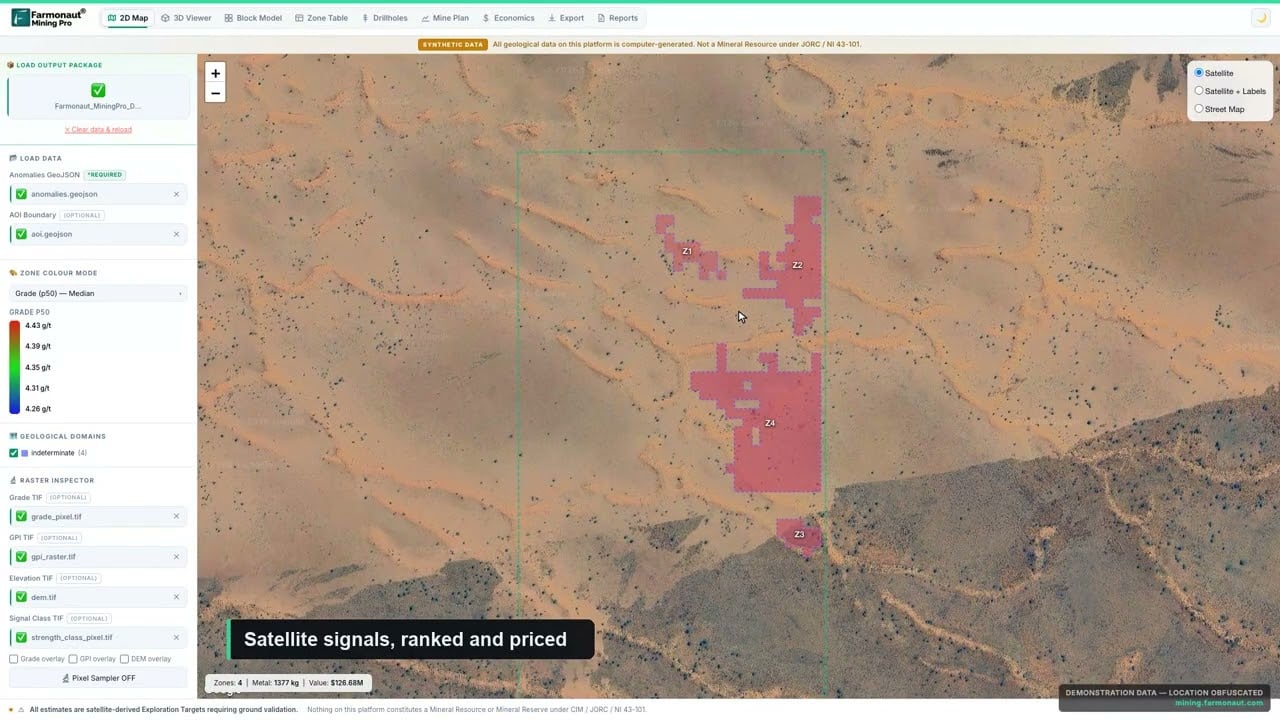
▶ A quick look at Farmonaut Mining Pro, which turns a licence boundary into a geological and economic picture (de-identified demo data). · 4:56
For a closer look at a related question, see our guide: US Mining Industry by State: Value, Jobs, Top Minerals.
If this topic matters to you, read Uranium in Niger: Mines, Output and France Supply next.
Frequently asked questions
How many uranium mines are there in the United States?
The EIA counted nine operating mines and sources in 2025: one underground mine, seven ISR operations and one other source such as mine-water recovery. That compares with eight in 2024 and three in 2021.
Which US state produces the most uranium?
The EIA withholds state production figures to protect company data. Wyoming has the most ISR plants and 348 of the industry’s 711 person-years in 2025.
What is the largest uranium mine in the United States?
It depends on the measure. Smith Ranch-Highland has the largest licensed plant capacity at 5.5 million lb a year, but Cameco reports no commercial production there since 2018. Ur-Energy calls itself the largest producing ISR operator.
Is Smith Ranch-Highland still producing uranium?
No. Cameco’s 2025 annual information form reports 0.1 million lb for 2025 from its two US ISR operations together (Smith Ranch-Highland and Crow Butte) and a zero outlook for 2026. Commercial production stopped in 2018 after the 2016 curtailment, and both sites are on care and maintenance.
What does ISR mean?
In-situ recovery, also called in-situ leach. Wells pump solution through the ore zone, and the dissolved uranium is captured at a surface plant.
How much uranium does the US import?
US-origin uranium was 7% of U3O8 deliveries to US reactors in 2025. Canada, Kazakhstan and Australia supplied 75% between them.
Why did US uranium production nearly stop?
Low prices. Cameco curtailed its US ISR operations in 2016, and EIA concentrate output fell to 21,000 lb in 2021. Output recovered after prices rose.
Are there uranium mines near the Grand Canyon?
Pinyon Plain in northern Arizona began mining in December 2023. The 2023 monument bars new claims in the withdrawal area, while valid existing claims continue.
What is the uranium price today?
About US$90 a pound on 14 October 2026, up 12.6% on a year earlier (Trading Economics). Cameco’s month-end spot price was US$89.63 on 30 September 2026.
Can satellites find uranium?
They screen for surface clues such as alteration and structure; drilling and sampling confirm any deposit. Treat satellite results as targets, not resources.
This page is for information only. It is not investment advice or legal advice. It names companies for facts only and gives no price targets. Confirm licences and claim rules with the regulator.
Farmonaut mining
Screen a licence area from space
Investors can see how satellite data screens a licence area for uranium and other minerals as an exploration target, ahead of a resource estimate.

Mining Pro sample view, synthetic data
Keep reading
Sources
- US EIA, 2025 Domestic Uranium Production Report (June 2026): eia.gov
- US EIA, Today in Energy: US uranium production more than tripled in 2025 (28 Aug 2026): eia.gov
- US EIA, Nuclear explained: US nuclear industry: eia.gov
- World Nuclear Association, US Uranium Mining and Exploration (updated 10 Apr 2026): world-nuclear.org
- World Nuclear Association, US Nuclear Fuel Cycle (updated 1 Oct 2026): world-nuclear.org
- World Nuclear Association, Uranium Mining Overview: world-nuclear.org
- Cameco, 2025 Annual Information Form: cameco.com
- Cameco, Uranium Price (month-end spot and long-term): cameco.com
- Trading Economics, Uranium price: tradingeconomics.com
- Ur-Energy, Second Quarter 2026 Results (10 Aug 2026): ur-energy.com
- enCore Energy, Q2 2026 Financial Results (13 Aug 2026): prnewswire.com
- Energy Fuels, Q2-2026 Results (5 Aug 2026): investors.energyfuels.com
- Uranium Energy Corp, Reports Fiscal 2026 Results (29 Sep 2026): prnewswire.com
- Western Uranium & Vanadium, Q2 2026 MD&A: western-uranium.com
- Peninsula Energy ASX announcement, 22 July 2026 (Operational and Production Guidance Update): newswire.iguana2.com
- US EPA, Navajo Nation Abandoned Uranium Mines Cleanup: epa.gov
Discussion
Questions, corrections or field experience? Share them below. First-time comments are reviewed before they appear, and your email is never published.
No comments yet. Be the first to add a question or your experience.

 Vortex Minerals Pty Ltd
 Faith At Work (Pty) Ltd
 Geotech Mining Solutions plc
 Vulcan International Limited
 Kidepo Associates
 GKY Mining
 Alkimy SARL
 Double A Trading
 GemSprout Metals Limited
 Qader Group
 Ileys General Trading
 SG Gold Mining LLC
 VRV Global Pte Ltd
 Omsri International FZE
 G.I.T.T.
 Jaunita Erss Ltd
 Almosi SARL
 SRK Consulting
 Berks Gold Limited
 Mwerezi Minerals Company Limited
 Mining SARL
 SenGold Invest SAS
