

Witwatersrand · Location, geology and mines
Witwatersrand Gold Mines: Location, Geology, Output
The Witwatersrand is in South Africa and has produced over 40,000 tonnes of gold since 1886. This page maps the six goldfields, explains the geology and lists the operating mines with owners and their latest published output.
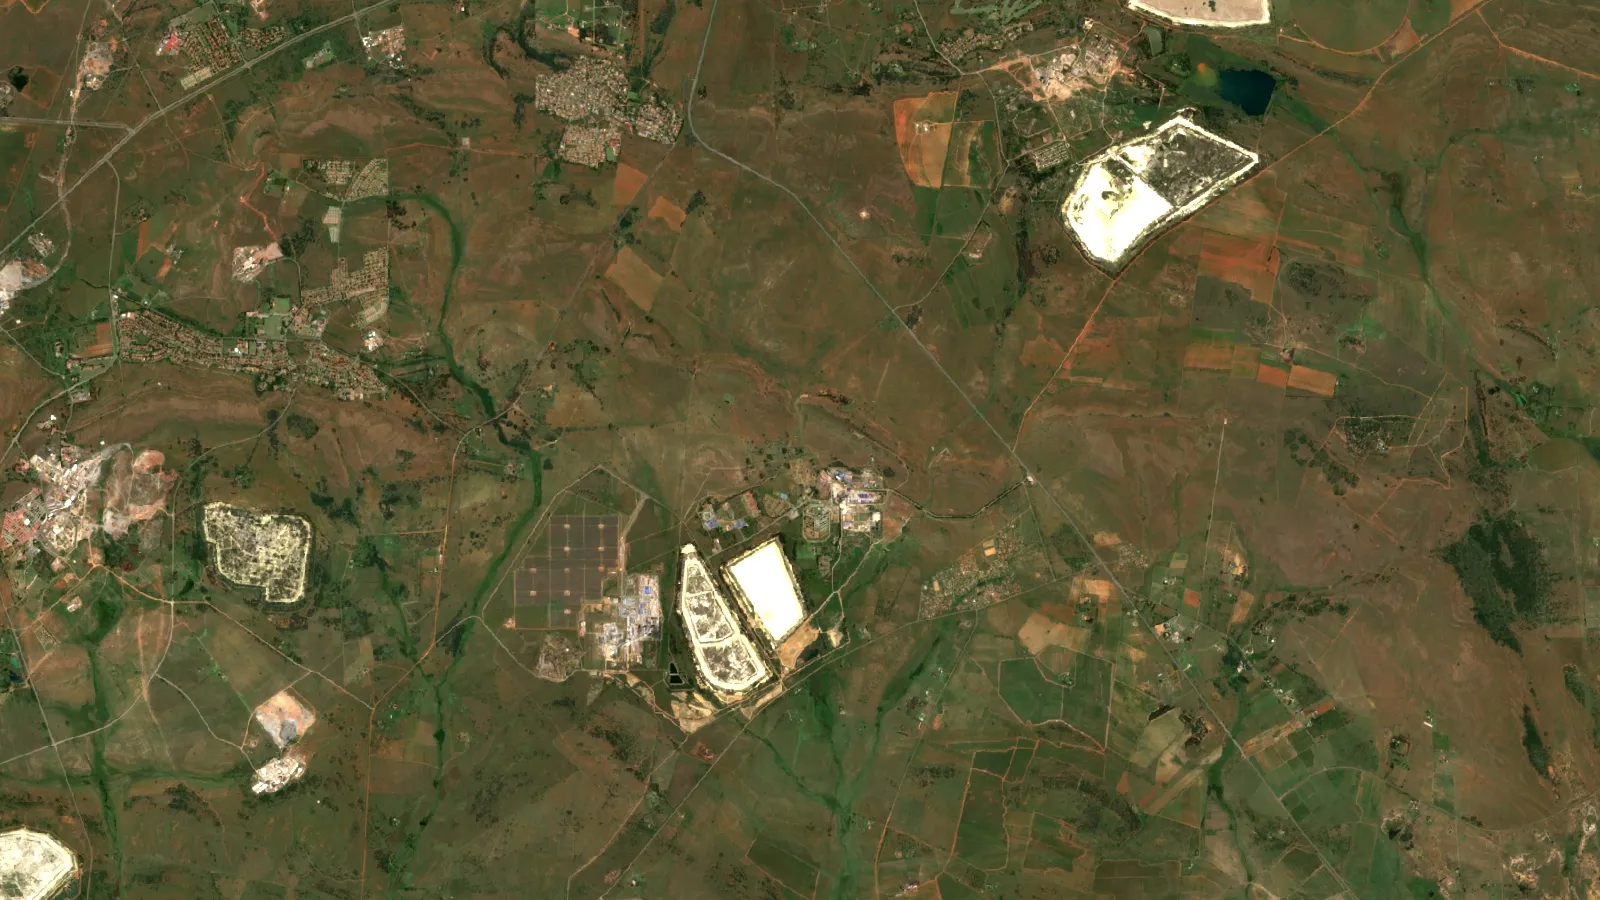
Key takeaways
- The Witwatersrand Basin, about 300 km by 150 km around Johannesburg, has produced over 40,000 tonnes of gold, about 22% of all gold accounted for (Wikipedia, Witwatersrand).
- Gold sits in six goldfields: Welkom, Klerksdorp, Carletonville, West Rand, East Rand and Evander.
- Mponeng (Harmony) produced 9,561 kg and South Deep (Gold Fields) 9.7 t in the latest reported years.
- South Africa mined about 90 tonnes in 2025, about 2.7% of the world total of 3,300 tonnes (USGS, 2026), down from a 1970 peak near 1,000 tonnes.
- Surface retreatment of old tailings and the 2025 opening of Qala Shallows now shape new supply.
In this article
- Where is the Witwatersrand gold field?
- Geology: how the Witwatersrand gold formed
- History of Witwatersrand gold mining
- Witwatersrand gold mines operating today
- Who owns the Witwatersrand mines?
- How output compares across Harmony's Witwatersrand mines
- Deep mining: how deep are the Witwatersrand mines?
- Surface retreatment: gold from the old dumps
- How much gold does South Africa produce today?
- What is a tonne of Witwatersrand ore worth?
- Environmental legacy: acid mine drainage
- Prospecting and licences on the Witwatersrand
- Frequently asked questions
The Witwatersrand gold field is in South Africa, in an arc around Johannesburg that reaches into North West and Mpumalanga provinces and south to the Welkom area. Its rocks have produced more than 40,000 tonnes of gold since 1886, about 22% of all the gold ever accounted for, according to the Witwatersrand entry on Wikipedia. Today South Africa mines about 90 tonnes a year in total, and most of it still comes from Witwatersrand reefs and from the old dumps beside them (USGS, Mineral Commodity Summaries 2026). This guide covers where the basin is, how the gold formed, how the rush began, and which mines are working now, with owners and the latest published output.
Where is the Witwatersrand gold field?
The field lies in South Africa. The name Witwatersrand means “white water ridge” in Afrikaans and first referred to a 56-kilometre quartzite ridge that runs from Bedfordview through Johannesburg and Roodepoort to Krugersdorp. Locals call the region “the Rand”, and South Africa’s currency, the rand, took its name from it in 1961 (Wikipedia, Witwatersrand).
The ridge is only the rim. The gold sits in the Witwatersrand Basin, a mostly buried, oval structure about 300 kilometres long (Evander in the north-east to Theunissen in the south-west) and about 150 kilometres wide. Gold is not spread across all of it. It occurs along the northern and western margins, in six separate goldfields, listed here clockwise from the west.
| Goldfield | Where | Mines and operators named in this guide |
|---|---|---|
| Welkom | South-west of the basin, around Welkom | Harmony (Tshepong North and South, Masimong, Joel, Target 1, Phoenix); Sibanye-Stillwater (Beatrix) |
| Klerksdorp | North West | Harmony (Moab Khotsong, Mine Waste Solutions) |
| Carletonville (West Wits Line) | Gauteng and North West border | Harmony (Mponeng, Kusasalethu); Sibanye-Stillwater (Driefontein); DRDGOLD (Far West Gold Recoveries) |
| West Rand | Gauteng | Gold Fields (South Deep); Sibanye-Stillwater (Kloof); West Wits Mining (Qala Shallows); Harmony (Doornkop) |
| East Rand | Gauteng | DRDGOLD (Ergo, Brakpan) |
| Evander | Mpumalanga | Pan African Resources (Evander Gold Mines) |
The six names come from the Witwatersrand entry; mine placement follows the lists on Harmony’s South Africa page and company reports cited below. A “Witwatersrand gold mines map” is therefore a map of an arc, not a single mine: the older Central Rand mines under Johannesburg are largely worked out, and production has moved to deeper ground west and south-west of the city and to the Welkom area.
Searchers often ask “in which country is the Witwatersrand?” and whether there is one “Witwatersrand mine”. The answers are South Africa, and no: there are dozens of mines and surface plants, run by several companies, that all mine the same group of rocks.
Geology: how the Witwatersrand gold formed
The Witwatersrand Supergroup is a pile of sedimentary rock 5 to 7 kilometres thick, laid down over about 260 million years, starting roughly 2.97 billion years ago. Most of the gold is in the upper part, the Central Rand Group, inside thin layers of quartz-pebble conglomerate that miners call reefs (the local name for the rock is banket). Conglomerate is cemented gravel; a reef is a gold-bearing layer of it, often only a metre or two thick (Wikipedia, Witwatersrand). Well-known reefs include the Main Reef at Johannesburg, the Carbon Leader and the Ventersdorp Contact Reef, the last two mined at Mponeng (Wikipedia, Mponeng).
How the gold got there has been argued for more than a century. The leading view is the “modified palaeoplacer” model: gold washed in by ancient rivers and concentrated in braided river channels where they met the sea, then partly redistributed later by fluids. A 2015 review in Mineralium Deposita by Frimmel and Hennigh supports a mainly synsedimentary (placer) origin for the main stage of mineralisation, with some local reworking by hot fluids (Frimmel and Hennigh, 2015).
Two later events shaped what miners work today. Ventersdorp lavas erupted about 2.7 billion years ago and capped the basin. About 2.02 billion years ago a large meteorite struck near what is now Vredefort, roughly 110 kilometres south-west of Johannesburg. The impact tilted and exposed the basin edge around Johannesburg, while the same gold-bearing layers dip deep underground elsewhere, in places 4 kilometres down. Uranium, silver and iridium come out as by-products of the gold (Wikipedia, Witwatersrand).
History of Witwatersrand gold mining
Gold had been found elsewhere in South Africa, at Barberton and Pilgrim’s Rest, but it was loose river gold or quartz-vein gold. The Witwatersrand find in 1886 was different: gold in conglomerate that continued downdip. George Harrison, probably with George Walker, found it on the farm Langlaagte, about 5 kilometres west of the site of Johannesburg. In September 1886 President Paul Kruger proclaimed nine farms public diggings, and the rush began (Wikipedia, Witwatersrand).
| Date | Event |
|---|---|
| 1886 | Gold found at Langlaagte; diggings proclaimed on 20 September; Johannesburg grows around the Main Reef |
| 1887 | Cecil Rhodes and his brother Frank form the Goldfields of South Africa Company |
| 1898 | 77 mines produce about 4.3 million ounces |
| 1910 | 63 mines produce about 7.2 million ounces |
| 1970 | South African output peaks at about 1,000 tonnes a year |
| 2000s | Old mine workings fill with water: the Western Basin begins to decant in 2002, and pumping stops in the Central Basin in 2008 and the Eastern Basin in 2011 |
| Recent | Output near 90 tonnes a year; dumps and tailings become a major source |
The early output figures come from the table in the Witwatersrand entry, the 1887 company from the South African History Online profile of Cecil Rhodes, and the 1970 peak from a Reuters report carried by Miningmx. The fall since then has the causes Reuters lists: dwindling reserves, labour unrest and very deep, hard rock.
Witwatersrand gold mines operating today
The table lists the main producers of Witwatersrand gold, with owner, goldfield and the latest figure each company has published. Years differ by company: Harmony and DRDGOLD report for the year to 30 June 2026, Sibanye-Stillwater and Gold Fields for calendar 2025. One tonne is about 32,150 troy ounces.
Chart
Gold output of the largest Witwatersrand operations
Tonnes, latest reported year (Harmony and DRDGOLD: year to June 2026; Gold Fields and Sibanye-Stillwater: 2025)
| Mine or plant | Owner | Goldfield | Latest published output |
|---|---|---|---|
| Mponeng | Harmony | Carletonville | 9,561 kg (307,392 oz), year to June 2026 |
| South Deep | Gold Fields | West Rand | 9.7 t (313,000 oz), 2025 |
| Driefontein | Sibanye-Stillwater | Carletonville | 7,216 kg (232,000 oz), 2025 |
| Moab Khotsong | Harmony | Klerksdorp | 5,182 kg (166,605 oz), year to June 2026 |
| DRDGOLD (Ergo and Far West Gold Recoveries) | DRDGOLD | East and West Rand, surface | 4,839 kg, year to June 2026 |
| Tshepong North | Harmony | Welkom | 3,977 kg (127,864 oz), year to June 2026 |
| Beatrix | Sibanye-Stillwater | Welkom | 3,582 kg (115,164 oz), 2025 |
| Kloof | Sibanye-Stillwater | West Rand | 3,374 kg (108,477 oz), 2025 |
| Kusasalethu | Harmony | Carletonville | 3,198 kg, year to June 2026 |
| Doornkop | Harmony | West Rand | 2,851 kg, year to June 2026 |
| Tshepong South | Harmony | Welkom | 2,541 kg, year to June 2026 |
| Evander Mines | Pan African Resources | Evander | 46,854 oz (about 1.5 t), year to June 2026 |
| Masimong, Joel, Target 1 | Harmony | Welkom | 1,562, 1,399 and 1,409 kg, year to June 2026 |
Sources: Harmony’s results for the year to 30 June 2026 (Form 6-K), Sibanye-Stillwater’s 2025 results (Form 6-K), Gold Fields’ 2025 Mineral Resources and Reserves supplement and DRDGOLD’s results as reported by EWN. Sibanye’s Cooke operations and Harmony’s surface plants add further output not shown line by line.
The two largest figures in the table come from deep mines: Mponeng and South Deep. Pan African Resources runs Evander Mines in Mpumalanga, the north-eastern goldfield. It produced 46,854 oz (about 1.5 tonnes) in the year to June 2026, up 68% from 27,829 oz as underground grade rose above 11 g/t, and is studying the shallow Poplar deposit within its mining right (Engineering News, 2022).
Who owns the Witwatersrand mines?
Harmony Gold is the largest operator. Its South African portfolio has nine underground mines, one open pit (Kalgold) and large surface retreatment, across Gauteng, North West and the Welkom area (Harmony). It bought Mponeng from AngloGold Ashanti in 2020 (Wikipedia, Mponeng). For the year to June 2026 the group produced 44,464 kg (1,429,551 oz) at an all-in sustaining cost (AISC, the full yearly cost of keeping a mine running, per ounce) of US$2,195/oz, and received an average US$3,811/oz (Harmony results, 2026). Those group figures include Harmony’s Papua New Guinea operations. Harmony’s South African underground mines produced 31,680 kg and its South African surface operations 6,880 kg. Tshepong North’s life of mine was extended to 15 years from six.
Sibanye-Stillwater runs South African gold operations (Driefontein, Kloof, Beatrix and Cooke) that produced 15,066 kg in 2025, 11% less than in 2024. Guidance for 2026 is 13,700 to 14,700 kg. Kloof’s life of mine was cut to one year from eight after seismic events and safety concerns led it to remove high-grade blocks of ground from the plan (Sibanye-Stillwater 2025 results, Form 6-K).
Gold Fields owns South Deep, 45 kilometres south-west of Johannesburg on the north-western rim of the basin. At December 2025 its Proved and Probable Mineral Reserves were 174.5 million tonnes at 4.9 g/t for 27.6 million ounces. A Mineral Reserve is the part of a deposit shown to be economic to mine; g/t is grams of gold per tonne of rock. Gold Fields’ stake in South Deep was 93.10% at 30 June 2026 (Gold Fields supplement; Q2 2026 report). South Deep produced 151,000 attributable ounces in the first half of 2026.
DRDGOLD is a surface specialist: its flagship Ergo plant is at Brakpan, east of Johannesburg, and Far West Gold Recoveries is near Carletonville (EWN). West Wits Mining, an Australian-listed company, inaugurated the Qala Shallows underground mine on the western edge of Johannesburg in late 2025, targeting 70,000 ounces a year; Reuters described it as the first new underground gold mine in South Africa in 15 years (Miningmx; Mining Technology).
How output compares across Harmony’s Witwatersrand mines
The second chart compares the same mines in two consecutive years. Mponeng and Moab Khotsong, the two high-grade mines, fell by 8% and 16% in kilograms, while Tshepong North rose by more than a third. Harmony explained the Moab Khotsong fall by lower recovered grades from changes in the mining sequence in high-grade blocks (Harmony results, 2026).
Chart
Harmony Witwatersrand mines, two years
Tonnes of gold per year (kg converted)
Deep mining: how deep are the Witwatersrand mines?
Depth is the defining cost. Some gold-bearing fan deltas now lie about 4 kilometres below surface, and the working mines follow them down. Harmony says Kusasalethu works about 3,400 metres below surface and has a four-year life of mine. Mponeng works at about 3.8 kilometres and is the deepest mine from ground level, with plans to go beyond 4 kilometres. Harmony’s Mponeng Extension Project targets the Ventersdorp Contact Reef and Carbon Leader below existing infrastructure, and its life of mine is about 20 years (Wikipedia, Mponeng). At that depth, rock stress is high: Mponeng recorded a magnitude 2 seismic event in March 2020 in which three people died. Seismicity is also why Sibanye took high-grade blocks out of Kloof’s plan.
The video below shows how mined gold is processed after it comes out of the ground.
▶ How gold is mined and refined, from rock to bar · 5:27
Surface retreatment: gold from the old dumps
A century of milling left large tailings dams and rock dumps beside the mines. These hold low-grade gold that is now worth recovering at today’s prices. DRDGOLD’s Ergo and Far West plants reprocess them, and Harmony runs Mine Waste Solutions and Central Plant Reclamation in the same way. Harmony’s chief executive told Reuters the company is evaluating recovery of 5.7 million ounces through retreatment, and Sibanye-Stillwater is growing its stake in DRDGOLD (Miningmx). Retreatment also removes dust and pollution sources, which links to the environmental section below.
How much gold does South Africa produce today?
The USGS estimates South Africa mined 90 tonnes in 2025, about 2.7% of the 3,300 tonnes mined worldwide, and puts its gold reserves at 5,000 tonnes (USGS, 2026). The country is no longer among the top few producers: China (380 t), Russia (310 t) and Australia (280 t) lead. Reuters reports exploration spending fell to $43 million in 2025 from $900 million in 2006, and the Minerals Council of South Africa expects national output to stay near 90 tonnes (Miningmx). For a wider view of producers see our gold producing countries ranking and the top 20 gold mining companies.
Chart
South Africa against larger producers
Mine production in tonnes, USGS estimate for 2025: the seven largest producers and South Africa; world total 3,300 t
What is a tonne of Witwatersrand ore worth?
Use the calculator on this page to turn tonnes, grade and recovery into ounces and margin. Harmony’s South African underground mines recovered 5.83 g/t on average in the year to June 2026 (Harmony, 2026); the defaults use a round grade near that figure. Surface retreatment grades are far lower, often a fraction of a gram per tonne, which is why scale matters there.
Calculator
What is your ore worth per year?
Enter tonnes, grade, recovery, a price and a cost. Defaults are round examples.
- Revenue at your price (US$): $73,303,647
- Margin after your cost (US$): $32,986,641
Example values only, not figures for any mine. Grade is an example head grade; Harmony reported a recovered grade (after processing) of 5.83 g/t for its South African underground mines (year to June 2026), so with 95% recovery the default gives about 5.7 g/t recovered; cost is an example near Harmony’s group AISC of US$2,195/oz. Price: example, use today’s price. Ounces are troy ounces (31.1035 g).
Environmental legacy: acid mine drainage
Mining at depth requires constant pumping. When mines in a goldfield close and pumping stops, the empty workings fill with water. That water reacts with pyrite (iron sulphide) in the rock and turns acidic and salty. In the Witwatersrand, the Western Basin filled and began to decant onto the surface in 2002; pumping in the Central Basin stopped in 2008 and in the Eastern Basin in 2011 (McCarthy, South African Journal of Science, 2011). The same article shows the Vaal River’s salinity more than doubling between the Vaal Dam and the Barrage as mine water enters from the Klip River and Blesbokspruit. In 2025 acid mine drainage was confirmed as the cause of the red colour of Boksburg Lake (Mail & Guardian).
The clay-animated video below explains the seven main environmental impacts of mining.
▶ The 7 environmental impacts of mining, explained in clay · 2:31
Prospecting and licences on the Witwatersrand
The productive ground is already held by the companies named above, so new exploration on the basin itself mostly happens as joint ventures, purchases or reprocessing deals. For anyone weighing a project elsewhere in Africa, the video below covers whether foreigners can obtain a small-scale licence. Satellite imagery can help early screening of mine dumps, tailings footprints and disturbed ground before a site visit; see satellite-based mineral detection, our guide to gold exploration in South Africa, or send a project query. You can also contact us to scope an area.

▶ Can foreigners get a small-scale mining licence in Africa? · 5:16
Frequently asked questions
In which country is the Witwatersrand?
South Africa. The ridge runs through Johannesburg in Gauteng province, and the buried basin extends into North West and Mpumalanga provinces and south to the Welkom area.
Where is the Witwatersrand gold mine located?
There is no single mine. The goldfields form an arc west, south and east of Johannesburg, about 300 kilometres long. Mponeng is near Carletonville, South Deep is 45 km south-west of Johannesburg and Ergo is at Brakpan.
How much gold has the Witwatersrand produced?
More than 40,000 tonnes since 1886, about 22% of all the gold accounted for above ground, according to the Witwatersrand entry on Wikipedia.
How was the Witwatersrand gold formed?
The leading view is a modified palaeoplacer origin: gold carried by rivers about 2.9 billion years ago, concentrated in conglomerate, and later reworked in part by fluids.
Which mine is the deepest in the Witwatersrand?
Mponeng, owned by Harmony, is usually named. It works at about 3.8 kilometres and plans to go beyond 4 kilometres. Kusasalethu is at about 3,400 metres.
Who are the biggest Witwatersrand gold producers?
By the latest published figures, Harmony (Mponeng alone produced 9,561 kg), Gold Fields (South Deep, 9.7 t in 2025) and Sibanye-Stillwater (Driefontein, 7,216 kg in 2025).
Are Witwatersrand gold mines still operating?
Yes. The older Central Rand mines under Johannesburg are largely worked out, but deeper mines and surface plants on the West Rand, West Wits, Klerksdorp, Welkom and Evander fields all report output.
Does South Africa still produce the most gold?
No. South Africa peaked at around 1,000 tonnes in 1970 and now produces about 90 tonnes a year, behind China, Russia, Australia, Canada, the United States, Ghana and several others.
Is there gold mining in Johannesburg today?
Yes, on the city’s edge: Qala Shallows opened on Johannesburg’s western fringe in late 2025, and DRDGOLD’s Ergo plant retreats tailings at Brakpan. Mining under the old city centre ended long ago.
Can I visit or invest in these mines?
Operating mines are private property and are not open to the public; contact the company before planning any visit. Harmony, Sibanye-Stillwater, Gold Fields and DRDGOLD are listed companies with published results. Check each company’s filings, and this page is not investment advice.
This page is for information only. It is not investment advice, and it is not legal advice. Confirm mining rights and licence rules with the South African regulator. Never enter operating mines, tailings dams or old workings without the owner’s permission: they are dangerous.
Farmonaut mining
Screen ground from space before you commit
Request a quote to map alteration, dumps and disturbed ground on a project area from satellite data.
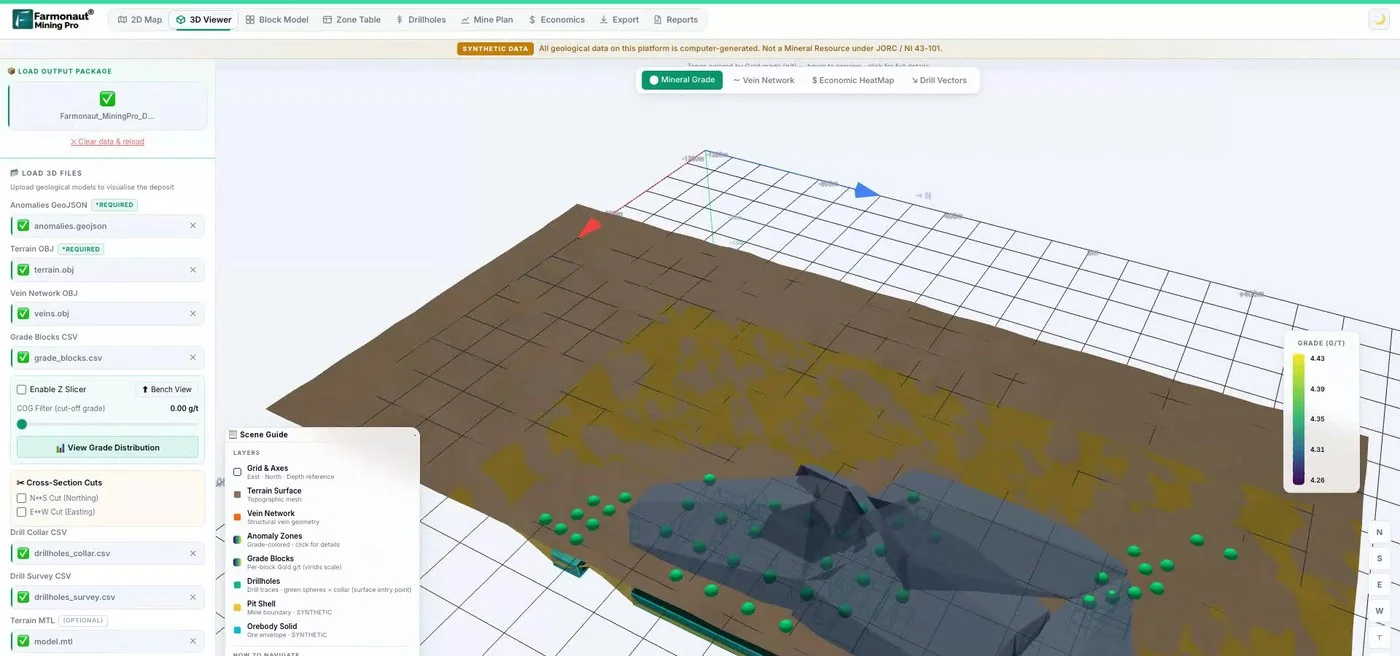
Mining Pro sample view, synthetic data
Keep reading
Sources
- Wikipedia, Witwatersrand: en.wikipedia.org
- Wikipedia, Mponeng Gold Mine: en.wikipedia.org
- USGS, Mineral Commodity Summaries 2026: Gold: pubs.usgs.gov
- Frimmel and Hennigh, Mineralium Deposita (2015): novoresources.com
- Harmony, results for the year ended 30 June 2026: harmony.co.za
- Harmony, results Form 6-K (FY2026): sec.gov
- Harmony, Mining in South Africa: harmony.co.za
- Sibanye-Stillwater, 2025 results Form 6-K: sec.gov
- Gold Fields, Mineral Resources and Reserves Supplement 2025: goldfields.com
- Gold Fields, Q2 2026 report: goldfields.com
- EWN, DRDGOLD record dividend (August 2026): ewn.co.za
- Miningmx, Record gold prices fail to lift SA output (Reuters): miningmx.com
- Mining Technology, West Wits opens Qala Shallows: mining-technology.com
- McCarthy, The impact of acid mine drainage in South Africa (2011): scielo.org.za
- Mail & Guardian, Why Boksburg Lake turned red (2025): mg.co.za
- South African History Online, Cecil John Rhodes: sahistory.org.za
- Engineering News, Pan African full-year record (2022): engineeringnews.co.za
Discussion
Questions, corrections or field experience? Share them below. First-time comments are reviewed before they appear, and your email is never published.
No comments yet. Be the first to add a question or your experience.

 Timestream Mining
 Lithspo Minerals Limited
 Tintina Mining Group
 Dalgety Minerals Pty Ltd
 Vortex Minerals Pty Ltd
 Faith At Work (Pty) Ltd
 Geotech Mining Solutions plc
 Vulcan International Limited
 Kidepo Associates
 GKY Mining
 Alkimy SARL
 Double A Trading
 GemSprout Metals Limited
 Qader Group
 Ileys General Trading
 SG Gold Mining LLC
 VRV Global Pte Ltd
 Omsri International FZE
 G.I.T.T.
 Jaunita Erss Ltd
 Almosi SARL
 SRK Consulting
 Berks Gold Limited
 Mwerezi Minerals Company Limited

 Exploration consultancy · South Africa · Gold










