

Gold mining companies · Ranked list
Top 20 Gold Mining Companies in the World by Output
Newmont is the biggest gold miner, with 5.89 million ounces. This page ranks the top 20 gold mining companies by reported gold output, shows each company’s basis and source, and lets you test ounces against your own price and cost.
Key takeaways
- Newmont produced 5.89 million attributable ounces, ahead of Agnico Eagle (3.45), Barrick (3.26), Navoi Mining (3.15) and AngloGold Ashanti (3.09).
- Zijin Mining mined about 90 tonnes (2.9 million oz), up 23.5%; Polyus fell 16% to 2.53 million oz.
- The 20 companies in the table produced about 40 million oz, roughly 38% of the 3,300 tonnes the USGS estimates for world mine output in 2025.
- Rankings differ because of attributable versus total ounces, gold-equivalent counting and June year-ends; the table states each basis.
- Seven of the 20 are Canadian-based, three are South African and two are Chinese.
In this article
- Who are the biggest gold mining companies in the world?
- Top 20 gold mining companies ranked by gold output
- The top five gold miners compared
- Gold mining companies ranked 6 to 10
- Gold mining companies ranked 11 to 20
- Which gold miner suits which question: quick picks
- What the largest gold miners said about the year ahead
- Mining terms used in this ranking
- Why gold company rankings differ
- Which gold miners grew and which shrank
- How much of the world's gold the top 20 mine
- Gold output calculator: from ounces to revenue and margin
- How to read a gold miner's production report
- Frequently asked questions
Who are the biggest gold mining companies in the world?
Newmont is the biggest gold mining company by output. It reported 5.9 million attributable ounces for its last full year (5.89 million in the summary table), well ahead of Agnico Eagle at 3.45 million, Barrick at 3.26 million, Navoi Mining in Uzbekistan at 3.15 million and AngloGold Ashanti at 3.09 million. Zijin Mining of China follows with about 90 tonnes, or 2.9 million ounces. All figures are for the 2025 reporting year unless the table says otherwise, and they count ounces in million troy ounces (Moz).
That answers the question for the top five, but a “top 20” list is only useful if the ranking rule is clear. Companies report gold in different ways: some count only their ownership share of a joint venture, some add silver as gold-equivalent ounces, and some end their year in June. This page ranks 20 gold producers on one stated metric, shows which basis each company uses, and gives a calculator that turns ounces into revenue and margin with your own price and cost inputs.
Top 20 gold mining companies ranked by gold output
How we chose and ranked them
The metric is gold produced (or, where a company reports only sales, gold sold) in its latest full reporting year, in million troy ounces, taken from each company’s own results release or annual report. A troy ounce is 31.1035 grams, so one million ounces is about 31.1 tonnes. Where a company reports in tonnes (Zijin and Shandong Gold), we converted at 32,150.7 ounces per tonne.
Chart
Gold output of the top 10 producers
Million troy ounces, latest full reporting year (Northern Star: year to June 2025)
The table holds the 20 largest producers that report a full-year gold figure in their own filings. Three of them end their financial year in June (Northern Star, Harmony and Evolution), so their figure is for the year to 30 June 2025. Two (Kinross and Gold Fields) report gold-equivalent ounces that include silver or copper converted to gold. The table says so in the Basis column. Royalty and streaming companies such as Franco-Nevada are not producers and are left out. Zhaojin Mining of China is not ranked because no full-year 2025 gold figure is available to us; for reference it mined 18.34 tonnes (about 0.59 Moz) in 2024 and 8.98 tonnes in the first half of 2025. Next in line below 20th place are Lundin Gold (498,315 oz, Lundin Gold release) and Eldorado Gold (488,268 oz). Groups that publish no ounce figure, such as some state-owned miners, cannot be ranked from public data.
The ranking table
| Rank | Company | Home market | Gold output (Moz) | Basis | Source |
|---|---|---|---|---|---|
| 1 | Newmont | United States | 5.89 | Attributable production | Newmont results |
| 2 | Agnico Eagle Mines | Canada | 3.45 | Payable production (3,447,367 oz) | Agnico Eagle results |
| 3 | Barrick Mining | Canada | 3.26 | Attributable production (3,255 koz) | Barrick results |
| 4 | Navoi Mining and Metallurgical Company (NMMC) | Uzbekistan | 3.15 | Total production | NMMC IFRS release |
| 5 | AngloGold Ashanti | South Africa (Africa-focused; UK-registered) | 3.09 | Production (3,091 koz) | AngloGold Ashanti report |
| 6 | Zijin Mining | China | 2.89 | Mined gold, about 90 t | Zijin results coverage |
| 7 | Polyus | Russia | 2.53 | Total output (2,528.8 koz) | Polyus results |
| 8 | Gold Fields | South Africa | 2.44 | Attributable gold-equivalent (2,438 koz) | Gold Fields results |
| 9 | Kinross Gold | Canada | 2.01 | Attributable gold-equivalent (2,012,106 oz) | Kinross results |
| 10 | Northern Star Resources | Australia | 1.63 | Gold sold, year to June 2025 | Northern Star update |
| 11 | Shandong Gold Mining | China | 1.57 | Mined gold, 48.89 t | Shandong Gold annual report coverage |
| 12 | Harmony Gold | South Africa | 1.48 | Group production, year to June 2025 (46,023 kg) | Harmony results |
| 13 | Endeavour Mining | United Kingdom (London-listed) | 1.21 | Consolidated production (1,209 koz) | Endeavour results |
| 14 | Freeport-McMoRan | United States | 1.1 | Consolidated gold sales (copper-led miner) | Freeport results |
| 15 | B2Gold | Canada | 0.98 | Consolidated production (979,604 oz) | B2Gold results |
| 16 | IAMGOLD | Canada | 0.77 | Attributable production (765,900 oz) | IAMGOLD update |
| 17 | Evolution Mining | Australia | 0.75 | Production, year to June 2025 (750,512 oz) | Evolution coverage |
| 18 | Pan American Silver | Canada | 0.74 | Attributable gold production (742.2 koz) | Pan American release |
| 19 | Fresnillo | United Kingdom (London-listed, Mexican mines) | 0.60 | Consolidated production (600,287 oz) | Fresnillo results coverage |
| 20 | Alamos Gold | Canada | 0.55 | Production (545,400 oz) | Alamos release |
Together the 20 produced about 40 Moz, or roughly 1,240 tonnes. The USGS Mineral Commodity Summaries 2026 estimates world mine production at 3,300 tonnes for 2025, so these 20 companies account for roughly 38% of the world total. The bases and year-ends differ, so treat that share as an estimate, not a precise statistic. Not every ounce is mined by a listed company: artisanal and small-scale miners and many private or state operators make up the rest.
The top five gold miners compared
Newmont (1st). The company counts 5.7 million attributable ounces from its core portfolio and 5.9 million in total once other assets are included. MINING.COM’s half-year ranking noted that Newmont’s output was lower than the year before because it had sold several non-core assets. It is based in Colorado and operates in North America, South America, Africa and Australia. Best for: the largest and most geographically spread producer. Watch: sales of assets shrink reported ounces even when mines run well.
Agnico Eagle (2nd). Agnico reported 3,447,367 ounces of payable gold production and said it met its production guidance. Payable production means the gold the company is paid for after the smelter’s deductions. It also says its growth pipeline could raise annual production by 20% to 30% over the next decade, to above four million ounces by the early 2030s. Best for: a Canada-centred portfolio. Watch: that is company outlook, not a forecast we can verify.
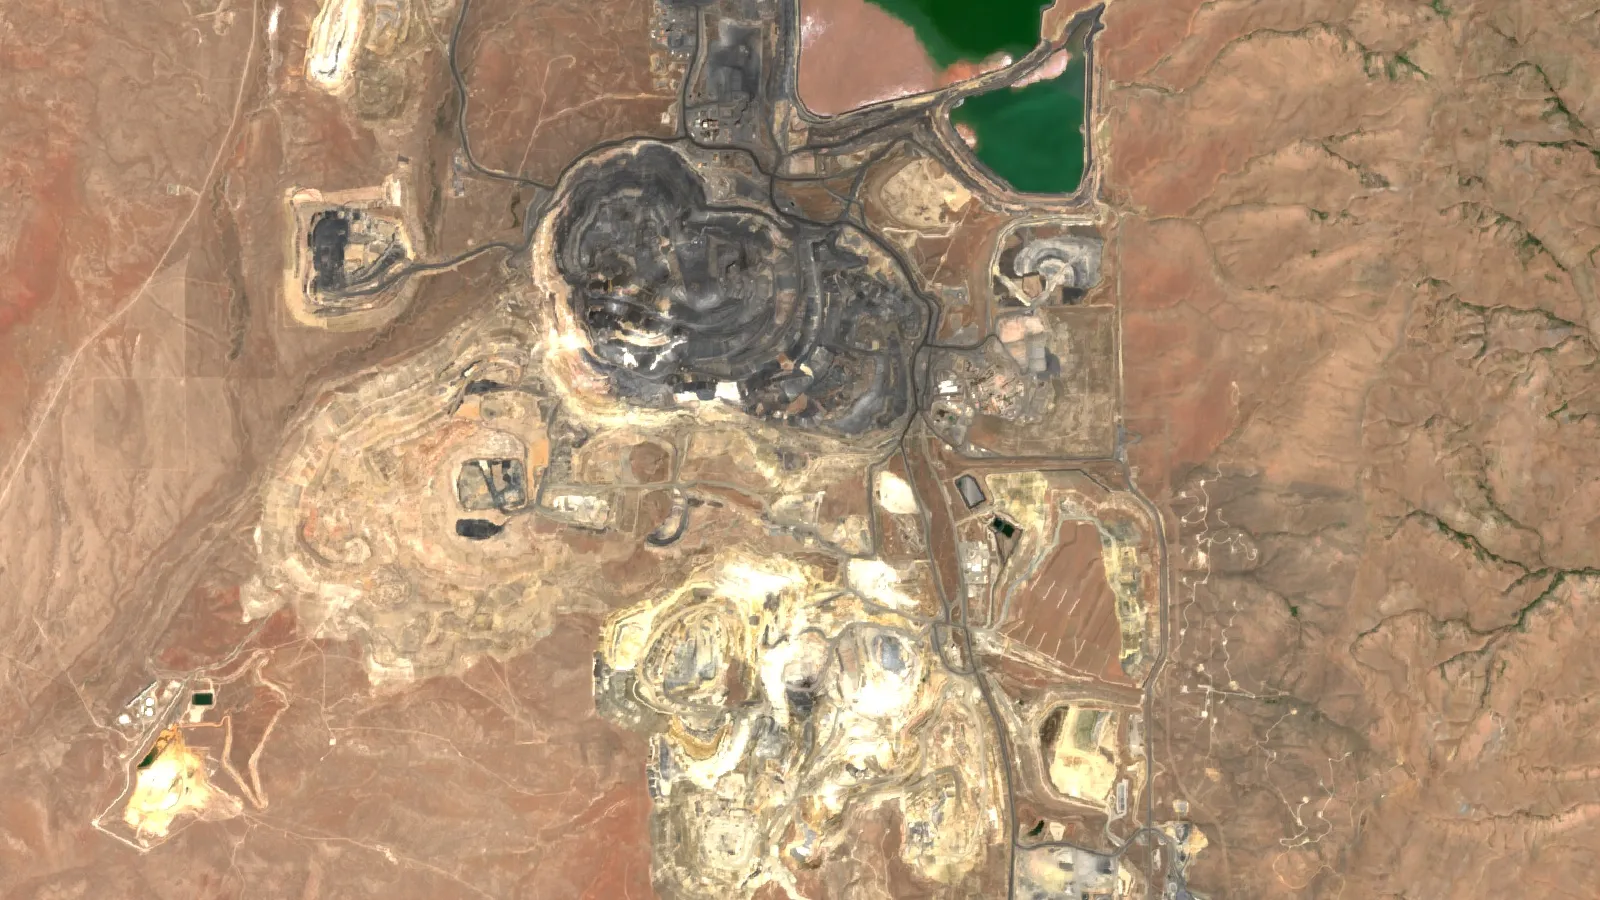
Barrick (3rd). Barrick reported 3,255 thousand attributable ounces. Its release says the Loulo-Gounkoto complex in Mali was placed under provisional administration on 16 June 2025 and returned to Barrick’s control on 16 December 2025, and MINING.COM linked Barrick’s half-year drop to the seizure of that mine. Its North America region produced 2,093 thousand attributable ounces. Nevada Gold Mines is a joint venture between Barrick and Newmont, and each partner reports its own share. The Carlin Trend in Nevada, where Nevada Gold Mines operates, is the area shown in the satellite view at the top of this page.
Navoi Mining and Metallurgical Company (4th). The Uzbek state-owned group reported 3.15 Moz, up 1.9% from 3.09 Moz, with an all-in sustaining cost of US$1,358 per ounce (up from US$979) and revenue of US$10,827 million. Its flagship Muruntau is described in the release as the world’s largest gold deposit. Best for: a very large single-district operation. Watch: it is state-owned, and the release links part of its cost rise to higher royalties.
AngloGold Ashanti (5th). Production was 3.09 Moz against 2.66 Moz the year before. The gain came largely from the Sukari mine in Egypt, which joined the group through the Centamin acquisition in September 2024 (MINING.COM). Best for: the fastest-growing member of the top five.

▶ Farmonaut explainer in clay: how gold is mined and refined, from rock to ring. · 5:27
Gold mining companies ranked 6 to 10
Zijin Mining (6th) mined about 90 tonnes of gold, up 23.5% year on year, and set a 2026 target of 105 tonnes. It is also a major copper miner, and the gold figure here is mined gold only. MINING.COM reported that Zijin agreed to buy the Raygorodok mine in Kazakhstan for US$1.2 billion in June 2025.
Polyus (7th) reported output down 16% to 2,528.8 thousand ounces, in line with its guidance range of 2.5 to 2.6 million ounces. It said the fall came from planned lower output at the Olimpiada and Blagodatnoye mines as they moved to later pit stages, and that record capital spending of US$2.2 billion went mostly to the Sukhoi Log project.
Gold Fields (8th) reported that group attributable gold-equivalent production rose 18% to 2,438 koz against 2,071 koz. Its Salares Norte mine in Chile reached steady state by the end of the year. Gold-equivalent means copper and silver output is converted to gold ounces.
Kinross Gold (9th) reported 2,012,106 attributable gold equivalent ounces for the year, against 2,128,052 the year before, and forecast about 2.0 million gold equivalent ounces for the following year. Its Paracatu mine in Brazil produced over 600,000 ounces for the eighth year running above 500,000. For the share-listing side of the business, see our Kinross Gold exchange-listing overview.
Northern Star Resources (10th) sold 1,634 koz in the year to June 2025: 832 koz from Kalgoorlie (KCGM), 518 koz from Yandal and 283 koz from Pogo in Alaska. KCGM is the operation known as the Fimiston open pit, or Super Pit; our page on the Super Pit in Australia covers the pit itself. Because it is a fiscal-year figure, compare it with calendar-year companies with care.
Gold mining companies ranked 11 to 20
Shandong Gold (11th) mined 48.89 tonnes, up 5.89%, of which 36.31 tonnes came from China and 12.58 tonnes from overseas mines. Harmony Gold (12th) produced 46,023 kg (1,479,671 oz) in the year to June 2025, down 5%, helped by high recovered grades at its South African underground mines such as Mponeng. Endeavour Mining (13th) produced 1,209 koz at an all-in sustaining cost of US$1,433 per ounce, from West African mines.
Freeport-McMoRan (14th) is a copper-led miner. It reported 1.1 million ounces of gold sales for the year; the company reported a September 2025 mud rush incident at its Grasberg operation in Indonesia and describes a phased restart of the Grasberg Block Cave beginning in the second quarter of 2026. Copper-led and diversified groups are normally ranked by their main metal; see our list of the largest copper mining companies. Groups whose main business is another metal, such as First Quantum in copper or Anglo American in diamonds and copper (see our note on the De Beers and Anglo American takeover talk), are not ranked here.
B2Gold (15th) produced 979,604 ounces, including 14,554 ounces of pre-commercial production from the Goose mine in Canada, which reached commercial production on 2 October 2025. The Fekola mine in Mali made 530,769 ounces. IAMGOLD (16th) made 765,900 attributable ounces: 279,900 from Côté Gold (its 70% share), 113,900 from Westwood and 372,100 from Essakane. Evolution Mining (17th) produced about 750.5 koz in the year to June 2025 and guides to 710,000 to 780,000 ounces for the next year.
Pan American Silver (18th) reported 742.2 thousand attributable ounces of gold as a silver-led miner with a large gold by-product. Fresnillo (19th) produced 600,287 ounces, 5% below the year before but above its guidance, from mines in Mexico. Alamos Gold (20th) produced 545,400 ounces, down from 567,000, with its Island Gold District and Young-Davidson mine both in Ontario.
Seven of the 20 are Canadian-based (Agnico Eagle, Barrick, Kinross, B2Gold, IAMGOLD, Pan American and Alamos), though most of their ounces are produced abroad.
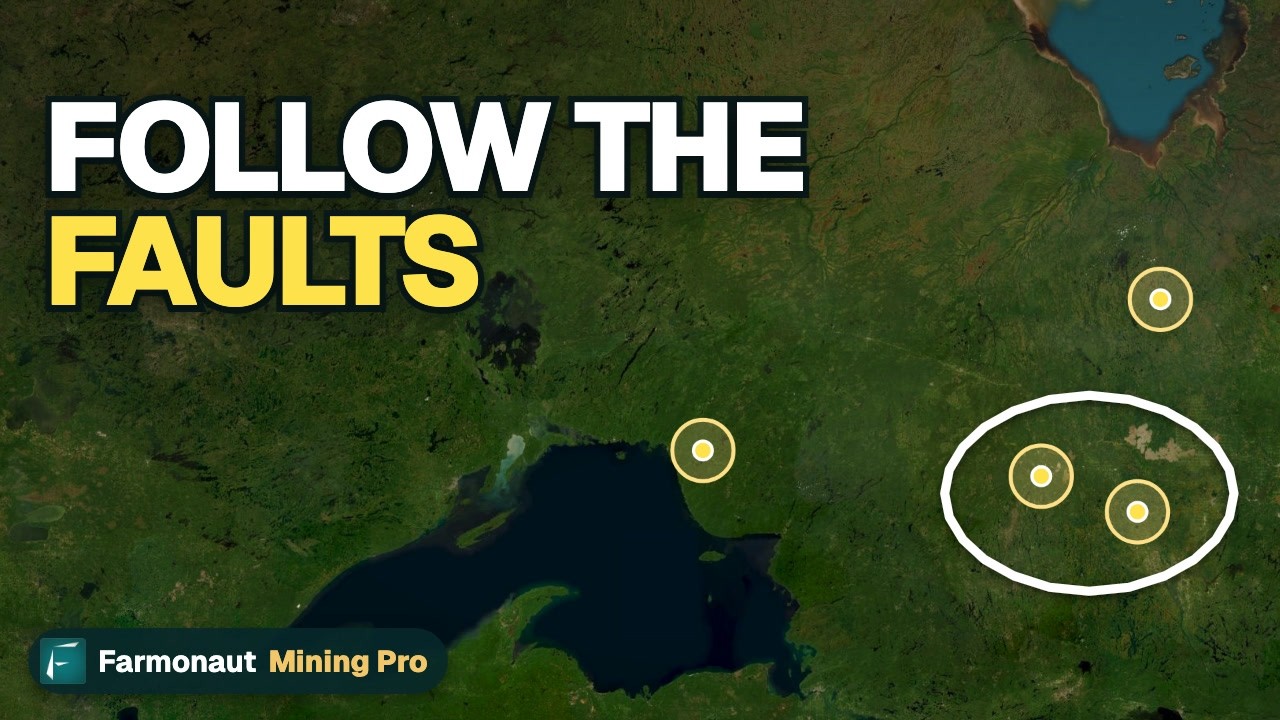
▶ Farmonaut short explainer: Ontario makes about 40% of Canada’s gold, and where its gold belts sit. · 2:53
Which gold miner suits which question: quick picks
A single rank hides how different these companies are. These picks use only the figures above.
- Largest by ounces: Newmont, at 5.89 Moz, about 1.7 times Agnico Eagle’s output.
- Largest single-district operation: Navoi Mining, whose release calls Muruntau the world’s largest gold deposit. Its 3.15 Moz is around 98 tonnes, which compares with the 130 tonnes USGS lists for all of Uzbekistan.
- Fastest growth among the top ten: Zijin, with mined gold up 23.5%, and AngloGold Ashanti, up from 2.66 to 3.09 Moz.
- Most steady first half: MINING.COM said Agnico Eagle delivered the most consistent first-half production year on year among the big names.
- Highest-grade underground example: Harmony reported recovered grades of 11.27 grams per tonne at Mponeng. Grade is the weight of gold in each tonne of rock, so a figure above 11 g/t is rich ore.
- Gold as a by-product: Freeport (copper-led) and Pan American Silver (silver-led) sit in the table because their gold is large enough to rank, even though gold is not their main metal.
- Ontario-centred producer: Alamos Gold makes its ounces at the Island Gold District and Young-Davidson mine in Ontario and at Mulatos in Mexico, according to its 2025 production release.
What the largest gold miners said about the year ahead
Guidance is a company’s own range for the next year. It is not a forecast we make, and it can change. The statements below come from the same results releases used in the table.
- Zijin Mining set a 2026 gold target of 105 tonnes, against about 90 tonnes mined in 2025.
- Kinross forecasts about 2.0 million gold equivalent ounces for the following year, similar to 2025.
- B2Gold’s release gives 2026 gold production of between 820,000 and 970,000 ounces, against 979,604 ounces in 2025.
- Evolution Mining guides to 710,000 to 780,000 ounces for its next financial year.
- Agnico Eagle says its pipeline could take annual production above four million ounces by the early 2030s.
Mine suspensions, permits, grade changes and government actions can move any of these numbers, as the Mali administration of Loulo-Gounkoto and the Grasberg mud rush showed in 2025.
Mining terms used in this ranking
- Troy ounce (oz): the unit for gold, 31.1035 grams. Moz means million ounces; koz means thousand ounces.
- Tonne: a metric ton, 1,000 kg. The US also uses the short ton (2,000 lb), which is not used here.
- Grade (g/t): grams of gold per tonne of rock. Higher grade usually means lower cost per ounce, but size and metallurgy matter too.
- Joint venture: a mine owned by two or more companies. Each reports its share as attributable output.
- By-product: a metal recovered while mining another, such as gold from copper ore.
- Stream or royalty: a contract that pays a company a share of a mine’s gold or revenue without it operating the mine.
- Doré: the unrefined gold-silver bars poured at a mine before refining.
- Resource and reserve: a resource is mineralisation with reasonable prospects of extraction; a reserve is the part shown to be economic with current assumptions. Satellite screening results are exploration targets that come before either.
Why gold company rankings differ
Search for the “biggest gold miners” and you will find lists with different orders. The differences usually come from five choices.
- Attributable or total. Attributable production counts only the company’s ownership share of a mine. If two partners own a mine, each counts its share, so nothing is double-counted. Total (100%) production counts everything the mine makes. Barrick, Newmont, IAMGOLD and Pan American use attributable figures; NMMC reports its own total output.
- Gold or gold-equivalent. Kinross and Gold Fields convert silver or copper into gold-equivalent ounces. Gold Fields’ gold-only output is lower than its table figure; Kinross reported 2,026,570 gold ounces sold against 2,012,106 attributable gold-equivalent ounces produced, so the two measures are not directly comparable. Kinross states that the silver-to-gold ratio it used for the year was 86.29 to 1.
- Produced, payable or sold. Produced is what leaves the mill; payable is what the buyer pays for; sold is what was delivered in the year. Northern Star and Freeport report sales in the table, so timing of shipments can move their figure.
- Calendar or fiscal year. Northern Star, Harmony and Evolution end their year on 30 June. The ranking above shows their year to June 2025.
- Ownership changes. A company that bought or sold a mine during the year reports part-year output. AngloGold Ashanti added Sukari through the Centamin purchase, and Newmont has sold non-core assets.
Another measure you will meet is all-in sustaining cost (AISC). It adds the cost of keeping a mine running, including sustaining capital and overheads, to the cost of mining and processing an ounce. It is reported per ounce sold and is not the same as total cost of production. For example, NMMC reported US$1,358 per ounce and Endeavour US$1,433 per ounce, but each company defines costs a little differently and mines have different grades, so compare costs mainly within one company’s own reports over time.
Another reason lists differ is price. A company’s rank by revenue moves with the gold price even when its ounces do not. This page ranks by ounces so that the order does not shift with the price. For reference, MINING.COM’s price ticker showed gold futures at about US$4,030 per ounce on 27 October 2026, while the USGS gave an average of US$3,300 per ounce for 2025 as a whole.
Which gold miners grew and which shrank
Year-on-year change shows who is gaining ground. The biggest increases came from acquisitions and new mines: AngloGold Ashanti added Sukari, Gold Fields ramped up Salares Norte, and IAMGOLD had its first full year at Côté Gold. Kinross, Harmony and Alamos produced slightly less than in the prior year (Harmony on its June year). Polyus fell 16% by plan and Barrick’s year was cut by the Mali administration. The chart compares each company’s output with its own previous year on the same basis.
Chart
Output change on the same basis
Million troy ounces, 2024 versus 2025 (Harmony: years to June)
The ranking will keep moving. Newmont’s attributable output is dropping as it sells assets, Zijin has a 2026 target of 105 tonnes, and Freeport’s gold depends on the restart of Grasberg. Check each company’s next quarterly report, filed through the SEC, SEDAR+ or the ASX, rather than relying on a list that is a year old.
How much of the world’s gold the top 20 mine
The top 20 mine roughly 38% of world output on our estimate, but gold is still spread across many countries. The USGS Mineral Commodity Summaries 2026 gives world mine production of 3,300 tonnes for 2025, with China at 380 tonnes, Russia at 310 tonnes, Australia at 280 tonnes, Canada at 200 tonnes and the United States at 160 tonnes. Uzbekistan is listed at 130 tonnes, which is consistent with the roughly 98 tonnes (3.15 Moz) that NMMC reports as one company. For the country picture in detail, see our table of top gold producing countries by output, and for the US, our list of active gold mines in the USA. The USGS also reports that Nevada made about 64% of US output and that about 7% of US gold came as a by-product of base-metal ores, mainly copper. If you track more than one commodity, our page on uranium reserves by country gives the same country view for uranium. For wider context, our mining industry report covers trends beyond gold.
Chart
Gold mine production by country
Tonnes, selected countries, USGS estimate for 2025; world total 3,300 t (Uzbekistan, also 130 t, is not shown)
Gold output calculator: from ounces to revenue and margin
Use the calculator below to test what a company’s ounces might be worth. Enter ounces, your own price and a cost per ounce. It shows revenue, cost, margin and the share of the 3,300-tonne world total that the ounces represent. All three inputs are your assumptions; the defaults are round examples, not figures for any company.
Calculator
What are a company’s gold ounces worth?
Enter ounces, your price and a cost per ounce. The defaults are round examples.
- Revenue (US$): $4,000,000,000
- All-in sustaining cost (US$): $1,500,000,000
- Margin per ounce (US$): $2,500
- Gold mass (tonnes): 31.1
- Share of world mine output (%): 0.94
Example values only, not figures for any company. Price: example, use today’s price (gold futures near US$4,030/oz on 27 October 2026 per MINING.COM’s ticker; USGS average for 2025 was US$3,300/oz). Cost per ounce is an example all-in sustaining cost; companies in the table report their own (NMMC US$1,358, Endeavour US$1,433). World total 3,300 t is the USGS estimate for 2025 (Mineral Commodity Summaries 2026). Results are before tax, royalties not in the cost, and capital.
How to read a gold miner’s production report
- Find the basis. Look for the words attributable, 100%, gold-equivalent, payable, produced and sold in the first table of the release.
- Check the period. Note whether it is calendar year or a year ending in June.
- Read the footnotes on ownership. Check which mines are joint ventures and what percentage the company holds.
- Compare with guidance. Companies publish a range for the year; being near the middle or the top of it tells you whether mines ran to plan.
- Look at the cost. Compare AISC with the realised gold price in the same release; the gap is the margin per ounce.
- Check the reserve life. Reserves divided by annual output gives years of production at today’s rate.
Site-level checks can add context between filings. Satellite change detection can show pit expansion, waste dumps and tailings growth around a mine, which helps a licence owner or consultant see what a production number is built on. It does not replace a company’s own reporting, and satellite-based exploration results are targets that come before a resource estimate.

▶ Farmonaut explainer: how satellites help in gold exploration, in plain words. · 4:25
Frequently asked questions
What is the biggest gold mining company in the world?
Newmont, with 5.89 Moz of attributable gold production in its latest full year, according to its own results. Agnico Eagle, Barrick, Navoi Mining and AngloGold Ashanti each produced between 3.09 and 3.45 Moz.
Who is the second biggest gold miner?
Agnico Eagle, on 3.45 Moz of payable production, narrowly ahead of Barrick on 3.26 Moz. Barrick’s release says its Loulo-Gounkoto complex in Mali was under provisional administration from 16 June to 16 December 2025.
Which country has the most gold mining companies in the top 20?
Canada, with seven companies in the table: Agnico Eagle, Barrick, Kinross, B2Gold, IAMGOLD, Pan American Silver and Alamos Gold. South Africa has three (AngloGold Ashanti, Gold Fields and Harmony) and China has two (Zijin and Shandong Gold).
What does attributable production mean?
It is the share of a mine’s output that matches the company’s ownership percentage. A company owning 70% of a mine counts 70% of its ounces, as IAMGOLD does for Côté Gold.
Why is Franco-Nevada not in the list?
Franco-Nevada does not operate mines. It buys royalties and streams, which give it a share of other companies’ gold, so it has no mine output to rank.
How many ounces is a tonne of gold?
One metric tonne is about 32,150.7 troy ounces. One troy ounce is 31.1035 grams.
How much gold does the world mine in a year?
The USGS estimates 3,300 tonnes of world mine production for 2025, about 106 million troy ounces.
Is gold-equivalent production the same as gold production?
No. Gold-equivalent adds by-product metals such as silver or copper after converting them to gold at a stated price ratio. Kinross and Gold Fields report this way, so their gold-only figure differs from the table (for Gold Fields it is lower).
Which gold miners are growing fastest?
On the same basis year on year, AngloGold Ashanti (up from 2.66 to 3.09 Moz) and Gold Fields (up 18%) grew most among the large producers, and IAMGOLD grew from 0.67 to 0.77 Moz. Zijin’s mined gold rose 23.5%, per coverage of its results.
Where can I find a mine’s own production figures?
Use the company’s quarterly and annual results on its website and on regulator databases such as SEC EDGAR, SEDAR+ or the ASX. Our guide to gold output by country shows how company ounces add up to national totals.
This page is for information only. It is not investment advice.
This page is for information only. It is not investment advice. Production figures are as reported by each company and can be restated.
Farmonaut mining
Map your own licence area from space
Request a quote to screen your licence area with satellite data and produce exploration targets, ahead of a resource estimate.

Mining Pro sample view, synthetic data
Keep reading
Sources
- Newmont, fourth quarter and full year results (19 Feb 2026): seekingalpha.com
- Agnico Eagle, Q4 and full year results: s205.q4cdn.com
- Barrick Mining, Q4 and full year results: barrick.com
- Navoi Mining and Metallurgical Company, FY results (IFRS): ngmk.uz
- AngloGold Ashanti, CEO review and outlook: reports.anglogoldashanti.com
- Zijin Mining 2026 gold target and 2025 output (Mexico Business News): mexicobusiness.news
- Polyus, 2025 operating and financial results: polyus.com
- Gold Fields, full year results (SEC exhibit): sec.gov
- Kinross, 2025 fourth-quarter and full-year results: finviz.com
- Kinross, year-end 2025 exploration news release: s204.q4cdn.com
- Northern Star, operational update (7 July 2025): announcements.asx.com.au
- Shandong Gold, 2025 annual report coverage (NBD): nbd.com.cn
- Harmony Gold, FY25 results: harmony.co.za
- Endeavour Mining, Q4 and FY 2025 results: edv-14806-s3.s3.eu-west-2.amazonaws.com
- Freeport-McMoRan, fourth-quarter and year 2025 results (SEC): sec.gov
- B2Gold, Q4 and full year 2025 results: finanznachrichten.de
- IAMGOLD, Q4 2025 operating results: s202.q4cdn.com
- Evolution Mining, FY25 results (Capital Brief): capitalbrief.com
- Pan American Silver, 2025 production release: theglobeandmail.com
- Fresnillo, 2025 gold and silver production (IIR): industrialinfo.com
- Alamos Gold, Q4 2025 production: s24.q4cdn.com
- Lundin Gold, 2025 production release: news.cision.com
- USGS, Mineral Commodity Summaries 2026: Gold: pubs.usgs.gov
- MINING.COM, Ranked: top 10 gold mining companies (first half): mining.com
- Zhaojin Mining production analysis (Sina Finance): cj.sina.com.cn
Discussion
Questions, corrections or field experience? Share them below. First-time comments are reviewed before they appear, and your email is never published.
No comments yet. Be the first to add a question or your experience.

 Geoticgy
 GemSprout Metals Limited
 Qader Group
 Ileys General Trading
 SG Gold Mining LLC
 VRV Global Pte Ltd
 Omsri International FZE
 G.I.T.T.
 Jaunita Erss Ltd
 Almosi SARL
 SRK Consulting
 Berks Gold Limited
 Mwerezi Minerals Company Limited
 Mining SARL
 SenGold Invest SAS
 Sean Mining Limited
 NTS Group (Pty) Ltd
 Mine4Africa
 Lithspo Minerals Limited











