

Reviewed August 2026 against USDA NASS, USDA ERS, and USDA AMS.
Try it: Run your own numbers →
Pasture management software is a module (or add-on) inside a broader farm management system (FMS) that tracks forage growth, grazing rotation, and land condition using satellite imagery, IoT sensors, and mapping tools instead of a notebook and a fence walk. An integrated farm information management system extends that same data layer across weed control, acreage planning, and compliance record-keeping, so a rancher, dairy operation, or horse boarding facility works from one map instead of five spreadsheets. This article covers what these systems actually do, what US adoption data says about who is using them, and what to check before you buy one.
63% of US farms were using farm management software in some capacity as of 2026, per Precision Farming Statistics 2026 — but adoption of full integrated systems, versus a single app for one task, is a much smaller slice of that number, and no public dataset isolates it yet.
Table of Contents
- What Counts as a Farm Management System
- Pasture Management Software: What It Actually Tracks
- FMS, Integrated FMS, and Farm Information Management System — Where They Differ
- Organic Weed Management Inside a Pasture System
- Acreage Management and Land Use Optimization
- Pasture Management for Sheep and Horses
- Land Management Planning and Compliance
- Comparison Table: Manual vs. Software-Based Pasture Management
- Calculator: Stocking Rate and Rest-Period Planner
- How Farmonaut Fits This Stack
- What to Check Before You Buy a Pasture Management System
- Frequently Asked Questions
- Conclusion
- Subscribe to Farmonaut
- Try it: Run your own numbers
What Counts as a Farm Management System
A farm management system (FMS) is any software that centralizes farm records — inputs, yields, animal movements, field boundaries, weather, compliance paperwork — in place of paper logs or a folder of spreadsheets. An integrated farm management system goes further: it links those records to live data (satellite imagery, soil sensors, weather feeds) so the numbers update themselves instead of waiting for someone to type them in. A farm information management system is the same idea under a different name, more common in extension and land-grant literature; functionally, treat FMS and FIMS as synonyms unless a specific vendor draws a distinction in their own documentation.
USDA’s Economic Research Service found that 27% of US farms and ranches used precision agriculture practices for crops or livestock as of 2023, per the USDA ERS Precision Agriculture in the Digital Era report. That figure covers precision ag broadly — autosteering, yield mapping, variable-rate application — not integrated FMS specifically. No USDA dataset isolates adoption of full integrated farm management platforms as a distinct category, which is a real gap in the public record; if you need that number for a specific state or commodity, the closest proxy is the ERS Agricultural Resource Management Survey (ARMS) breakdowns by farm size and technology type in the same report.
Adoption tracks with farm size. Among large-scale crop farms, 70% used guidance autosteering systems on tractors and harvesters, and 68% used yield monitors, yield maps, and soil maps, both as of 2023 (USDA ERS). Midsize farms trailed at 52% for autosteering. Small family crop farms used yield monitors and soil maps at just 13% — a five-fold gap from the large-farm rate on the identical metric.

Pasture Management Software: What It Actually Tracks
Pasture management software is the grazing-specific layer of an FMS. Instead of general field records, it focuses on forage supply, grazing pressure, and recovery timing for whatever is on the ground — cattle, sheep, horses, or mixed grazing. The core functions, regardless of vendor, are:
- 🌱 Forage growth tracking — satellite vegetation index (NDVI-type) readings or manual biomass estimates by paddock
- 🌱 Grazing rotation scheduling — move dates, rest periods, and paddock sequencing
- 🌱 Stocking density calculations — animal units per acre against available forage
- 🌱 Weather and drought risk overlays — precipitation tracking against growth curves
- 🌱 Record-keeping for compliance — grazing logs required for certain conservation or certification programs
This matters more in the United States than the acreage totals suggest at first glance. USDA’s National Agricultural Statistics Service counted 805 million acres of grazing land nationally — rangeland, managed pasture, grazed forestland, and cropland pasture combined — in its most recent land-use accounting, per the USDA NASS grazing land value map. That is a larger footprint than all US cropland combined, and almost none of the precision-ag adoption figures above were collected with pasture-specific instruments in mind — most ARMS technology questions are framed around row crops.
Pastureland is also appreciating fast enough that management quality has direct balance-sheet consequences. The national average value hit $1,920 per acre in 2025, up 4.9% year-over-year, according to the USDA NASS Land Values report published in August 2025. NASS releases this report annually each August; the next update is due August 2027, so check that report directly for the current per-acre figure in your state rather than relying on a number that is already a year old by the time you read this.

FMS, Integrated FMS, and Farm Information Management System — Where They Differ
These three search terms point at overlapping but not identical products, and buyers waste time comparing tools that don’t actually compete with each other:
- FMS (farm management system) — the broadest term. Can mean anything from a single-purpose input-tracking app to a full platform. Ask what modules are included before assuming scope.
- Integrated farm management system — specifically implies the platform pulls from multiple live data sources (satellite, sensors, weather APIs) and connects modules — so a change in one area (say, a grazing move) automatically reflects in others (like a compliance log).
- Farm information management system (FIMS) — used more in research, extension, and government contexts to describe the same category of integrated, data-centralizing platform.
The practical test: ask a vendor whether moving livestock in the grazing module automatically updates the compliance record, or whether you have to enter it twice. If it’s the latter, the product is a collection of separate tools wearing one login screen, not an integrated system.
Organic Weed Management Inside a Pasture System
Certified organic operations face a specific constraint that makes software more useful, not less: the USDA’s organic livestock standards, effective 2024, require a minimum of 120 days of pasture access per year for certified organic livestock, per the USDA AMS Organic Livestock and Poultry Standards. Meeting that requirement without documentation you can hand an inspector is a certification risk, and weed pressure that reduces usable pasture area directly threatens the ability to hit the 120-day threshold on the acreage you actually have.
Since synthetic herbicides are excluded under organic rules, weed control in this context means mechanical control, timed grazing, and cover cropping — and the value pasture software adds here is documentation and timing, not chemistry. A system that logs which paddocks were weeded, when, and by what method gives you the audit trail an organic inspector will ask for, and satellite-derived vegetation maps let you spot a weed patch spreading across a 40-acre paddock without walking the whole thing weekly.
- ✔ Records of mechanical/manual weed control events, timestamped and mapped by paddock
- ✔ Vegetation index imagery that flags density changes worth a physical inspection
- ✔ Grazing-day logs that double as organic pasture-access documentation
- ✔ Cover crop and rotation records tied to the same field boundaries used for grazing

Treating satellite vegetation maps as a replacement for field scouting, rather than a filter for where to scout first. Automated imagery flags where cover is thinning; it does not identify a weed species or confirm it’s actually a weed and not just seasonal browning. Validate flagged zones in person before logging a control action.
Tracking your farm’s environmental footprint alongside weed and grazing records?
Farmonaut’s Carbon Footprinting tool uses satellite and AI data to help quantify emissions across the same operation, which is increasingly relevant as buyers and certification bodies ask for that documentation alongside organic paperwork.
Acreage Management and Land Use Optimization
Acreage management is the FMS function that decides how land gets divided — which parcels go to hay, which to grazing, which stay in reserve — and tracks performance by zone rather than by whole-farm averages. Before digital tools, this ran on physical fence lines and memory. A management-zone approach instead layers:
- 📊 Soil type, topography, and drainage mapping per parcel
- 📊 Satellite/aerial imagery for standing biomass and bare-ground detection
- 📊 Multi-year yield and grazing-day history by zone, not just by farm
- 📊 Buffer zone and conservation-area boundaries for regulatory compliance
- 📊 Variable-rate irrigation and fertilization plans built from the zone data above
This is where farm size drives the biggest adoption gap in the USDA data cited above — the 70%-versus-13% split on autosteering and yield/soil mapping between large and small crop farms. A management-zone approach requires enough acreage complexity to be worth the setup time; a 40-acre horse property doesn’t need the same zoning depth as a 4,000-acre cattle operation, and vendors pricing per-acre or per-parcel should make that scaling explicit before you sign.

For operations managing multiple parcels or livestock groups, the Farmonaut Agro Admin App centralizes farm monitoring, mapping, and team operations with satellite data and customizable dashboards built for multi-site acreage tracking.

Pasture Management for Sheep and Horses
Sheep and horses put different pressure on the same acre, and a pasture management system needs to distinguish between them rather than applying one grazing model to both.
Pasture Management for Sheep
Sheep are selective grazers that crop close to the crown and move fast across a paddock, which raises both regrowth stress and parasite risk if rotation is too slow. The specific things a pasture system should track for a flock:
- 📊 Botanical diversity by paddock — species mix affects both parasite larvae survival and nutrition
- 📊 Rest-period timing keyed to parasite life cycles, not just forage regrowth
- 📊 Supplemental feed triggers when forage availability drops below a set threshold
- 📊 Lamb growth and flock performance history tied to which paddocks they grazed
Pasture Management for Horses
Horse pasture management centers on hoof and gut health rather than parasite cycling, and carries its own hazard set:
- 🦄 Toxic plant mapping — ragwort, buttercup, and bracken are the standard horse-pasture hazards that pasture software should flag if vegetation surveys pick up the signature
- 🦄 Ground moisture and compaction tracking — directly tied to hoof condition and laminitis risk
- 🦄 Rotational grazing compliance logs, adjustable for weather events or a horse coming off an injury
- 🦄 Veterinary and performance records integrated with the same paddock history


Land Management Planning and Compliance
Longer-term land planning is where pasture and weed data feed into decisions that outlast a single grazing season: where to put water infrastructure, which areas to rest for erosion control, and how to document practices for programs that require proof, not just intent.
Digital record-keeping has become a practical requirement rather than a nice-to-have for operations pursuing federal conservation funding. USDA’s Partnerships for Climate-Smart Commodities program allocated $3.1 billion and mandates digital record-keeping for participating operations, per Precision Farming Statistics 2026. If you’re applying to a program with a similar documentation requirement, check the program’s current rules directly — funding allocations and reporting mandates change between program cycles.
Connectivity is no longer the barrier it once was for running cloud-based tools in the field: 85% of US farms reported having internet access as of the most recent USDA count, and 50% of farms used the internet to purchase agricultural inputs — up 18 percentage points from 2023 — per the USDA ERS America’s Farms and Ranches report. USDA publishes this series annually, typically in summer; the next update is expected around summer 2027.
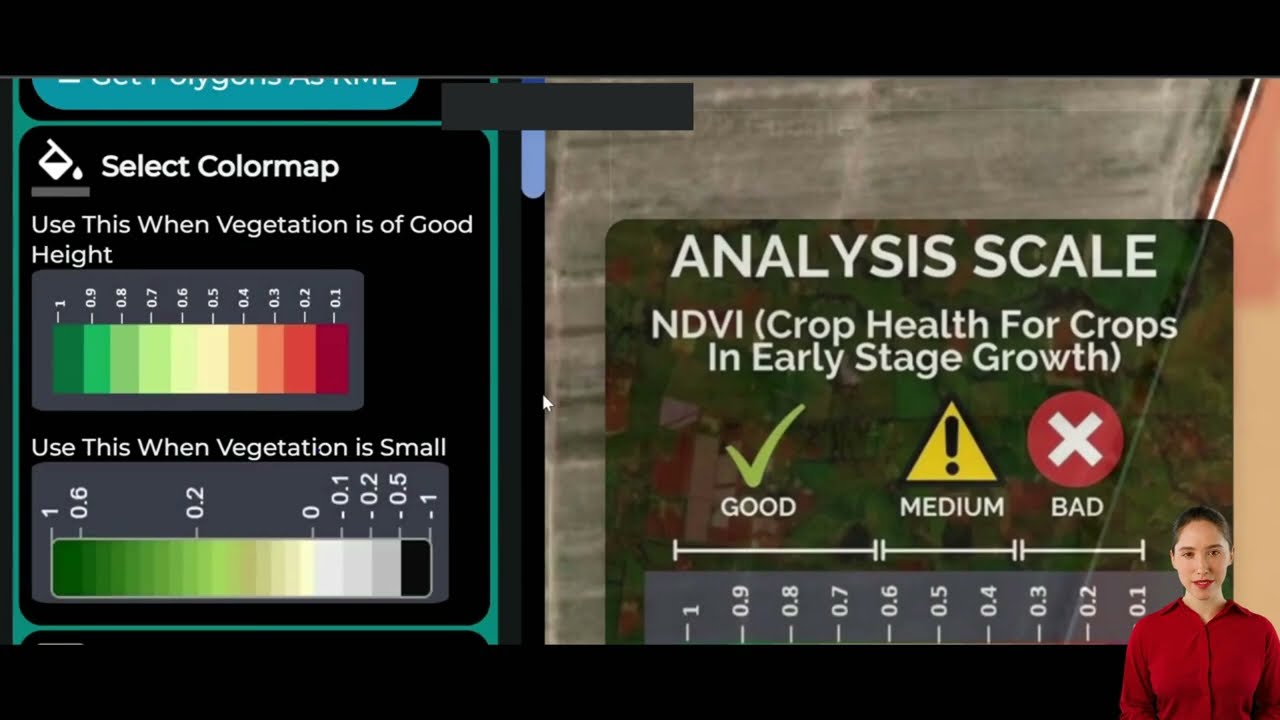
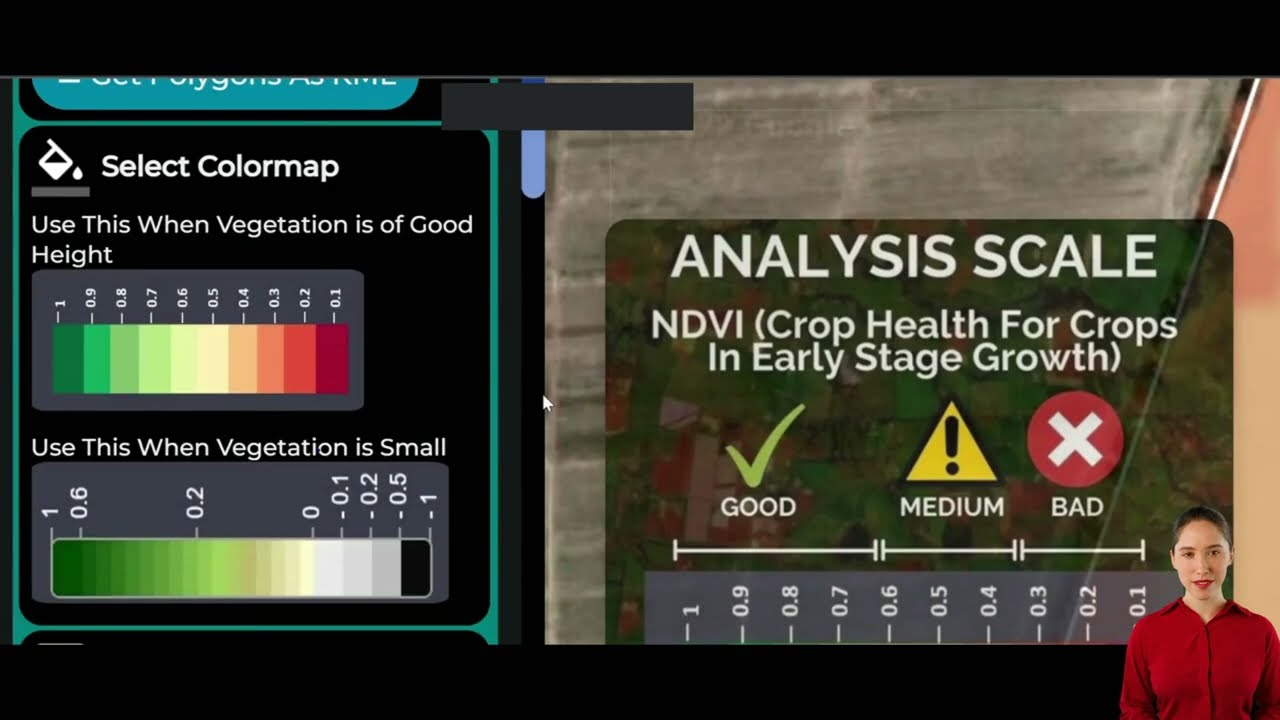
Want guidance on crop plantation, agroforestry, or sustainable rotation planning alongside your pasture data? Check out the Plantation & Forest Advisory Tool for satellite- and AI-driven recommendations.
Comparison Table: Manual vs. Software-Based Pasture Management
| Management Task | Manual / Traditional Method | Software-Based (FMS/Pasture Module) | What You Gain |
|---|---|---|---|
| Weed detection | Walking fields on a fixed schedule; whole-field mechanical passes | Satellite/imagery flags density changes; targeted follow-up only where flagged | Fewer unnecessary passes; documented control events for organic audits |
| Grazing rotation | Calendar-based moves regardless of actual regrowth | Vegetation-index-triggered move alerts based on measured recovery | Rest periods matched to actual forage state, not the calendar |
| Stocking rate | Rule-of-thumb animal units per acre, rarely revisited | Recalculated against current forage estimates and paddock size | Lower overgrazing risk in drought years, better use in strong-growth years |
| Compliance records | Paper logs, filed after the fact | Timestamped, geolocated entries tied to the same field map | Faster, more defensible organic/conservation program audits |
| Land use planning | Static paper maps, revised infrequently | Multi-year zone history informing infrastructure and rest decisions | Decisions based on measured trends rather than memory |
Calculator: Stocking Rate and Rest-Period Planner
Enter your pasture acreage, animal count, and forage growth rate to estimate a sustainable stocking density and a rotation length before you overgraze a paddock.
Run your own numbers
Assumes a daily dry-matter intake of 26 lb per animal unit (a common range midpoint) and that only 50% of standing forage is safely grazable before regrowth is compromised. It excludes drought stress, supplemental feeding, soil type, and species-specific selective grazing behavior — use it as a starting estimate, then adjust against your own paddock history.
How Farmonaut Fits This Stack
Farmonaut’s platform contributes several of the pieces described above rather than being a single monolithic FMS:
- 🌐 Satellite monitoring of crop health, pasture condition, and land use for field-level tracking without manual scouting of every acre
- ☁️ Jeevn AI advisory system for weather forecasts and pasture/weed insights — see Jeevn AI in action
- 🔗 Blockchain-based traceability for supply chain and compliance documentation — see Product Traceability
- 🚜 Fleet and resource management for multi-parcel operations — see Fleet Management
- 🌱 Environmental impact tracking, including carbon and biodiversity indicators, feeding into land management planning
For developers integrating this into an existing FMS or building a custom pasture dashboard, Farmonaut exposes a satellite and weather API, documented at the Developer Docs page.
Access the apps directly:



What to Check Before You Buy a Pasture Management System
This is the durable part of the decision — the checklist below doesn’t expire when this year’s adoption numbers do:
- Ask what “integrated” actually means for this vendor. Does a grazing move in one module update the compliance log automatically, or is that a manual second entry?
- Confirm the imagery refresh interval. Satellite pasture monitoring is only as useful as its revisit frequency — ask specifically, in days, not “regular updates.”
- Check whether pricing scales by acre, by parcel, or by animal unit. A flat per-seat price can be a bad deal at 40 acres and a great one at 4,000.
- Verify offline behavior. With 85% of US farms online per USDA ERS, most fieldwork happens with a signal — but confirm what the app does in the 15% of cases, or in a dead zone on a large ranch, where it doesn’t.
- Ask for the export format of your own records. If the vendor folds or you switch platforms, can you get your grazing and compliance history out in a usable file?
- Test the mobile workflow in the field, not the office. A dashboard that looks clean on a desktop screen and takes six taps to log a paddock move in the field will not get used consistently.
Programs tied to conservation funding are increasingly requiring digital, timestamped records rather than paper logs — the Partnerships for Climate-Smart Commodities program’s $3.1 billion allocation is one example. Getting records digital now, before a program requires it, avoids a scramble at application time.
Frequently Asked Questions
What is pasture management software?
It’s the module within a farm management system that tracks forage growth, grazing rotation, stocking density, and pasture condition — usually combining satellite imagery or sensor data with scheduling and record-keeping tools.
What’s the difference between an FMS and an integrated farm management system?
FMS is the general category. “Integrated” specifically means the platform connects live data sources (satellite, weather, sensors) across modules, so an update in one place — say, a grazing move — automatically reflects in related records like compliance logs, instead of requiring separate manual entry.
Is “farm information management system” different from FMS?
Functionally, no — FIMS and FMS describe the same category of platform. FIMS is more common in academic, extension, and government usage; FMS is more common in commercial marketing. Check what modules are actually included rather than relying on the label.
How many US farms actually use this kind of software?
63% of US farms used farm management software in some capacity as of 2026 per Precision Farming Statistics 2026, and 27% used precision agriculture practices specifically as of 2023 per USDA ERS. Neither figure isolates integrated pasture-specific systems as their own category — that breakdown isn’t published yet.
Does pasture software help with organic certification?
It helps with documentation. USDA’s organic livestock standards require a minimum of 120 days of pasture access annually for certified organic livestock; a system that logs grazing days by paddock gives you the audit trail an inspector will ask for.
How do I start using a digital pasture or farm management system?
Most platforms, including Farmonaut’s, are accessible via web or mobile app with onboarding for different operation sizes (start here). For custom integrations, use the API.
Conclusion
Pasture management software earns its keep by replacing guesswork — fixed rotation calendars, rule-of-thumb stocking rates, memory-based weed checks — with measured data tied to your actual paddocks. The adoption numbers show a real but uneven shift: 63% of US farms use some form of farm management software, but the gap between large and small operations on specific precision tools (70% versus 13% on yield and soil mapping) means the return on a given platform depends heavily on your scale and how much of your pasture data is currently untracked. Pastureland values rising 4.9% in a single year underscores that the land itself is worth managing well, independent of any software decision. The checklist in this article — integration depth, imagery refresh rate, pricing structure, offline behavior, data portability, real field-tested workflow — stays useful regardless of which specific product you’re evaluating or what year you’re reading this.






Subscribe to Farmonaut
Explore satellite-based crop, pasture, and land monitoring tools sized to your acreage and livestock operation.

 Godrej Agrovet
 Hayleys Agriculture
 Linx Agritech
 Adinet
 Save Your Soils
 GalaxEye Space
 Grandstream Algérie
 XOS Realty
 Geospatial Lab Africa
 Agro La Gándara
 HIPSAC
 ZOL Zimbabwe
 Juligerm
 AdBio
AdBio MISE Maroc
 NWNS
NWNS Red August Group
 Farm Inc
 WeMe Global
 Agrotoken
 Blue BearX
 Insignito
 DnCubed
 Indosistim Teknologi
 Liquify Digital
 CU Foods
 BeyondTech Global
 Rouge VC
 AgroRisk
 Oath Inc
 Esri North East Africa
 MDCV UK
 Etech Consulting Madagascar
 Vestlandsforsking
 WB Dev
 Sama Premium
 Tres Valles
 Blickwinkel
 Agricultural Credit Policy Council
 eKGIS
eKGIS Mostas Tech
 Andex
Andex Deluxe Conseil
 WICO
WICO Chimera Innovation
 SkyHarvest
 Teledarbas
 Exurbia Geospatial
 FieldZero
