

Reviewed September 2026 against USDA National Agricultural Statistics Service, USDA Economic Research Service, and Market.us.
Try it: Run your own numbers →
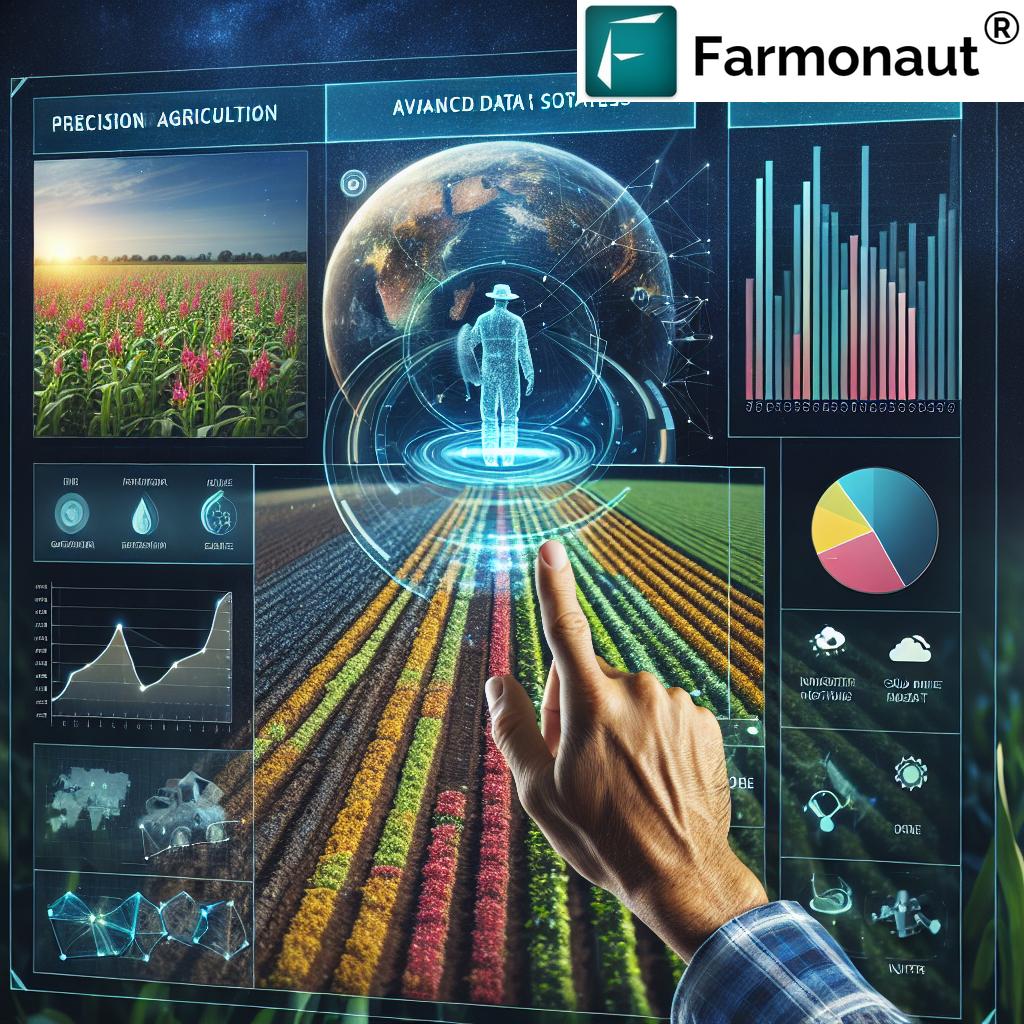
Smart farming IoT solutions and farm decision support tools (DST) are two different things that get shopped for in the same breath: IoT is the hardware and connectivity layer (sensors, autosteer, connected sprayers), while a DST is the software that turns that sensor data — plus satellite imagery and weather — into a specific recommendation, like when to irrigate a tomato block or which zone needs nitrogen first. The US market for the hardware side alone was valued at $2,650 million in 2024, growing at a projected 10.9% CAGR through 2035, according to Market.us. This article covers what each category actually does, how many US farms have adopted which pieces, and what a DST recommendation looks like for a specific crop — tomatoes — since that is the crop most often paired with this search.
Table of Contents
- Smart Farming IoT vs. Farm DST: What’s the Difference
- US Adoption Data: Who’s Actually Using This
- DST for Tomato: What the Software Actually Recommends
- Tomato Irrigation & Yield Planning Calculator
- From Planting to Harvest: Where DST Fits the Crop Cycle
- Choosing Between IoT Hardware and a DST Platform
- FAQs
- Try it: Run your own numbers
Smart Farming IoT vs. Farm DST: What’s the Difference
“Smart farming IoT solutions” usually means physical infrastructure: soil moisture probes, weather stations, connected irrigation valves, autosteer-equipped tractors, and telematics on machinery. A “farm DST” (decision support tool) is the analytical layer that sits above that hardware, or above satellite and public weather data with no hardware at all, and outputs an actual recommendation rather than a raw reading.
The distinction matters because the two categories are priced and adopted differently. IoT hardware requires capital spend per field — sensors, gateways, power — and that spend scales with acreage. A satellite-and-weather-based DST like Farmonaut’s platform skips the field hardware and derives soil moisture and crop stress from multispectral satellite imagery instead, which is why it can serve a five-acre vegetable operation and a 5,000-acre grain operation on the same subscription model.
- Satellite imagery for vegetation health, soil moisture, and stress detection
- IoT sensors and drones for ground-truth and localized data
- Big data analytics that combine both into trend lines
- AI and machine learning that convert trends into recommendations
Farmonaut’s own platform sits mostly in the DST category, layered on satellite data rather than field-installed sensors:
Satellite-Based Crop Health Monitoring
The core system uses multispectral satellite images to track vegetation health via NDVI, soil moisture levels, crop stress indicators, and growth patterns over the season. This is the raw data layer that feeds every recommendation downstream — without it, a DST is just running on weather and guesswork.

Jeevn AI Advisory System
Jeevn AI is the decision-support layer proper: it takes the satellite data plus localized weather forecasts and generates specific, dated recommendations — irrigate this block in the next 48 hours, hold off on nitrogen until stress clears, expect a disease-favorable window this week. This is the part of the platform that functions as a DST rather than a monitoring dashboard.
Blockchain-Based Product Traceability
For agribusinesses and food companies, a blockchain ledger records each stage of a product’s journey from field to buyer, which matters for supply chain audits and increasingly for buyer-side sustainability reporting requirements.

Fleet and Resource Management
For operations running multiple vehicles, fleet tools track usage, safety compliance, and fuel and maintenance costs — the operational layer that sits alongside crop-level DST output.
Carbon Footprinting
Carbon tracking estimates field-level emissions and flags reduction opportunities, which is increasingly requested by grain buyers and food companies documenting supply chain sustainability commitments.
US Adoption Data: Who’s Actually Using This
The USDA Economic Research Service’s most recent comprehensive technology adoption survey (EIB-248, 2023) breaks adoption down by farm size, and the gap between large and mid-size operations is the clearest signal in the data. On large US crop farms, 70% had adopted guidance or autosteer systems, 68% had adopted yield or soil mapping, and 45% had adopted variable rate technology (VRT) for input application. On mid-size crop farms, guidance/autosteer adoption drops to 52% — a 18-point gap driven mostly by per-acre cost, since hardware-based IoT systems don’t scale down in price the way subscription software does.
That 2023 survey is the last full USDA census-level pass on this question; the next comprehensive farm technology census is due in 2027. Between full censuses, USDA’s QuickStats query builder (quickstats.nass.usda.gov) lets you filter more recent partial updates by technology type and farm size class if you need a number closer to today than 2023.
On the software side specifically, IMARC Group’s conservative estimate puts the US farm management software market at $691 million in 2024, and separate analyst consensus puts cloud-based platforms at 72% of the US precision farming software market as of 2025 — most vendors, including satellite-based DSTs, have moved off on-premise installs entirely. There is no published US government adoption rate specifically for farm management software DST tools as distinct from the hardware categories above; the ERS survey tracks hardware adoption, not software subscriptions, so the 691M figure from IMARC is the closest available proxy for software-specific uptake, and it should be treated as a market-size estimate rather than an adoption percentage.
| Category | 2024 US Market / Adoption Figure | Source |
|---|---|---|
| IoT agriculture hardware (market size) | $2,650 million, 10.9% CAGR to 2035 | Market.us |
| Farm management software (market size) | $691 million (conservative estimate) | IMARC Group |
| Guidance/autosteer adoption, large crop farms | 70% | USDA ERS, EIB-248 (2023) |
| Guidance/autosteer adoption, mid-size crop farms | 52% | USDA ERS, EIB-248 (2023) |
| Yield/soil mapping adoption, large crop farms | 68% | USDA ERS, EIB-248 (2023) |
| Variable rate technology adoption, large crop farms | 45% | USDA ERS, EIB-248 (2023) |
| Cloud-based share of US precision farming software | 72% (2025) | Analyst consensus |
Explore Farmonaut’s API for developers who want to pull satellite and weather data directly into an existing farm management system rather than adopting a standalone dashboard.
DST for Tomato: What the Software Actually Recommends
Tomato is one of the more data-responsive crops to run through a DST because both fresh-market and processing tomatoes have narrow windows where irrigation timing, disease pressure, and harvest scheduling each move yield meaningfully. US processing tomato yield was reported at 50 tons per acre for the 2024 crop by USDA NASS, with the 2025 forecast raised to 55 tons per acre. Total US processing tomato production reached 11.1 million tons in 2024. On the fresh market side, USDA NASS reported 269,000 acres planted nationally in 2024, with field-grown fresh market yield at 28,700 pounds per acre.
A tomato-specific DST recommendation typically draws on three inputs at once: satellite-derived soil moisture (to time irrigation against actual crop water status rather than a fixed schedule), NDVI trend (to catch canopy stress before it’s visible from the ground), and short-range weather forecasts (to avoid irrigating or spraying immediately before rain). The output is a dated action — irrigate block 4 within 48 hours, or hold nitrogen application until the stress signal in the northeast quadrant clears — rather than a raw sensor reading the grower has to interpret.
What’s not published anywhere is a peer-reviewed correlation between DST adoption specifically and tomato yield improvement in the US — the academic literature on precision agriculture ROI focuses on hardware categories (autosteer, VRT) covered by the ERS survey above, and DST-specific yield lift data is proprietary to individual software vendors rather than independently verified. If a vendor quotes you a yield-improvement percentage for a DST product, ask what dataset it’s drawn from and over how many seasons; there is no independent US benchmark to check it against yet.
Similarly, there’s no current USDA baseline for per-acre cost of production against a specific DST subscription for tomato growers — USDA publishes historical cost-of-production series and AMS futures-market proxies, but nothing that isolates DST spend as a line item. The way to get a real number for your own operation is to run one season with the DST active on a subset of acreage and compare against your unmonitored fields, using your own input records as the baseline.
Tomato Irrigation & Yield Planning Calculator
Use the USDA NASS yield figures above as your comparison baseline: enter your planted acreage and expected yield per acre to see total production and how it stacks up against the national processing and fresh-market averages.
Run your own numbers
Assumptions: baseline figures are USDA NASS national averages for 2024 (processing) and 2024 field-grown fresh market yield, not regional or soil-adjusted figures. This tool excludes cost of production, input pricing, and weather risk — it compares your projected yield to the national average only, as a planning reference, not a yield guarantee.
From Planting to Harvest: Where DST Fits the Crop Cycle
Growing a crop with a DST layered in changes four decision points across the season, regardless of which crop you’re running:
- Pre-planting: soil moisture and historical NDVI trends inform planting date and zone-level seed rate.
- Vegetative growth: NDVI trend flags stress zones early — often before visible symptoms — so scouting and input timing target the right block instead of the whole field.
- Reproductive/fruiting stage: for tomatoes specifically, this is where irrigation timing has the largest yield impact, since water stress during fruit set and sizing is difficult to correct after the fact.
- Pre-harvest: growth pattern data and weather forecasts inform harvest timing, particularly for processing tomatoes where delivery to the processor is scheduled against maturity windows.
The searchable phrase “farm management software with smart crop planning and rotation tools” points at a related but distinct category: multi-season planning software that tracks field history and suggests rotation sequences. That’s a planning function, not a real-time monitoring or DST function, and it sits closer to record-keeping software than to the satellite-and-AI advisory tools covered here — worth knowing the difference before you shop, since the two are priced and built differently.
climate-resilient farming strategies increasingly lean on this same data: soil moisture trend and NDVI history help identify which fields are becoming marginal under shifting rainfall patterns before a bad season forces the decision.
Explore Farmonaut’s API Developer Docs
Choosing Between IoT Hardware and a DST Platform
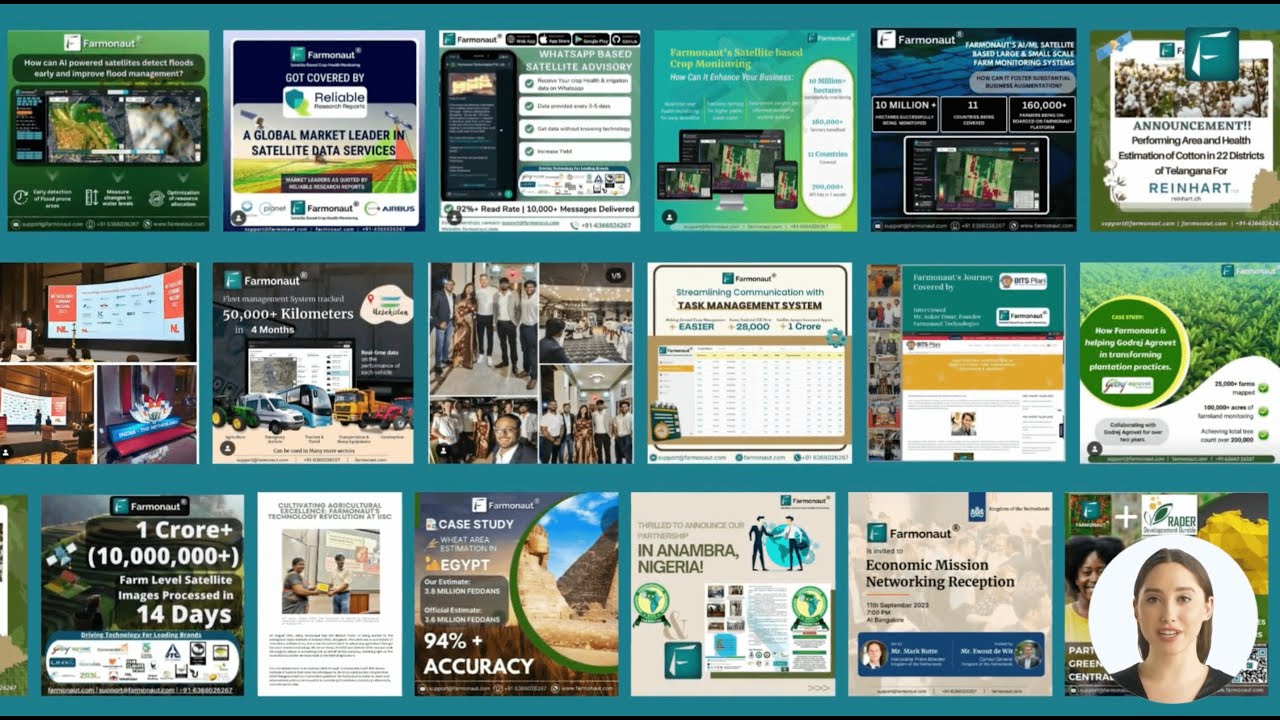
Farmonaut’s platform operates on a subscription model with tiers for individual farmers, cooperatives, large agribusinesses, and government institutions, plus direct API access for developers integrating satellite and weather data into an existing system. The practical choice between adding IoT hardware and adopting a satellite-based DST usually comes down to three factors:
| Factor | IoT Hardware (sensors, autosteer, VRT) | Satellite-Based DST |
|---|---|---|
| Upfront cost | Scales with acreage and field count | Subscription, largely acreage-independent per field |
| Field infrastructure needed | Yes — sensors, gateways, power | None — satellite and weather data only |
| Ground-truth precision | High (direct in-field measurement) | Moderate — inferred from imagery, best paired with periodic scouting |
| 2023 US adoption, large farms | 70% autosteer, 45% VRT (USDA ERS) | Not separately tracked by USDA; software market $691M (IMARC, 2024) |
| Best fit | Large, capital-equipped row-crop operations | Operations of any size wanting field-level monitoring without hardware install |
Small and medium-sized farmers seeking affordable precision farming tools are typically better served starting with a satellite-based DST, since it avoids the per-field hardware spend that keeps mid-size farm adoption 18 points behind large farms in the ERS data above. Large-scale agribusinesses already running autosteer and VRT get more value layering a DST on top for the analytical and advisory piece those hardware systems don’t provide on their own.

Government agencies and NGOs implementing sustainable farming initiatives, financial institutions offering crop loans and insurance, and corporate clients in textiles and food production requiring supply chain transparency round out the platform’s target users beyond individual growers — each drawing on a different combination of the monitoring, traceability, and carbon-tracking features above.
Adoption barriers that show up consistently regardless of farm size include data privacy and security concerns, rural internet connectivity gaps that limit real-time data transfer, farmer education and the learning curve of a new system, and integration friction with whatever farm management system is already in use. None of these are solved by picking hardware over software or vice versa — they’re operational hurdles that apply to any new system layered onto an existing operation.

A Durable Way to Check This Yourself
Because market-size and adoption figures shift every reporting cycle, use this three-step check rather than relying on any single number in this article:
- For hardware adoption rates by farm size and technology type, query USDA ERS’s data directly through quickstats.nass.usda.gov, filtering by technology and farm size class; the next full census-level survey is due in 2027.
- For tomato yield and production figures, check USDA NASS’s tomato publications page during the California growing season (April–September) for in-season estimates, and the quarterly reports after harvest for finalized numbers.
- For market-size figures on IoT agriculture or farm software, cross-check at least two analyst firms (Market.us, IMARC Group, or Grand View Research) since methodologies diverge by as much as 15–20% between them — treat any single-source market-size figure as directional, not exact.
FAQs
- What’s the difference between smart farming IoT and a farm DST?
IoT is hardware — sensors, autosteer, connected equipment. A DST (decision support tool) is software that turns sensor, satellite, and weather data into a specific, dated recommendation. Farmonaut’s platform is primarily a satellite-based DST rather than a hardware IoT system. - How big is the US smart farming IoT market?
Market.us valued the US IoT agriculture market at $2,650 million in 2024, projecting a 10.9% compound annual growth rate through 2035. - What percentage of US farms use precision agriculture technology?
Per USDA ERS’s 2023 survey (EIB-248), 70% of large US crop farms use guidance/autosteer systems versus 52% of mid-size farms; 68% of large farms use yield/soil mapping; 45% use variable rate technology. - What does a DST recommend for tomatoes specifically?
A tomato-focused DST combines satellite soil moisture, NDVI stress trends, and short-range weather forecasts to output dated actions — for example, an irrigation window before fruit set or a hold on nitrogen until stress clears in a specific zone. - What’s the current US tomato yield?
USDA NASS reported 50 tons per acre for processing tomatoes in 2024, with 55 tons per acre forecast for 2025. Fresh market field-grown yield was 28,700 pounds per acre in 2024, across 269,000 acres planted nationally. - Does farm management software include crop rotation planning?
Some platforms do, but rotation and multi-season planning tools are a distinct category from real-time satellite/DST monitoring — check whether a given product tracks field history for planning or provides live in-season recommendations, since the two are usually built and priced differently.

 Nivia
Nivia Doodlakine
 Exurbia Geospatial
 FieldZero
 Indico Company
 Kubota
 FFBS
FFBS Jontra
 Kalustyan
 Tucor
Tucor Geno
Geno Hayleys Agriculture
 Linx Agritech
 Adinet
