
Reviewed August 2026 against USDA Economic Research Service, USDA NASS and Defra farm statistics.
Try it: Farm software break-even calculator →
Agriculture Management Software: What It Costs Per Acre
Agriculture management software is the record-keeping and decision layer of a farm business: field boundaries, crop plans, input applications, machinery logs, compliance records and — in cloud-based products — satellite imagery and weather pulled in automatically. Farm management, in the plain sense, is the job of deciding what goes on each acre and proving afterwards what actually went on it. The honest headline is that adoption is sharply split by farm size: USDA’s Agricultural Resource Management Survey put guidance and auto-steer use at 52% of midsize farms and 70% of large-scale crop farms in 2023, against roughly 10% of the smallest corn farms in 2016, per the USDA Economic Research Service.
What Precision Agriculture Software Actually Does
Precision agriculture software is the subset that treats a field as many small units rather than one. It ingests a spatial data layer — satellite imagery, a yield map, an EC or grid-soil survey — and turns it into either a map you look at or a prescription file a controller executes. Everything else in a farm platform (invoices, spray diaries, staff tasks) is management software; the precision part begins where the recommendation changes between one part of a field and another.
ERS’s report Precision Agriculture in the Digital Era: Recent Adoption on U.S. Farms, published 22 February 2023 by McFadden, Njuki and Griffin, tracks six technologies across 1996–2019 ARMS data: soil maps, yield maps, yield monitors, variable-rate technology, guidance/auto-steer and aerial imagery. Auto-steer is the outlier — it is on well over half of planted acreage for corn, cotton, rice, sorghum, soybeans and winter wheat, while yield maps, soil maps and VRT sit at 5–25% of total planted acreage for winter wheat, cotton, sorghum and rice. Read the full report at ERS publication 105893; ARMS is re-fielded annually, so newer crop-years appear there first.
Cloud-Based Agriculture Software vs Desktop vs Spreadsheet
“Cloud based farm management software” is not a feature — it is a deployment choice with specific consequences for who can see the data and what happens when the office PC dies. The table below sets out what actually differs.
| Capability | Spreadsheet / paper | Desktop farm software | Cloud-based platform |
|---|---|---|---|
| Access from the field | No | Only if synced manually | Browser or phone, any device |
| Satellite imagery refresh | None | Manual download of scenes | Automatic on each cloud-free pass |
| Multiple users on one field record | Conflicting copies | One machine at a time | Concurrent, with audit trail |
| Data survives hardware failure | No | Only with your own backup | Vendor-side redundancy |
| Works with poor connectivity | Yes | Yes | Needs offline mode — check this |
| Typical cost shape | Sunk time | One-off licence + upgrades | Per-acre or per-seat subscription |
| Export if you leave | You own the file | Local files, proprietary format | Depends entirely on export terms |
The last row is the one that gets skipped. Ask, before you sign, for a sample export of shapefiles or GeoJSON boundaries plus a CSV of application records. A vendor who cannot produce one in a demo will not produce one at renewal.

The Adoption Gap Is About Acres, Not Enthusiasm
ERS found that 73% of farms in the largest size category had adopted guidance for corn in 2016, against 10% of the smallest. By the 2023 ARMS cycle reported in America’s Farms and Ranches at a Glance (December 2024), guidance sat at 52% of midsize farms and 70% of large-scale crop farms, with yield monitors, yield maps and soil maps together on 68% of large-scale crop farms. Small family farms — gross cash farm income under $350,000 — remained lowest across every category.
That gap has a structural cause. The 2022 Census of Agriculture, released 13 February 2024 by USDA NASS, counted 1.9 million farms on 880 million acres, averaging 463 acres. But 105,384 farms with sales of $1 million or more — 6% of farms — held 31% of farmland and sold more than three-quarters of all agricultural products, while the 1.4 million farms selling $50,000 or less made up 74% of farms and 2% of sales. Per-seat pricing that is trivial for the first group is prohibitive for the second.
Work Out Your Own Cost Per Acre
Take whatever subscription quote you have been given and run it against your own acreage and input bill rather than a vendor’s case study.
Farm software break-even calculator
Assumptions: the default 463 acres is the US average farm size from the 2022 Census of Agriculture — replace it with yours. The model excludes hardware, controller retrofits, connectivity, training time, yield effects and tax treatment. It values saved time at a rate you set, not a published wage series.
The UK Farm Management Software Market
The UK picture is driven less by acreage than by margin pressure and compliance. Defra's Farm Business Income forecasts for England, published 12 March 2026, put cereal farms at £17,000 average FBI for 2025/26, down 66%; general cropping at £54,000, down 50%; and dairy at £224,000, up 45% on higher milk volumes. Defra attributes the arable falls to lower cereal output and the reduction in the delinked Basic Payment. Check the Defra Farm Business Income series for the next forecast round before budgeting a subscription against it.
Demand for software in England tracks the paperwork, and the paperwork is already near-universal. Defra's Farm Practices Survey, February 2025 found 64% of farms had a nutrient management plan — the highest since the series began in 2011 — with 78% regularly testing soil nutrient indices, 80% testing soil pH, 68% calculating a whole-farm N, P or K balance, and 59% tracking soil organic matter. Those are the records a UK platform has to hold. The survey runs annually; the GOV.UK release page carries the dataset broken down by region, farm type and farm size.
The Satellite Layer Is Free — The Software Is What You Pay For
Understanding this changes how you read pricing. The imagery inside most cloud agriculture platforms is public data. ESA's Copernicus Sentinel-2 constellation delivers a 5-day revisit at the equator, a 290 km swath and 13 spectral bands at 10 m, 20 m and 60 m resolutions, per ESA's Sentinel-2 facts and figures. Landsat 9 has a 16-day repeat cycle, or 8 days paired with Landsat 8, at 30 m multispectral and 15 m panchromatic; NASA states that free Landsat data contributed an estimated $25.6 billion to the US economy in 2023 (NASA Landsat 9).
So when a vendor quotes per-acre pricing, you are buying atmospheric correction, cloud masking, field-level aggregation, alerting and storage — not pixels. That also sets a hard ceiling on what any platform can promise: on a 5-day nominal revisit, cloud cover in a wet spring can leave you two or three usable scenes in six weeks. Any product claiming daily field-level optical monitoring is either buying commercial tasking or interpolating. Ask which.
A Seven-Question Test That Outlasts Any Feature List
Feature lists change every release. These questions do not, and you can put all seven to a salesperson in one call:
- Which satellite, at what resolution? If the answer is "high resolution" without a sensor name and a pixel size, the imagery is Sentinel-2 at 10 m. That is genuinely useful — just price it accordingly.
- How many usable scenes did my postcode or county get last season? A serious platform can pull its own archive and tell you. This is the single best cloud-cover reality check.
- What does the prescription file export as? Shapefile, ISOXML, or a controller-specific format. Confirm it against the terminal you actually own.
- Who owns the agronomic data, and can I bulk-export it? Get the clause number, not a reassurance.
- What happens offline? A cloud platform with no offline capture is unusable in a field with one bar of signal.
- Is pricing per acre, per field, per user, or flat? Run all four shapes through the calculator above; the cheapest headline rarely stays cheapest as you add rented ground.
- What is the published uptime and support response time? Spray windows are measured in hours.
Anchor the answers to public benchmarks rather than to the vendor's own case studies. If a platform claims adoption is transforming your sector, check it against the ARMS series above; if it claims a payback figure, check it against Defra's or ERS's income forecasts rather than a testimonial.
Where Farmonaut Fits
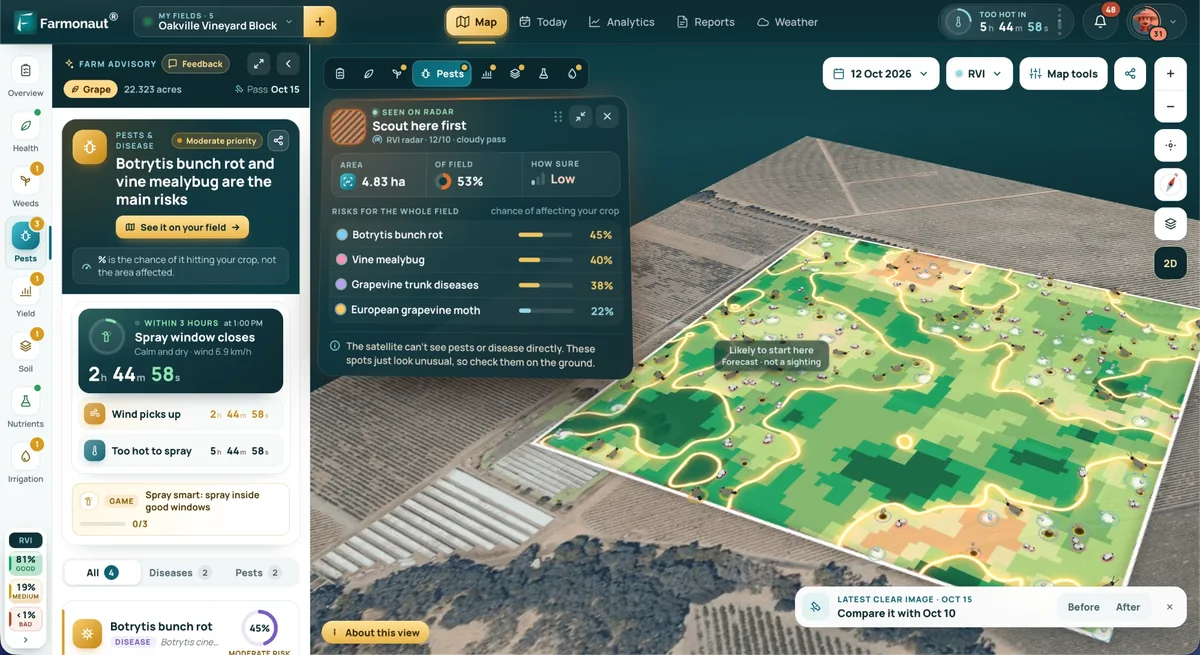
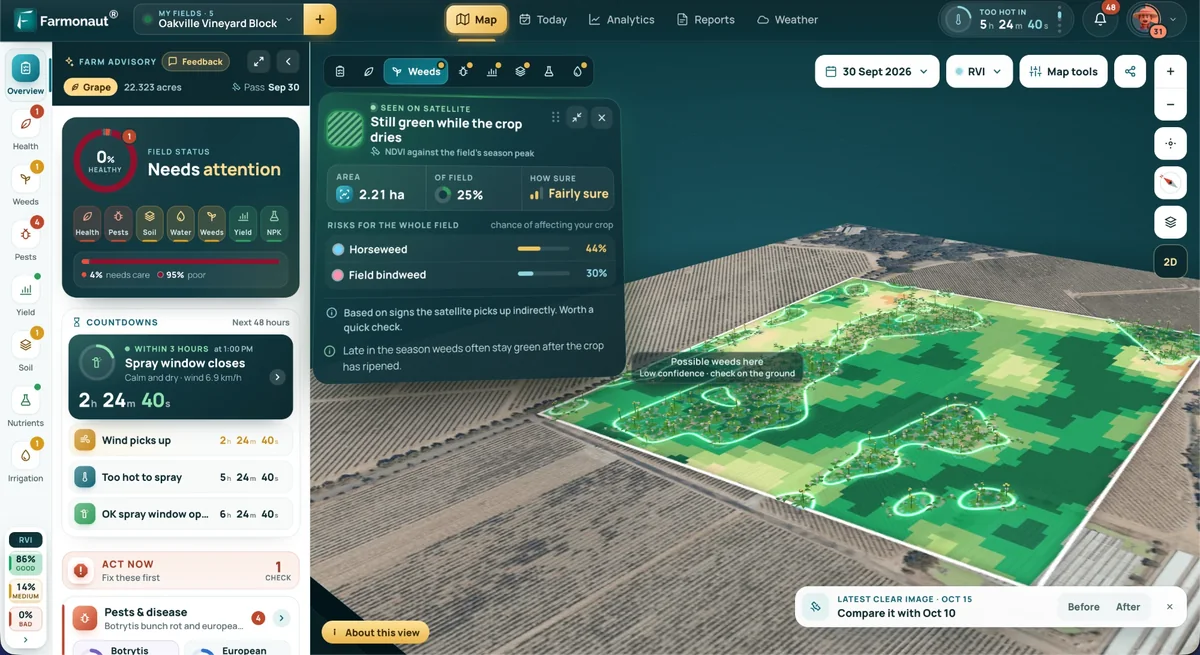
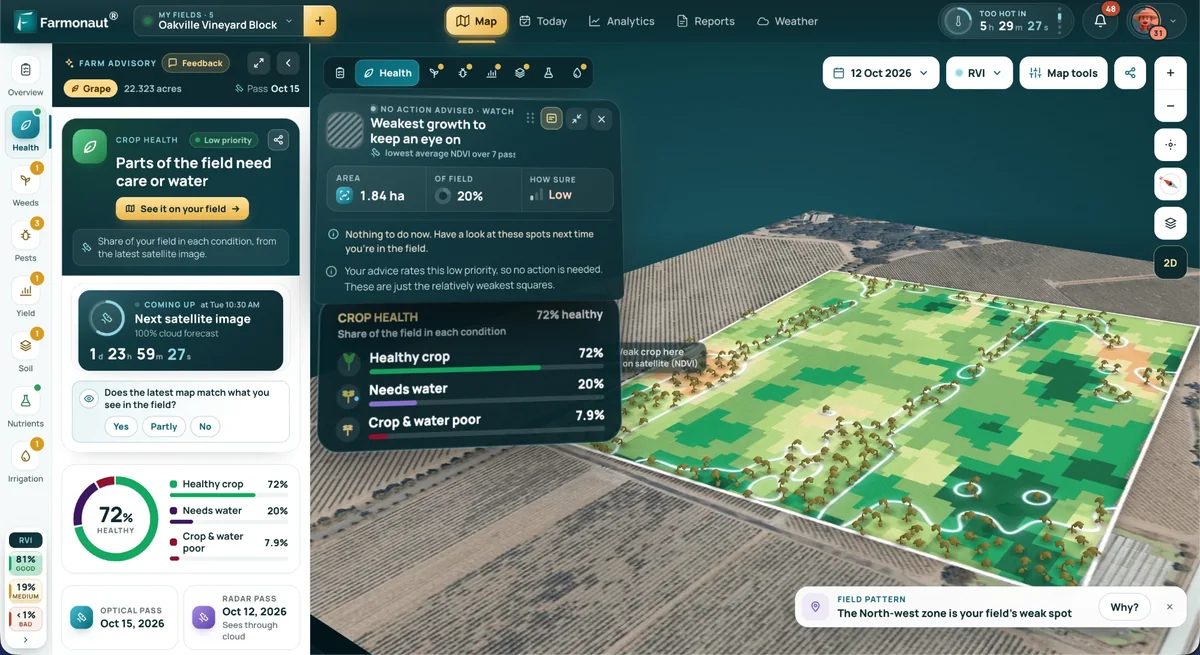
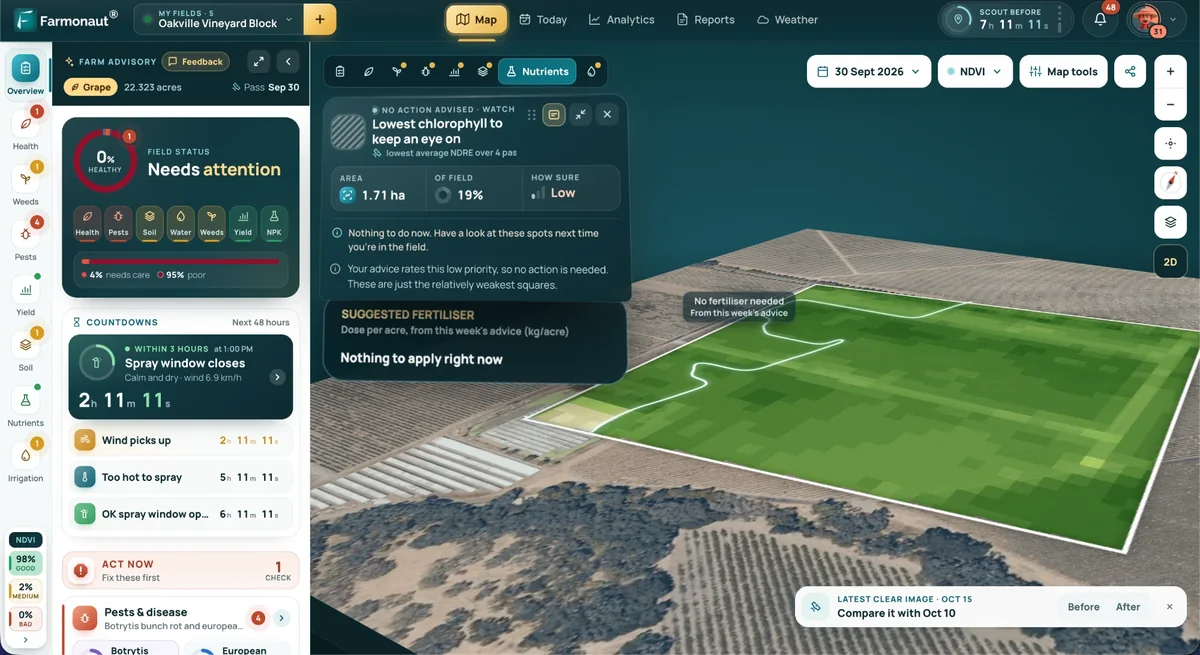
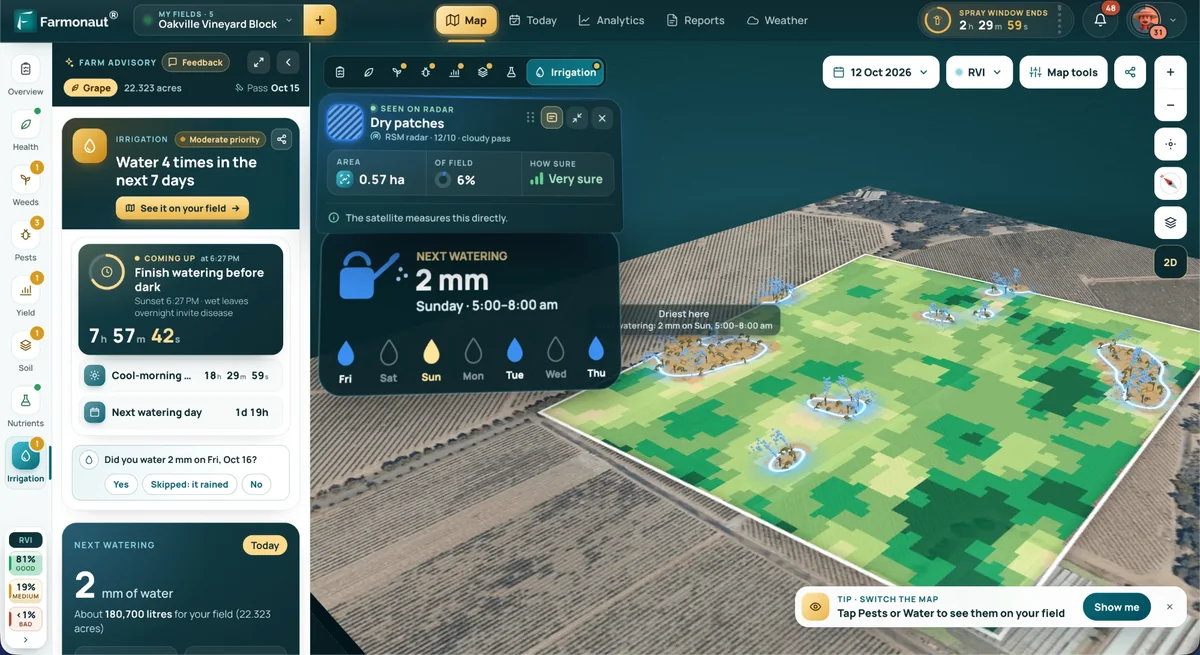
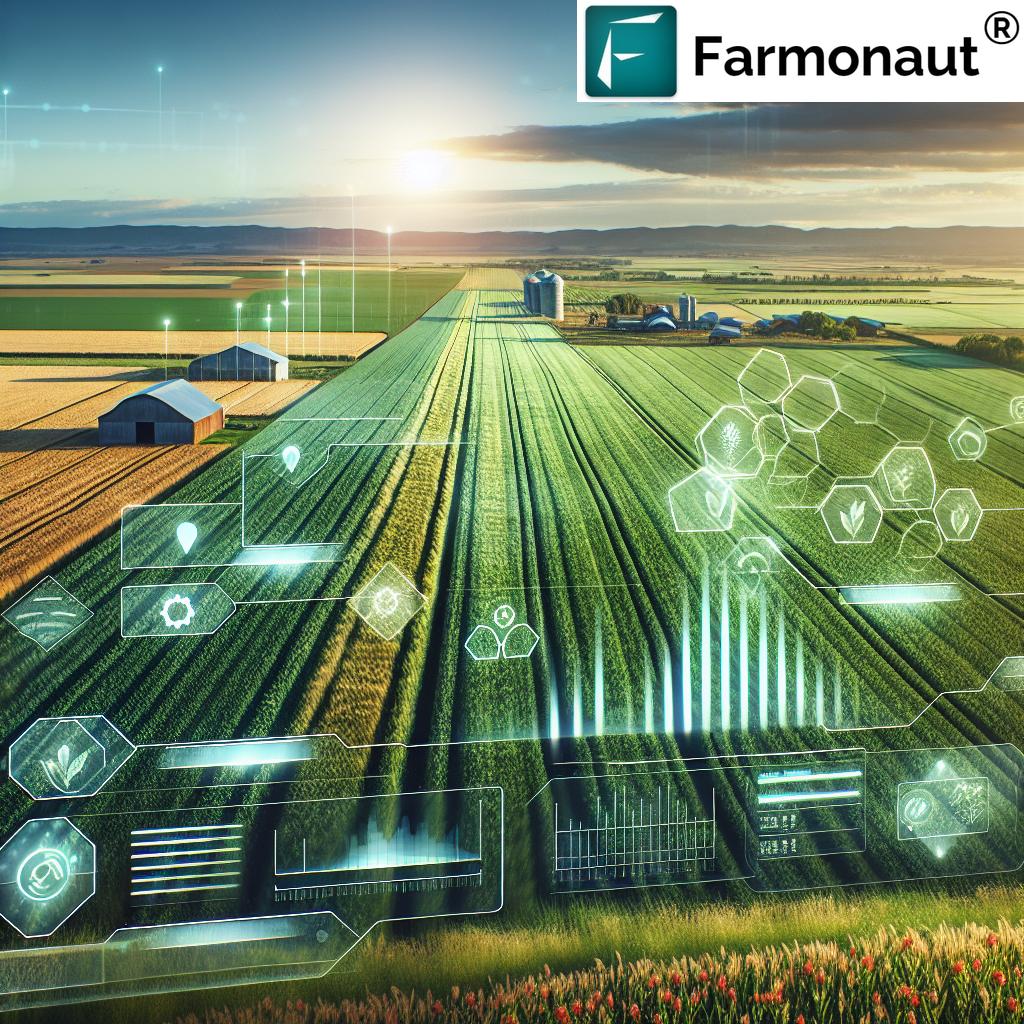
Farmonaut is a cloud-based platform built on that public satellite layer, with field-level vegetation and soil-moisture indices, weather, and traceability records, reachable from a browser or phone without buying hardware. Two worked examples on this site show the range: cloud farm software across UK and Canadian holdings, and satellite crop monitoring at scale in Brazil's Mato Grosso. The same remote-sensing stack is applied outside the agriculture side of the business too — for instance in AI-assisted prospecting in Alaska — which is a useful sanity check on whether a vendor's imagery pipeline is real infrastructure or a reseller skin.

The Macro Backdrop You Are Budgeting Against
ERS's farm income forecast, updated 7 May 2026, puts 2026 US net farm income at $153.4 billion — down $1.2 billion (0.7%) in nominal terms and 2.6% after inflation against 2025 — with net cash farm income at $158.5 billion, up 3.0%. Average net cash farm income per farm business is forecast to rise 18.7% to $135,000. ERS revises this several times a year; take the live figure from the ERS farm income highlights page rather than from this article when you build a case.

FAQ
Q: What is farm management, in the software sense?
A: The planning, execution and record of every operation on every field — crop plan, inputs applied, machinery hours, labour, yields and the compliance paperwork that proves it. Software digitises that ledger; precision software adds a spatial layer so decisions vary within a field.
Q: What is precision agriculture software, specifically?
A: Software that converts a spatial data layer into either a map or a machine-readable prescription. USDA ERS tracks six such technologies in ARMS: soil maps, yield maps, yield monitors, variable-rate technology, guidance/auto-steer and aerial imagery.
Q: Is cloud-based agriculture software worth it on a small farm?
A: Run your own numbers in the calculator above. On the 2022 Census average of 463 acres, a $1,200 subscription is $2.59 per acre per year; whether that pays depends on your input spend per acre and how much recordkeeping time it removes. ERS data shows adoption falls steeply below $350,000 gross cash farm income, which reflects economics rather than attitude.
Q: How big is the UK farm management software market?
A: Published market-size estimates come from paid research firms and are not independently verifiable, so treat them cautiously. The verifiable demand signals are official: Defra's Farm Practices Survey shows 64% of English farms holding a nutrient management plan in February 2025, and the Farm Business Income forecasts show cereal margins under severe pressure at £17,000 for 2025/26 — a market where software has to demonstrate payback, not novelty.
Q: How often will I actually get a satellite image of my field?
A: Sentinel-2's nominal revisit is 5 days at the equator and shorter at mid-latitudes, but cloud cover decides usable frequency. Ask any prospective vendor how many cloud-free scenes your specific location received in the last completed growing season.
Try the platform against your own fields:

API Access — pull indices and weather into your own stack.
Android App

iOS App

Discussion
Questions, corrections or field experience? Share them below. First-time comments are reviewed before they appear, and your email is never published.
No comments yet. Be the first to add a question or your experience.

 Red Dog Management
 Liquify Digital
 Ascentya
 CU Foods
 BeyondTech Global
 Rouge VC
 AgroGreen Dynamics
 AgroRisk
 Oath Inc
 Reddane Farming
 Esri North East Africa
 Cresol
 Atur Kuliner
 MDCV UK
 Zerella Group
 Etech Consulting Madagascar
 Vestlandsforsking
 Delicio
 WB Dev
 Sama Premium
 Prochecker
 Tres Valles
 LACOS Geoinformation
 Exploration consultancy · South Africa · Gold
 Licence holder · Niger · Gold