

Reviewed August 2026 against USDA NASS, NOAA NCEI and University of Missouri Extension.
Short answer: for most outdoor field and row crops in flower, an air-referenced vapour pressure deficit of 0.9 to 1.8 kPa during pollen-shed hours keeps anthers dehiscing without desiccating the pollen. That range is not a constant — it is what the 40–70% relative-humidity window that University of Missouri Extension gives for tomato pollen transfer works out to at 24 °C. At 18 °C the same humidity window is 0.62–1.24 kPa; at 33 °C it is 1.51–3.02 kPa. Any page that hands you a single “ideal VPD for flowering” figure without naming the air temperature it applies to has given you a number that is wrong at both ends of your season.
Best VPD for Flowering Outdoors: The Reachable Window at Every Air Temperature
Table of Contents
- Why a single “flower VPD” number fails outdoors
- Best temperature for the flowering stage in Celsius
- Best VPD for flowering: the full temperature × humidity table
- Calculator: where does your field sit right now?
- VPD during flower drifts hour by hour
- Cotton flowering stage: bloom to cutout
- The five-step flowering-window check
- How to get numbers fresher than these
- Monitoring flowering-stage microclimate with Farmonaut
- FAQ
Why a Single “Flower VPD” Number Fails Outdoors
Most VPD charts circulating online were built for sealed indoor rooms, where you set air temperature and humidity independently and reference VPD against a leaf that runs a few degrees below air. Outdoors you set neither. You inherit both from the atmosphere, and the two are locked together by the Tetens equation for saturation vapour pressure:
es(T) = 0.6108 × exp( 17.27 T / (T + 237.3) ) kPa | VPD = es(T) × (1 − RH/100)
Saturation vapour pressure roughly doubles every 11 °C. At 15 °C it is 1.71 kPa; at 36 °C it is 5.94 kPa. So a grower holding 60% relative humidity steady across that span still moves from 0.68 kPa to 2.38 kPa of deficit without touching anything. Chasing “1.0–1.5 kPa” as a fixed setpoint means chasing roughly 27–52% humidity at 18 °C and 70–80% humidity at 33 °C — one of which is achievable in a Texas July and one of which is not.
The second reason the single-number approach misleads: at flowering, temperature is usually the binding constraint, not VPD. A controlled-environment study of upland cotton published 2 October 2025 in Frontiers in Plant Science (PMC12528077) ran four day/night regimes at ambient CO₂ (425 ppm) and measured boll retention directly. Retention fell from 93% under the optimum 33/21 °C regime to 21% under 36/28 °C. Pollen grain counts dropped 13%, 24% and 39% across the three stress regimes relative to the optimum. Micronaire under high day temperature and elevated CO₂ came in at 2.95, below the 3.4 level where low-micronaire discounts start; the premium range is 3.7–4.2 (Alabama Cooperative Extension), with fibre length down 7%.
A three-degree lift in night temperature alone (33/21 to 33/24 °C) cost seven points of retention. A three-degree lift in day temperature (33/24 to 36/24 °C) cost forty-one. Nothing you do to humidity recovers that.

Best Temperature for the Flowering Stage in Celsius
US extension services publish flowering thresholds in Fahrenheit; the research literature uses Celsius. Converted onto one scale, the published numbers cluster tightly. Below are the thresholds from sources that state them explicitly, rather than a consensus range assembled from nowhere.
Two things jump out of that plot. First, the night thresholds are far tighter than the day ones — every source puts the night ceiling between 21.1 and 22.2 °C, and David Trinklein at the University of Missouri adds a floor: below 55 °F (12.8 °C) at night, pollen viability and pollen-tube growth rate both drop and blossom drop follows. Second, cotton’s optimum day temperature (33 °C) sits above tomato’s abort threshold (32.2 °C). “Best temperature for flowering stage” is species-specific by a full ten degrees, and averaging across crops produces a number correct for none of them.
The abort mechanism has a clock on it. Jerry Brust of University of Maryland Extension, writing in the Delaware Weekly Crop Update on 20 June 2014, notes that several days or nights above 90 °F day or 72 °F night will make the plant abort flowers and fruit, that pollen turns sticky and non-viable at those temperatures, and that a tomato flower must be pollinated within 50 hours or it aborts regardless. Two consecutive bad mornings is enough to lose that cohort.
Best VPD for Flowering: The Full Temperature × Humidity Table
This is the block that replaces the single-number chart. Every cell is VPD in kPa computed from the Tetens equation above. Cells inside 0.9–1.8 kPa are shaded — the band equivalent to the 40–70% relative humidity window that University of Missouri Extension gives for effective pollen transfer, evaluated at 24 °C.
| Air temp | es (kPa) | VPD @ 80% RH | VPD @ 70% RH | VPD @ 60% RH | VPD @ 40% RH | Flowering read |
|---|---|---|---|---|---|---|
| 15 °C | 1.71 | 0.34 | 0.51 | 0.68 | 1.02 | Cannot reach 1.0 kPa above 40% RH. Anther dehiscence limited, Botrytis pressure high. |
| 18 °C | 2.06 | 0.41 | 0.62 | 0.83 | 1.24 | Good night-temperature zone; daytime deficit still marginal for pollen release. |
| 21 °C | 2.49 | 0.50 | 0.75 | 1.00 | 1.49 | At or just under every published night ceiling. Ideal early-bloom morning. |
| 24 °C | 2.98 | 0.60 | 0.90 | 1.19 | 1.79 | The whole 40–70% RH window lands inside 0.9–1.8 kPa. Reference condition. |
| 27 °C | 3.57 | 0.71 | 1.07 | 1.43 | 2.14 | Needs ≥50% RH to stay in band. Cotton comfortable; tomato approaching its day ceiling. |
| 30 °C | 4.24 | 0.85 | 1.27 | 1.70 | 2.55 | Past tomato’s 29.4 °C day ceiling. VPD is no longer the limiting factor. |
| 33 °C | 5.03 | 1.01 | 1.51 | 2.01 | 3.02 | Cotton optimum day temperature; 1.5 kPa needs 70% RH, which the arid West will not supply. |
| 36 °C | 5.94 | 1.19 | 1.78 | 2.38 | 3.57 | Cotton retention 45% at 36/24 °C, 21% at 36/28 °C. Manage temperature, not deficit. |
The plot below shows the same thing as spans rather than cells: how far VPD moves between 70% and 40% humidity at each air temperature, against the 0.9–1.8 kPa target band.
Where does the low end bite? A study of strawberry pollination published 25 February 2025 in Frontiers in Plant Science (PMC11863501) held air at 25 °C and tested three humidities — 35%, 50% and 90% RH, equal to 2.06, 1.58 and 0.33 kPa. The pollen clump ejection index was highest at 2.06 kPa and the index passed 1.0 after two hours for tall stamens and after three to six hours for short and medium stamens. Anther dehiscence is a physical drying event. At 0.33 kPa ejection was lower, and strawberry needs 70–80% of its several hundred pistils fertilised to make a marketable berry. That is the mechanism behind every wet-spring fruit-set failure, and it is why “keep humidity high to protect the flowers” is bad advice.

VPD Chart for Flowering: Published Ranges by Crop
No single study sets one flowering VPD for every crop. These are the ranges that university, extension and peer-reviewed sources actually state. Where a source gives relative humidity, it is converted to VPD at 24 °C with the Tetens equation above.
| Crop and setting | What the source reports | VPD | Source |
|---|---|---|---|
| Tomato, field | 40–70% RH for pollen transfer | 0.9–1.8 kPa at 24 °C (converted) | University of Missouri |
| Tomato, greenhouse | 60–70% RH improved pollen and fertilisation vs 30–40% RH | 0.9–1.2 kPa at 24 °C (converted) | Shamshiri et al., 2018 |
| Tomato, greenhouse | 0.2–1.0 kPa described as ideal for pollination and limiting fungal disease; above 1.5 kPa causes wilting and leaf roll | as stated | Shamshiri et al., 2018 |
| Strawberry | Pollen clump ejection highest at 2.06 kPa, against 1.58 and 0.33 kPa, at 25 °C | as stated | Frontiers in Plant Science, 2025 |
| Cannabis, indoor flowering | 1.0–1.5 kPa cited as optimal; 0.25 kPa cut flower biomass 71% and delayed flowering about three weeks | as stated | Corredor-Perilla et al., 2025 |
| Greenhouse crops, general | 0.45–1.15 kPa ideal; 1.15 kPa or above is high; 0.1–0.45 kPa is low | as stated | e-GRO, University of Georgia, 2018 |
Read the table in two groups. The tomato and general greenhouse figures sit mostly between 0.4 and 1.2 kPa, because greenhouse targets also have to limit wilting and fungal disease across the whole day. The strawberry and cannabis work points higher during flowering itself, at 1.0 kPa or more, because anthers need to dry to release pollen and dense flowers rot in humid air. For outdoor crops, use the morning figure, when pollen is shed, and check it against the crop’s own heat limit before acting on humidity.
Calculator: Where Does Your Field Sit Right Now?
Enter the air temperature and humidity from your nearest hourly station, plus how far below air your leaves are running if you have an infrared thermometer, and this returns both VPD references against the humidity band you are targeting.
Run your own numbers
Assumptions and exclusions: Tetens saturation vapour pressure, air pressure effects ignored (adds under 1% below 1,000 m). Only the 40–70% band is drawn from a cited extension source; the other two are provided for sensitivity testing, not as recommendations. Leaf-referenced VPD assumes a uniform offset, which overstates deficit for shaded lower-canopy flowers. Excludes wind speed, soil water status, boll or fruit load, and cultivar heat tolerance — all of which shift the real threshold.
VPD During Flower Drifts Hour by Hour
Daily mean VPD is close to useless for flowering decisions, because pollen shed is a morning event and mean VPD is dominated by the mid-afternoon peak. What matters is the deficit between roughly 8 a.m. and noon, when anthers dehisce and stigmas are receptive. The line below traces what happens to a grower who successfully holds 60% relative humidity all day while air temperature climbs — the deficit more than triples, and passes out of the target band by the time it reaches the mid-twenties.
The background is drifting too. NOAA's National Integrated Drought Information System reported on 9 November 2021 on an analysis of 1979–2020 western US data attributing 68% of the observed VPD increase to human-caused warming and 32% to natural weather patterns, with surface warming accounting for 80% of the rise. Burned area across eleven western states went from 1.69 million acres over 1984–2000 to about 3.35 million over 2001–2018, and 8.8 million acres in 2020. If you farm west of the 100th meridian, the upper edge of your flowering VPD band is being pushed at from underneath, and the direction is one-way on the decadal scale.

Cotton Flowering Stage: Bloom to Cutout
Cotton is the crop where flowering-stage climate management pays or costs the most, because the bloom period is short, indeterminate and monitored with a published index. Guy Collins and Keith Edmisten of NC State Extension, writing 7 July 2024, note that first-position fruit bloom in sequence up the plant with a new bloom every three days, that weekly water requirements start rising in the second week of bloom and peak in weeks three and four, and that early-planted cotton just entering bloom carries no heavy boll load yet and can rebound from drought stress — while a plant deep into bloom cannot.
Growers track the window with nodes above white flower (NAWF). Texas A&M AgriLife says unstressed cotton should carry 8–9 NAWF in the first week of bloom and lose 1–1.5 nodes a week, reaching 5 NAWF, the usual cutout point, in the fourth week of bloom (Texas A&M AgriLife). That gives an effective fruiting window of about three to four weeks. Everything in the boll-retention waterfall above happens inside those weeks.
What that costs at the national scale
The USDA NASS Crop Production 2025 Summary, approved 12 January 2026, put 2025 all-cotton production at 13.9 million 480-pound bales from 7.80 million harvested acres, a US yield of 856 pounds per harvested acre — down 30 pounds from 2024 and down 3% in production. NASS publishes this summary each January and revises it, so treat 856 lb/acre as the January 2026 estimate rather than a permanent figure and check the current summary before quoting it. At 856 lb/acre, a retention loss of the size seen between the 33/21 °C and 36/24 °C chamber regimes — 93% down to 45% — is not a marginal yield question. It is the difference between a crop and a claim.

The Five-Step Flowering-Window Check
This sequence does not expire when the figures above are superseded. Run it once a week from first flower to the end of the fruiting window.
- Get the night minimum first, not the daytime maximum. Every source in the dot plot puts the night ceiling between 21.1 and 22.2 °C for tomato, and cotton lost seven points of retention on a night-only three-degree rise. If nights are not clearing, no daytime intervention helps.
- Compute VPD for the 8 a.m.–noon block only. Use hourly dry-bulb temperature and relative humidity, not daily means. Feed each hour through the Tetens equation and average the result — averaging the inputs first understates the deficit because es is convex in temperature.
- Convert your target back to a humidity number. A kPa figure you cannot read off any instrument is not an operating target. At your morning temperature, work out what RH the band corresponds to, then compare it to what your station actually reports.
- Decide which side you are on before you act. Below the band the levers are canopy opening, wider rows, longer irrigation intervals and fungicide timing. Above it the levers are shade, mulch, and irrigation that finishes before pollen shed. Applying a low-VPD remedy to a high-VPD problem is the most common outdoor mistake.
- Check the temperature override. If day maxima exceed the crop's abort threshold — 32.2 °C for tomato per University of Maryland Extension — VPD management is palliative. Record the dates, because the flowers set in that window will be the ones missing at harvest, and a flower unpollinated within 50 hours is gone.



How to Get Numbers Fresher Than These
Every figure above has a source that updates on its own schedule. Three free routes give you your own numbers rather than someone else's average:
- Hourly station observations. NOAA NCEI's Local Climatological Data product carries hourly dry-bulb temperature and relative humidity from ASOS and AWOS stations, downloadable as bulk CSV in metric units. Note that LCD version 1 was retired on 29 August 2025, so use LCDv2 and expect station-by-station gaps.
- Gridded VPD, already computed. The gridMET dataset catalogued by USGS supplies daily 4 km mean vapour pressure deficit for the contiguous US from 1979 to present, updated daily. The Climatology Lab distribution notes the VPD layer was added in January 2018, ships as NetCDF4 under a CC0 dedication, and is reachable via THREDDS/OPeNDAP or wget script. Useful for reconstructing what your field's flowering windows have actually looked like over the last decade before you plant next season.
- Your own canopy. A shielded temperature/humidity logger at flower height inside the row, plus an infrared thermometer for leaf temperature, will disagree with the nearest airport by more than the width of the target band. That disagreement is the whole point — the airport is mown grass at two metres, and your flowers are not.
- Jump to the calculator

Monitoring Flowering-Stage Microclimate with Farmonaut
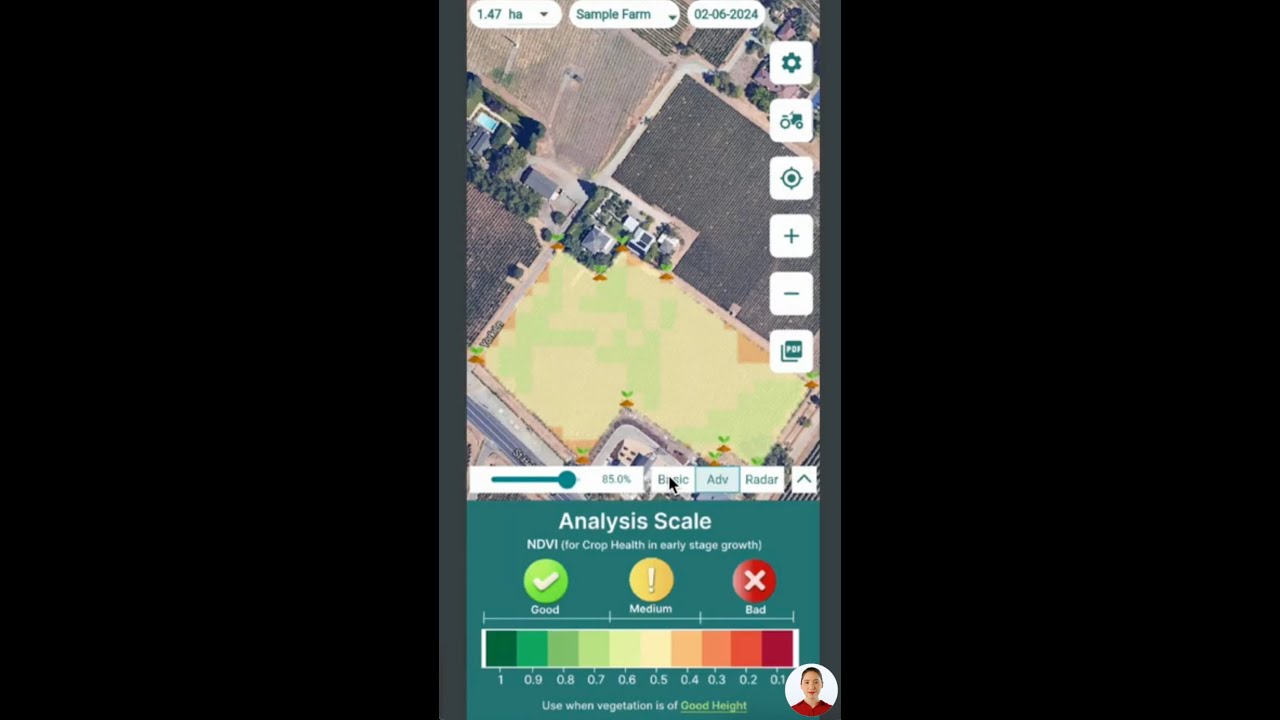
Farmonaut supplies satellite-derived field monitoring for growers who need block-level rather than county-level conditions during short reproductive windows.
- Field-level weather and crop health: multispectral imagery plus weather layers for the specific polygon you draw, so morning conditions are attributed to your bloom rather than the regional average.
- Jeevn AI advisory: irrigation and intervention timing tied to observed field conditions during the fruiting window. Explore JEEVN AI to see how advisories are structured.
- Developer access: the Farmonaut Satellite Data API and its weather API developer documentation let you pull temperature and humidity series into your own VPD pipeline instead of reading them off a dashboard.
- Fleet management for scheduling irrigation rigs and shade deployment inside a three-week window, and product traceability where buyers want provenance on quality-graded fruit.
- Large-scale farm management for operations tracking bloom timing across many blocks at once.

FAQ
What is the best VPD for flower outdoors?
Air-referenced 0.9–1.8 kPa during pollen-shed hours, which is the 40–70% RH window University of Missouri Extension gives for pollen transfer, evaluated at 24 °C. Recompute it for your actual morning temperature using the table or calculator above — at 18 °C the same window is 0.62–1.24 kPa.
Is the ideal VPD for flower different from the veg-stage target?
Indoor guides raise the target moving from vegetative growth into flower, and the physical reason is real: anther dehiscence needs drying, as the strawberry work at 2.06 versus 0.33 kPa shows. Outdoors the useful distinction is not stage but hour — flowering adds a hard morning constraint that vegetative growth does not have.
What VPD during flower is too high?
Above the RH-equivalent ceiling for your temperature. At 24 °C that is 1.79 kPa; at 30 °C it is 2.55 kPa. But past about 30 °C the temperature threshold binds first — cotton retained 45% of bolls at 36/24 °C and 21% at 36/28 °C, and no humidity change alters that.
Why do leaf-referenced and air-referenced VPD in flower differ?
VPD is saturation vapour pressure at the evaporating surface minus actual vapour pressure of the air. A transpiring leaf sits below air temperature, so its saturation pressure is lower and the calculated deficit is smaller. Both are in the calculator; state which one you mean whenever you quote a number, because charts built for sealed rooms usually mean leaf.
What is the best temperature for the flowering stage in Celsius?
It splits by crop by about ten degrees. Cotton's optimum chamber regime was 33 °C day / 21 °C night at 93% boll retention. Tomato's ceilings are 29.4 °C day and 21.1 °C night with a 12.8 °C night floor per University of Missouri, and University of Maryland Extension puts abort at 32.2 °C day or 22.2 °C night. Night limits are the tight ones.
How long is the cotton flowering stage?
About three to four weeks of effective fruiting, from first bloom at 8–9 nodes above white flower to cutout at NAWF = 5 (Texas A&M AgriLife), with a new first-position bloom every three days. Water demand peaks in weeks three and four of bloom, per NC State Extension.

Bottom Line
The best VPD for flowering is a function, not a constant: 0.9–1.8 kPa at 24 °C, sliding to 0.62–1.24 kPa at 18 °C and 1.51–3.02 kPa at 33 °C, because saturation vapour pressure roughly doubles every 11 °C and outdoors you do not control it. Measure the 8 a.m.–noon block, convert your target into the humidity number your instrument actually reads, and check the temperature override before spending money on shade or misting — because at 36/28 °C cotton kept 21% of its bolls, and no deficit adjustment fixes that.

 Magrifly
 LatConnect 60
 Disease Free Life
 WebsEdge
 Blickwinkel
 Agricultural Credit Policy Council
 BayWa
BayWa MCSOD
MCSOD Marei Nursery
 eKGIS
eKGIS Mostas Tech
 Native Seeds
 Andex
Andex FCF India
 Unifrutti Gulf
 Deluxe Conseil
 WICO
WICO Chimera Innovation
