

Diamonds · Mine-by-mine guide
De Beers Mines: Output, Costs and Owners by Country
De Beers mines diamonds in Botswana, Namibia, South Africa and Canada. Its first-half 2026 report lists six producing operations that recovered 14.9 million carats. This guide covers output, cost, owners and the older Calumet and Hecla and CDM stories.
Key takeaways
- De Beers recovered 14.9 million carats in the first half of 2026 from six operations in four countries; Orapa (5.28 million) and Jwaneng (5.02 million) in Botswana made up about 69% (De Beers, 23 July 2026).
- Full-year 2025 output was 21.7 million carats, down 12%; the 2026 guidance is 21 to 26 million carats, with a lower second half (De Beers, February and July 2026).
- The average realised price fell 32% to US$105 a carat in the first half of 2026; Venetia’s price (US$65) was below its unit cost (US$85) (De Beers, 30 July 2026).
- Anglo American says it is committed to divesting De Beers and is running a sale process; on 1 October 2026 Mountain Province agreed to give its 49% of Gahcho Kué to De Beers (Anglo American, Mountain Province).
- Calumet and Hecla, a Michigan copper company, produced over 4.5 billion pounds of refined copper before closing in 1968 (Michigan Technological University Archives).
In this article
- Where are De Beers mines? Four countries, six producing operations
- De Beers mines compared: output, owner and status
- How many carats do De Beers mines produce?
- Which De Beers mines make money? Price against cost per carat
- Why De Beers now sells fewer dollars per carat
- Where De Beers fits in world diamond supply
- Who owns De Beers and its mines?
- Diamond mine revenue calculator: carats, price and cost
- How De Beers Consolidated Mines was built: key dates
- Consolidated Diamond Mines and Namdeb in Namibia
- Calumet and Hecla: the Michigan copper company
- Three consolidated companies compared
- What the old mines left behind: Torch Lake and the Namib coast
- How satellite images help at mines like these
De Beers runs diamond mines in four countries: Botswana, Namibia, South Africa and Canada. In the first half of 2026 its production reports list six producing operations, and together they recovered 14.9 million carats (De Beers, 23 July 2026). Botswana alone gave about 70% of the 21.7 million carats produced in full-year 2025. This guide lists each mine, who owns it, what it produced, what it costs to run and what is changing, then looks at two older “consolidated” mining companies with a place in the same story: Calumet and Hecla in Michigan and Consolidated Diamond Mines in Namibia.
A carat is 0.2 gram, the unit rough diamonds are sold by. A kimberlite is the volcanic rock that carries diamonds up from the mantle, and a mine in kimberlite is usually an open pit that later goes underground. Alluvial and marine mines work diamonds that rivers and the sea moved away from their source. De Beers uses all three types.
Where are De Beers mines? Four countries, six producing operations
The group says its mining operations are in Botswana, Canada, Namibia and South Africa (De Beers, company history page). Its production reports split output into these operations:
- Botswana: Jwaneng and the Orapa regime (Orapa, Letlhakane and Damtshaa), run by the Debswana joint venture.
- Namibia: Namdeb land operations on the coast and Debmarine Namibia, a fleet of ships that mines the seabed. Both belong to the Namdeb group.
- South Africa: Venetia, which is moving from open pit to underground ore.
- Canada: Gahcho Kué, an open-pit mine in the Northwest Territories.
Not every named pit is producing. The production report says Letlhakane was placed on care and maintenance in March 2025 and Damtshaa has been on care and maintenance since 2021, so the Orapa regime’s output comes from Orapa itself. Our overview of active diamond mines in the world covers other producers such as those in Russia and Angola.
De Beers mines compared: output, owner and status
The table uses the half-year figures from the production report published on 23 July 2026. Production is on a 100% basis, except Gahcho Kué, which De Beers reports at its 51% attributable share.
| Operation | Country | Carats recovered, first half of 2026 | Owner and status |
|---|---|---|---|
| Orapa regime | Botswana | 5.28 million | Debswana, a 50-50 partnership between De Beers and the Government of Botswana since 1969. Letlhakane and Damtshaa on care and maintenance. |
| Jwaneng | Botswana | 5.02 million | Debswana. De Beers describes the Jwaneng pipe, found in 1972, as the world’s richest diamond mine. |
| Gahcho Kué | Canada | 2.05 million (51% basis) | Opened in 2016 as a joint venture with Mountain Province Diamonds. On 1 October 2026 the two sides signed a restructuring agreement under which De Beers is to take the 49% interest. |
| Venetia | South Africa | 1.47 million | Opened in 1992. De Beers intends to pause production for two years from the second half of 2026. |
| Debmarine Namibia | Namibia | 0.72 million | Marine mining under Namdeb, a 50-50 partnership with the Government of Namibia formed in 1994. |
| Namdeb land operations | Namibia | 0.36 million | Namdeb, the land mines on the Namibian coast. |
| Total | 14.91 million | Up 46% on the first half of 2025, mainly because Orapa was in extended maintenance a year earlier. |
Sources for the table: the second-quarter production report, the company history page (Debswana 1969, Namdeb 1994, Venetia 1992, Jwaneng 1972, Gahcho Kué 2016), the interim results of 30 July 2026 (Venetia pause) and the Mountain Province release of 1 October 2026.
How many carats do De Beers mines produce?
Production fell 12% in 2025 to 21.7 million carats, from 24.7 million in 2024. De Beers says it produced into demand rather than into stock (De Beers, 20 February 2026). Botswana fell 16% to 15.1 million carats after planned cuts at Orapa. Namibia fell 7% to 2.1 million, mostly because two mining vessels were retired. Venetia stayed flat at 2.2 million, and Canada fell 7% to 2.2 million carats because lower-grade ore was treated.
Chart
De Beers rough diamond output by country, full-year 2025
million carats recovered; 100% basis except Gahcho Kué at 51%
The 2026 guidance is 21 to 26 million carats. The first half already reached 14.9 million, but the company expects the second half to be lower because of planned plant maintenance at Orapa and Jwaneng and the Venetia pause.
Which De Beers mines make money? Price against cost per carat
A carat from one mine is not worth the same as a carat from another. Namibia’s mines, which recover mostly marine stones, sell at a high price per carat but also have the highest unit cost. Botswana’s stones sell for less per carat, but the mines are large and the unit cost is low. The next chart sets the average realised price against the unit cost for each country in the first half of 2026.
Chart
Price and unit cost per carat, first half of 2026
US$ per carat by country; unit cost excludes depreciation
Realised price here is De Beers’ average selling value per carat for each country’s output. Unit cost is production and operating cost divided by carats recovered, before depreciation. The two are not strictly comparable, because price includes some non-equity product, and De Beers says so in its results notes. They still show where margins are thin.
South Africa is the clearest case. In the first half of 2026 Venetia’s realised price was US$65 a carat against a unit cost of US$85, and its operating result was a loss of US$53 million EBITDA (De Beers, 30 July 2026). That helps explain the planned two-year pause while the underground project is rephased. Canada was close to break-even, with a US$40 price and US$37 cost, and its EBITDA was a loss of US$8 million. Botswana earned US$119 million EBITDA and Namibia US$13 million in the same six months.
Why De Beers now sells fewer dollars per carat
De Beers’ consolidated average realised price was US$142 a carat in 2025, down 7% from US$152 in 2024. In the first half of 2026 it fell 32% to US$105 a carat. The company ties this to two things: a sales mix with more lower-value goods, and a 16% fall in its average rough price index. It also names lab-grown diamonds as a pressure on lower-value natural stones (De Beers, 23 July 2026).
Chart
De Beers average realised price per carat by quarter
US$ per carat, consolidated rough diamond sales
The money side shows the same trend. Group revenue was US$3.5 billion in 2025, with an underlying EBITDA loss of US$511 million, and Anglo American booked a US$2.3 billion impairment on its carrying value of De Beers. In the second quarter of 2026, rough diamond sales were US$665 million against US$1.2 billion a year earlier.
The price per carat is an average of very different stones. A mine with a high share of small, low-quality goods will always show a low average, so use the number to follow one company’s trend and not to price a single diamond.
Where De Beers fits in world diamond supply
The US Geological Survey estimates world gem-quality natural diamond output at about 69 million carats in 2025, essentially unchanged from 2024. Russia was the leading producer with roughly 30% of world volume, and US, EU and G7 sanctions on Russian diamonds stayed in place (USGS, Mineral Commodity Summaries 2026).
Chart
World gem-quality natural diamond mine production, 2025
million carats, estimated, selected countries
The USGS Botswana figure of 13 million carats is lower than the 15.1 million carats De Beers reports for its Botswana mines, and the two use different methods: the USGS counts gem-quality stones only. Compare each source with itself, not across the two. The USGS also notes that the downturn that began in early 2023 has hit the lower end of the market hardest.
Who owns De Beers and its mines?
De Beers became a member of the Anglo American group in 2012 (De Beers history). Anglo American has said it is committed to divesting De Beers, that a formal sales process is under way and that it expects to give an update during 2026 (De Beers interim results, 30 July 2026). Its quarterly production report, published a week earlier, says the company is progressing the sale process (Anglo American, 23 July 2026). Anglo American owns 85% of De Beers and the Government of Botswana owns the other 15% (Anglo American, diamonds). A Botswana government official said in July 2026 that Anglo had picked the Global Diamond Consortium, led by former De Beers chief executive Gareth Penny, as preferred bidder. Anglo has not confirmed this and says it is progressing the sale process (National Jeweler, 21 July 2026). No completed sale had been announced by 16 October 2026.
At mine level the owners differ. Debswana in Botswana and Namdeb in Namibia are each a 50-50 partnership with the host government. In Canada, Mountain Province Diamonds held 49% of Gahcho Kué until its 1 October 2026 agreement to hand that interest to De Beers, to settle its remaining reclamation payments and debts owed to De Beers. The company kept the right to regain an interest later (CBC News, 1 October 2026). CBC also reports that Gahcho Kué is now the only operating diamond mine in the Northwest Territories after Diavik and Ekati closed earlier in 2026.
Gahcho Kué’s outlook is short-term. A 2024 mine plan had the plant recovering diamonds into 2031, but CBC reports a planned closure timeline of 2028, and De Beers paused the Tuzo Phase 3 expansion in the first half of 2026 (De Beers, 30 July 2026). Consultants and investors reading this should treat the sale as unfinished. Ownership of the mines, the host-country agreements (De Beers and Botswana signed new agreements in 2025) and the Venetia pause can all change the numbers on this page.
▶ Explains what mining brings an economy: exports, jobs, revenue and energy-transition minerals. · 5:03
Diamond mine revenue calculator: carats, price and cost
The calculator below turns ore tonnes, grade, price and cost into carats, revenue and an operating margin before capital spending, tax and depreciation. The starting figures are round examples, not benchmarks. Replace the price with a current quote and the cost with your own estimate. For scale, USGS says most diamond ore bodies hold from less than 1 carat to about 6 carats per ton, and the 2024 reserve at Gahcho Kué was graded at 1.47 carats per tonne (Canadian Mining Journal, August 2024).
Calculator
What could a diamond mine earn per year?
Enter your own ore tonnage, grade, price and cost. Results update as you type.
- Carats recovered per year: 3,000,000
- Revenue per year: $300,000,000
- Operating cost per year: $180,000,000
- Margin per year after royalty, before capex and tax: $105,000,000
- Break-even price per carat: $63
Example values only, not benchmarks. Price is an input: use today’s price for your own stones. Unit cost is cost per carat recovered, before depreciation, as De Beers defines it; De Beers reported US$23 to US$256 a carat by country in the first half of 2026 (De Beers, 30 July 2026). Margin is before capital spending, tax and closure costs. All money in US$. The royalty rate is an input because it differs by country and licence; check your own terms.
How De Beers Consolidated Mines was built: key dates
De Beers traces itself to the 1871 discoveries that followed prospecting in the Vaal River area of South Africa. The De Beers mine was found in May 1871 and the Kimberley mine in July 1871, and Kimberley stayed the world’s richest mine for almost a century. The company’s own timeline gives these dates (De Beers history):
- 12 March 1888: Cecil Rhodes and Barney Barnato, who ran rival operations, join forces and De Beers Consolidated Mines Limited is established. Rhodes chairs it until 1902.
- 1902: The Premier mine near Pretoria is discovered. It later produced more large gem diamonds than any other mine.
- 1926: Sir Ernest Oppenheimer joins the board after Anglo American, the company he founded, becomes a major shareholder.
- 1947: The slogan “A diamond is forever” is created for the company’s advertising.
- 1967 to 1972: Geologists find the Orapa pipe in newly independent Botswana, the government and De Beers form Debswana in 1969, and the Jwaneng pipe is found in 1972.
- 1992 and 1994: Venetia opens in South Africa, and De Beers and Namibia form Namdeb.
- 2016: Gahcho Kué opens in Canada.
De Beers once held a dominant position in the diamond market, and that position was later eroded by diamond discoveries in the Belgian Congo and Angola (World Diamond Council, 2024).
Consolidated Diamond Mines and Namdeb in Namibia
Consolidated Diamond Mines (CDM) of South West Africa was Ernest Oppenheimer’s vehicle for the Namib coast. After founding Anglo American in 1917, he offered German diamond-field investors shares in it in exchange for their holdings, and gathered those holdings into CDM. He then offered CDM to De Beers for stock and a board seat, and the directors agreed. The World Diamond Council describes CDM as the forerunner of today’s Namdeb.
The ground was a restricted zone. The German colonial government declared a 26,000 square kilometre area, the Sperrgebiet or Forbidden Territory, soon after the first diamond was found in 1908, and much of it is still closed to the public (World Diamond Council).
Two changes made the modern business. In the 1960s geologists confirmed that diamonds washed down the Orange River had collected on the seabed, which led to marine mining by vacuuming sand from the sea floor. In 1994 the newly independent Namibian government and De Beers formed Namdeb as a 50-50 joint venture. In 2000 the marine fleet was moved to Namibia, and from 2005 Debmarine Namibia produced more than the land mines (World Diamond Council). Debmarine is still the larger of the two parts: it recovered 724,000 carats in the first half of 2026 against 363,000 from the land operations.
Calumet and Hecla: the Michigan copper company
Calumet and Hecla had nothing to do with De Beers except the word “consolidated”. It was a native-copper miner on Michigan’s Keweenaw Peninsula. The dates and figures below come from the National Park Service and Michigan Technological University.
- 1858 to 1864: Surveyor Edwin Hulbert found an ancient copper cache that led him to the Calumet conglomerate lode, and by 1864 he had financed the Calumet Mining Company and the Hecla Mining Company (National Park Service).
- 1867 to 1871: Alexander Agassiz replaced Hulbert and ran the company until his death in 1910. The two firms merged in 1871 to form the Calumet and Hecla Mining Company. In one year after the merger it produced 16.2 million pounds of copper and paid US$2.4 million to shareholders.
- From 1905: After Michigan changed its law, C&H began buying stock in neighbouring copper companies and later absorbed them (Michigan Technological University Archives).
- Output: Over nearly a century the company produced more than 4.5 billion pounds of refined copper and paid more than US$200 million in dividends (Michigan Tech). The park service says that at its height it supplied about half of the country’s copper (National Park Service, Keweenaw).
- 1968: C&H closed. The company had earned small profits since the Korean War and kept some operations open while looking for another large lode (National Park Service).
The Keweenaw Peninsula supplied 96% of US copper by 1849 and was the largest US producing region from 1845 to 1887. By 1887 Montana mines such as the Anaconda were beating Michigan’s output (National Park Service). Michigan still appears among the states where the USGS records copper mining, though the Keweenaw native-copper mines are long closed. Our guide to where copper is found in the United States maps those districts.
Company towns and labor relations at C&H
Agassiz provided a public library, a public school, a bathhouse and medical care for employees, and by 1898 the company owned nearly 1,000 dwellings. These welfare steps sat alongside serious danger and conflict. Thirty men and boys died in the 1895 Osceola mine fire, the deadliest single accident in Keweenaw mining history. In July 1913 workers struck, partly over a one-man drill that would shrink the workforce, and the strike ended in April 1914 with workers returning on the companies’ terms (National Park Service timelines). A Christmas Eve crowd crush at Italian Hall in Calumet killed 74 people, 60 of them children, during that strike.
▶ Follows copper from a giant pit to refined cathode and explains why the metal matters. · 6:03
Three consolidated companies compared
| Company | How it began | Place and product | What happened later |
|---|---|---|---|
| Calumet and Hecla | Two firms formed by 1864 merged in 1871 | Keweenaw Peninsula, Michigan; native copper | Produced over 4.5 billion pounds of refined copper; closed in 1968 |
| De Beers Consolidated Mines | Rhodes and Barnato joined their rival operations on 12 March 1888 | Kimberley, South Africa, now mines in four countries; diamonds | Part of Anglo American since 2012; Anglo American is running a sale process |
| Consolidated Diamond Mines | Formed by Oppenheimer from German diamond holdings and offered to De Beers | Sperrgebiet, South West Africa, now Namibia; alluvial and marine diamonds | Succeeded by Namdeb, a 50-50 venture with the Namibian government since 1994 |
What the old mines left behind: Torch Lake and the Namib coast
The record at the Michigan site is mixed. Mills and smelters along Torch Lake dumped stamp sands, the crushed rock left after copper was removed, into the lake for nearly 100 years. About 200 million tons were deposited, displacing around 20% of the lake’s original volume. The Environmental Protection Agency put the Torch Lake and Quincy smelter sites on the National Priorities List in 1986, and cleanup ran from 1998 to 2004 (National Park Service). The EPA still lists Torch Lake as a Superfund site and has issued an update to its cleanup plan (EPA, Torch Lake site profile).
On the diamond side, the cost of closure shows up in the accounts. Gahcho Kué’s partners owe decommissioning and reclamation payments, and those were part of what the 2026 restructuring settled. Mine closure is a cost that arrives at the end of the mine’s life, and it is a good reason to read the closure terms in any mining deal.

▶ Walks through the seven environmental impacts of mining in plain words. · 2:31
How satellite images help at mines like these
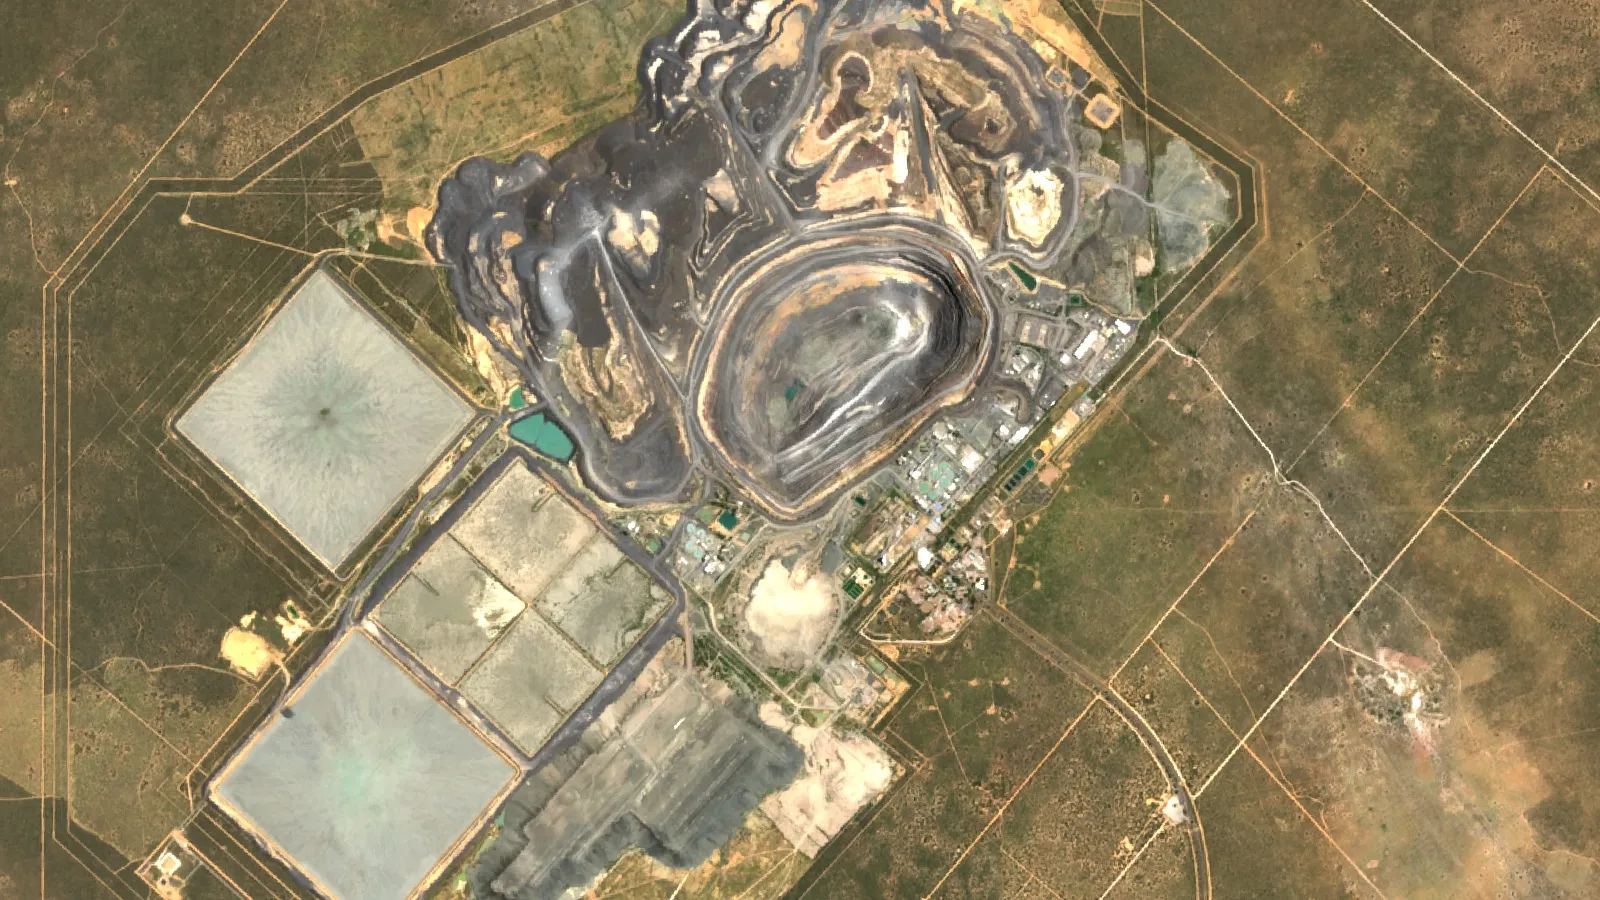
Satellite images are used in two ways around mines. Before a mine exists, they help screen a licence area for alteration, faults and other signs that point to where field crews should look first. After it opens, they show how the pit, waste dumps, tailings and water bodies change from year to year. Sentinel-2 images, as in the picture at the top of this page, have 10 metre pixels, which is enough to show a pit and waste dumps the size of Jwaneng’s.
Farmonaut is a US-based company that screens an area of interest, supplied as a KML, KMZ or polygon, from satellite images and returns a report with high-potential zones. Diamonds are among the materials on its detection list. The results are exploration targets that sit ahead of a resource estimate, and they do not replace drilling or a clearance from the land owner or regulator. Our satellite-based mineral detection page explains the method.
If this topic matters to you, read Las Bambas Copper Mine: Output, Owners and Costs next.
Related reading on this site: Silver Miners in Canada: Mines, Owners and Output.
Frequently asked questions
How many mines does De Beers have?
De Beers mines in four countries. Its first-half 2026 production report lists six producing operations: Jwaneng, the Orapa regime, Debmarine Namibia, Namdeb land operations, Venetia and Gahcho Kué. Letlhakane and Damtshaa, part of the Orapa regime, are on care and maintenance.
What is De Beers’ biggest diamond mine?
By carats recovered in the first half of 2026, the Orapa regime in Botswana led with 5.28 million carats, just ahead of Jwaneng at 5.02 million. De Beers calls Jwaneng the world’s richest diamond mine in its company history.
Who owns De Beers?
Anglo American owns 85% of De Beers and the Government of Botswana owns 15%. Anglo has said it is committed to divesting De Beers and is running a formal sale process. Anglo American expected to give an update during 2026. At the mine level, Debswana and Namdeb are 50-50 partnerships with the governments of Botswana and Namibia.
Is De Beers for sale?
Anglo American says it is committed to divesting De Beers and that a formal sales process is under way. A preferred bidder was reported in July 2026, but no completed sale had been announced by 16 October 2026.
Who owns Gahcho Kué?
De Beers Canada operated the mine with a 51% interest and Mountain Province Diamonds held 49%. On 1 October 2026 Mountain Province agreed to give its interest to De Beers, keeping an option to regain a stake later.
Why is De Beers pausing Venetia?
De Beers said in July 2026 that it intends to pause production at Venetia for two years while it rephases the underground project’s spending and reworks its global operating model. In the first half of 2026 Venetia’s realised price of US$65 a carat was below its unit cost of US$85.
How much are De Beers rough diamonds worth per carat?
De Beers’ average realised price was US$142 a carat in 2025 and US$105 in the first half of 2026. It is an average over many sizes and qualities and says little about any single stone.
What is De Beers Consolidated Mines?
It is the company set up on 12 March 1888 when Cecil Rhodes and Barney Barnato merged their competing diamond operations in Kimberley, South Africa. Today’s De Beers Group traces its history to that date.
What was Consolidated Diamond Mines (CDM)?
CDM was the company Ernest Oppenheimer built from German diamond-field holdings in what is now Namibia. It was later offered to De Beers, and Namdeb, formed in 1994, is its successor.
How much copper did Calumet and Hecla produce?
Michigan Technological University’s archive says the company produced more than 4.5 billion pounds of refined copper over nearly a century. The whole Keweenaw Peninsula produced an estimated 10.5 billion pounds between the mid-1840s and 1968, according to the National Park Service.
Is Calumet and Hecla still mining?
No. The company closed its mines in 1968. The Calumet and Quincy units of Keweenaw National Historical Park now preserve the historic mining district.
This page is for information only. It is not investment advice. Company figures are from the dated reports named above and can change; Anglo American’s sale of De Beers and the Gahcho Kué restructuring were not complete when this page was updated. Reserve and mine-life figures are company estimates and can be revised.
Farmonaut mining
Map your mining site from space
Send a KML, KMZ or polygon and Farmonaut screens the area from satellite images before field crews go in.

Mining Pro sample view, synthetic data
Keep reading
Sources
- De Beers Group, Production Report for the Second Quarter of 2026 (23 July 2026): debeersgroup.com
- De Beers Group, Preliminary financial results for 2025 (20 February 2026): debeersgroup.com
- De Beers Group, Interim financial results for 2026 (30 July 2026): debeersgroup.com
- De Beers Group, Our history and heritage since 1888: debeersgroup.com
- Anglo American, Q2 2026 Production Report (23 July 2026): angloamerican.com
- USGS, Mineral Commodity Summaries 2026: Gemstones (February 2026): pubs.usgs.gov
- Mountain Province Diamonds, Restructuring agreement (1 October 2026): mountainprovince.com
- CBC News, Mountain Province Diamonds announces exit from Gahcho Kué (1 October 2026): cbc.ca
- Canadian Mining Journal via Mining.com, Gahcho Kué mine life extended to 2031 (22 August 2024): mining.com
- World Diamond Council, From the Sand and from the Sea: The Namibia Case Study (4 July 2024): worlddiamondcouncil.org
- National Park Service, Timeline of Michigan Copper Mining 1851 to 1900: nps.gov
- National Park Service, Timeline of Michigan Copper Mining 1951 to Present: nps.gov
- National Park Service, Keweenaw National Historical Park: nps.gov
- Michigan Technological University Archives, Calumet and Hecla Mining Companies Collection MS-002: mtu.edu
- US EPA, Torch Lake Superfund site profile: epa.gov
- Anglo American, Diamonds overview (De Beers ownership): angloamerican.com
- National Jeweler, Anglo reportedly selects Gareth Penny’s consortium as top bidder for De Beers: nationaljeweler.com
Discussion
Questions, corrections or field experience? Share them below. First-time comments are reviewed before they appear, and your email is never published.
No comments yet. Be the first to add a question or your experience.

 Rains of Favour
 Tintina Mining Group
 Dalgety Minerals Pty Ltd
 Vortex Minerals Pty Ltd
 Faith At Work (Pty) Ltd
 Geotech Mining Solutions plc
 Vulcan International Limited
 Kidepo Associates
 GKY Mining
 Alkimy SARL
 Double A Trading
 GemSprout Metals Limited
 Qader Group
 Ileys General Trading
 SG Gold Mining LLC
 VRV Global Pte Ltd
 Omsri International FZE
 G.I.T.T.
 Jaunita Erss Ltd
 Almosi SARL
 SRK Consulting
 Berks Gold Limited
 Mwerezi Minerals Company Limited

 Exploration consultancy · South Africa · Gold










