

Reviewed August 2026 against USDA’s Economic Research Service, the Council on Dairy Cattle Breeding’s genomic-selection data published via Frontiers in Genetics, and Precedence Research’s agrigenomics market sizing.
Try it: Genomic Selection Herd Value Gap Calculator →
Agrigenomics Genotyping Solution Market, Sized for US Farms
The agrigenomics genotyping solution market — the tools and services that read genetic markers in crop and livestock DNA to guide breeding and management decisions — was sized at roughly $4.82 billion globally and $1.56 billion in the United States in 2025, according to Precedence Research. On the ground, adoption looks less like a genomics story and more like a precision-agronomic-technology story: USDA survey data show automated guidance already used on 70% of large-scale U.S. crop farms, while genomic selection has become the default breeding method in U.S. dairy cattle. This piece lays out the actual numbers, where genotyping fits inside the broader agronomic technology stack, and a checklist for evaluating a vendor claim that won’t go stale when the market-size figures do.
Contents
- What Is Agrigenomics?
- Agrigenomics Genotyping Solution Market Size: Global and U.S. Figures
- Where Genotyping Fits in the Agronomic Technology Stack
- Genotyping Technologies: NGS, SNP Arrays, and Marker-Assisted Selection
- Genomic Selection in Practice: The U.S. Dairy Cattle Case
- Crops, Livestock, and Forestry: Where Genotyping Gets Used
- Precision Data Management and Digital Farming
- Farmonaut Satellite Solutions: Pairing Genotypes With Field Data
- How to Evaluate a Genotyping or Agrigenomics Vendor
- Frequently Asked Questions
- Summary



What Is Agrigenomics?
Agrigenomics applies genomic tools — sequencing, genotyping arrays, and the bioinformatics that interpret them — to plant and animal breeding. A genotyping solution is the specific product or service layer that reads DNA markers from a tissue, blood, or hair sample and returns a genetic profile a breeder can act on: which calf will produce more milk, which wheat line carries a resistance gene, which seedling should go into a multiplication block. It sits one step upstream of “precision agriculture” in the usual sense — precision ag optimizes what happens to a plant or animal in the field; agrigenomics decides which plant or animal is worth putting in the field in the first place.
The distinction matters for search intent: someone typing “agrigenomics” or “agrigenomics market” is almost always researching the industry and its vendors, not looking for a definition of precision farming. The sections below separate the two, then show where they connect.

Agrigenomics Genotyping Solution Market Size: Global and U.S. Figures
Market-research firms don’t agree on a single number for the agrigenomics genotyping solution market — they scope the category differently (some include only genotyping services, others fold in sequencing instruments and bioinformatics software). Treat any published total as directional, and check the source page for whatever is current when you read this. The most recently updated figures we could verify come from Precedence Research’s agrigenomics market page, accessed August 2026:
| Metric | Global | United States |
|---|---|---|
| Market size, 2025 | $4.82 billion | $1.56 billion |
| Projected market size, 2035 | $11.72 billion | $3.79 billion |
| Projected CAGR, 2026–2035 | 9.29% | 9.28% |
| Share of global market, 2025 | — | North America: 43% |
North America’s 43% share puts it ahead of every other region in 2025 by that count, with Asia-Pacific flagged by the same source as the fastest-growing region over the forecast window — worth watching if you’re comparing where R&D investment is heading versus where deployed revenue currently sits.
Why estimates of the genotyping solution market differ so much
Two reports that use nearly the same name can land far apart. Precedence Research sizes the agrigenomics market at $4.82 billion for 2025 (Precedence Research). Market Research Future, in a report titled “Agrigenomics Genotyping Solution Market”, puts 2025 at $28.62 billion and 2035 at $65.69 billion, a compound annual rate of 8.66% (Market Research Future). Both pages were accessed in September 2026.
The gap is mostly scope. The larger estimate includes segments such as disease diagnostics and RNA genotyping, and lists biotechnology companies as the biggest end-user group, so it captures spending well outside farm breeding. The smaller figure is limited to agricultural genomics and splits the market by crop and livestock use, with crops at 65% of 2025 revenue.
The vendor lists overlap more than the totals do. Both reports name Thermo Fisher Scientific, Illumina, Agilent Technologies, Eurofins Scientific and LGC among the main suppliers. Market Research Future adds Neogen and QIAGEN; Precedence adds BGI and Tecan Genomics.
If you need one number for a business case, quote it with the firm’s name, the year and what it covers. If you are comparing growth, compare rates from the same report rather than mixing sources.
Where Genotyping Fits in the Agronomic Technology Stack
“Agronomic technology” is a broader term than agrigenomics, and it’s worth being precise about the layering. A typical U.S. row-crop operation now stacks several technology layers on top of each other: genetics and genotyping decide which hybrid or variety goes in the ground; automated guidance and variable-rate equipment decide how it’s planted and treated; remote sensing and weather data decide how it’s managed in-season; and farm-management software ties the records together for compliance, insurance, or lender reporting. Genotyping data is most valuable when it’s read alongside the other three layers rather than in isolation — a marker for drought tolerance means more once you can see, field by field, which zones actually experienced water stress.
USDA’s Economic Research Service tracks adoption of the equipment and data layers directly. In its 2023 Agricultural Resource Management Survey data, published as the report “Precision Agriculture in the Digital Era: Recent Adoption on U.S. Farms” (McFadden, Njuki, and Griffin, USDA ERS, February 2023) and updated in a related USDA ERS chart of note (published December 10, 2024):
- Automated guidance/autosteer systems were used on 52% of midsize crop farms and 70% of large-scale crop farms in 2023, up from single-digit adoption in the early 2000s.
- Yield monitors, yield maps, and soil maps together were used on 68% of large-scale crop-producing farms.
- For winter wheat, cotton, sorghum, and rice specifically, yield maps, soil maps, and variable-rate technology remain on only 5–25% of total planted acreage — adoption is far from uniform across crops.
These are ERS’s own survey figures, not agrigenomics-market projections — ARMS is refielded periodically, so check the ERS pages above directly for whatever the newest release covers before quoting a number publicly.

Genotyping Technologies: NGS, SNP Arrays, and Marker-Assisted Selection
Vendors in this space are usually selling one of three service types, often bundled:
- Next-generation sequencing (NGS): reads long stretches of DNA and can detect markers no one has looked for before — the tool of choice for building a new reference panel or discovering a novel trait association.
- SNP arrays: a fixed, cheaper panel that checks a known list of single-nucleotide markers. This is what most routine breeding-program genotyping runs on once the useful markers have already been identified by NGS or prior research.
- Marker-assisted and genomic selection: not a lab technique but a breeding method — using either type of genotyping result to choose which individuals become parents of the next generation, without waiting to observe the trait directly in the field or the milking parlor.
Bioinformatics is the layer that turns raw marker calls into a usable breeding-value estimate, and it’s where most of the recent competitive differentiation sits — cloud processing has made it feasible to run genomic evaluations on millions of records rather than thousands. Whether that translates into a better outcome for your operation than a decade-old SNP panel depends entirely on the size and quality of the reference population behind it, which is why the vendor checklist later in this article leads with exactly that question.

Genomic Selection in Practice: The U.S. Dairy Cattle Case
Dairy cattle breeding is the clearest, most measured example of genotyping paying off inside U.S. agriculture, and it’s the reason the term “agrigenomics” extends well beyond crops. The Council on Dairy Cattle Breeding (CDCB) runs the national genomic evaluation for U.S. dairy cattle, and a peer-reviewed review of that program in Frontiers in Genetics (published September 9, 2022) lays out the scale and the result:
- The CDCB genotype database reached 6.6 million genotypes in August 2022, with 1,134,593 submitted in 2021 alone, per Wiggans and Carrillo, Frontiers in Genetics.
- Current national evaluations score more than 50 traits, spanning production, feed efficiency, health, and longevity — not just milk yield.
- Genomic selection became the official U.S. dairy evaluation method in 2009. The review reports an annual Net Merit trend of $85 for Holstein bulls entering AI service since 2011, against $40 for 2005 through 2009 — roughly double the rate of genetic gain, driven mainly by a shorter generation interval, since young bulls no longer have to wait for daughters to calve and be milked before their genetic value is known.
That $85-versus-$40 gap is a national average across the whole evaluated population, not a guarantee for any individual herd — CDCB re-runs these evaluations continually as more genotypes and phenotypes come in, so treat it as an order of magnitude rather than a fixed constant.
Because the arithmetic behind that gap is straightforward — a per-cow, per-year dollar rate multiplied across a herd and a time horizon — it’s a reasonable one to let a reader run for their own herd size rather than quoting a single national figure at them.
Genomic Selection Herd Value Gap Calculator
Assumptions: linear accumulation of the per-cow, per-year Net Merit gain rate across the whole herd and time period entered; default $85/$40 figures are the CDCB national averages cited above via Frontiers in Genetics (2022). Excludes genotyping and lab costs, culling and replacement effects, and any herd-specific reference-population accuracy — use it to compare scenarios, not as a guaranteed dollar return.

Crops, Livestock, and Forestry: Where Genotyping Gets Used
Crops
Crop breeding is the largest application area inside the agrigenomics genotyping solution market. Genotyping accelerates the identification of promising lines — drought tolerance in Midwest corn, disease-resistance genes in Pacific Northwest and Great Plains wheat, and quality traits in California specialty crops are all active public and private breeding targets that lean on marker data rather than waiting for a full multi-year field trial to confirm a trait. As breeders move improved varieties into commercial seed, some supply chains now track that lineage with blockchain-based traceability tools — see Farmonaut’s product traceability solution for how that chain-of-custody record gets built from breeding through to the retail shelf.
Livestock
Beyond dairy cattle, the same genomic-evaluation infrastructure is being adapted for other livestock traits — feed efficiency, disease resistance, and carcass quality among them — following the same logic covered in the dairy case above: genotype earlier, select earlier, shorten the generation interval.
Forestry
Tree improvement programs use genotyping to select for faster growth, pest resistance, and climate resilience in planting stock, with knock-on effects for carbon sequestration and timber yield per acre. Programs that need to document and report those carbon outcomes can track them with Farmonaut’s carbon footprinting platform, which turns stand-level monitoring into the kind of record a buyer or regulator can audit.
Precision Data Management and Digital Farming
Genomic and genotyping data earns its keep only when it’s connected to the rest of a farm’s operating data — weather, field logistics, machinery deployment, and financing. A few of the connective layers that make that possible:
- Fleet and machinery logistics: Farmonaut’s fleet management solution coordinates equipment deployment so that a variety selected for a specific trait actually gets planted, sprayed, or harvested on the schedule that trait requires.
- Sustainability tracking: water, fertilizer, and emissions monitoring through tools such as carbon footprinting platforms, increasingly a requirement for buyers and lenders as much as for internal management.
- Large-scale farm and plantation oversight: for bigger holdings, Farmonaut’s large-scale farm management platform gives remote monitoring and diagnostics across many fields or blocks at once.
- Financing and insurance: satellite-verified field data can speed up loan and insurance decisions through Farmonaut’s crop loan and insurance API.
Farmonaut Satellite Solutions: Pairing Genotypes With Field Data
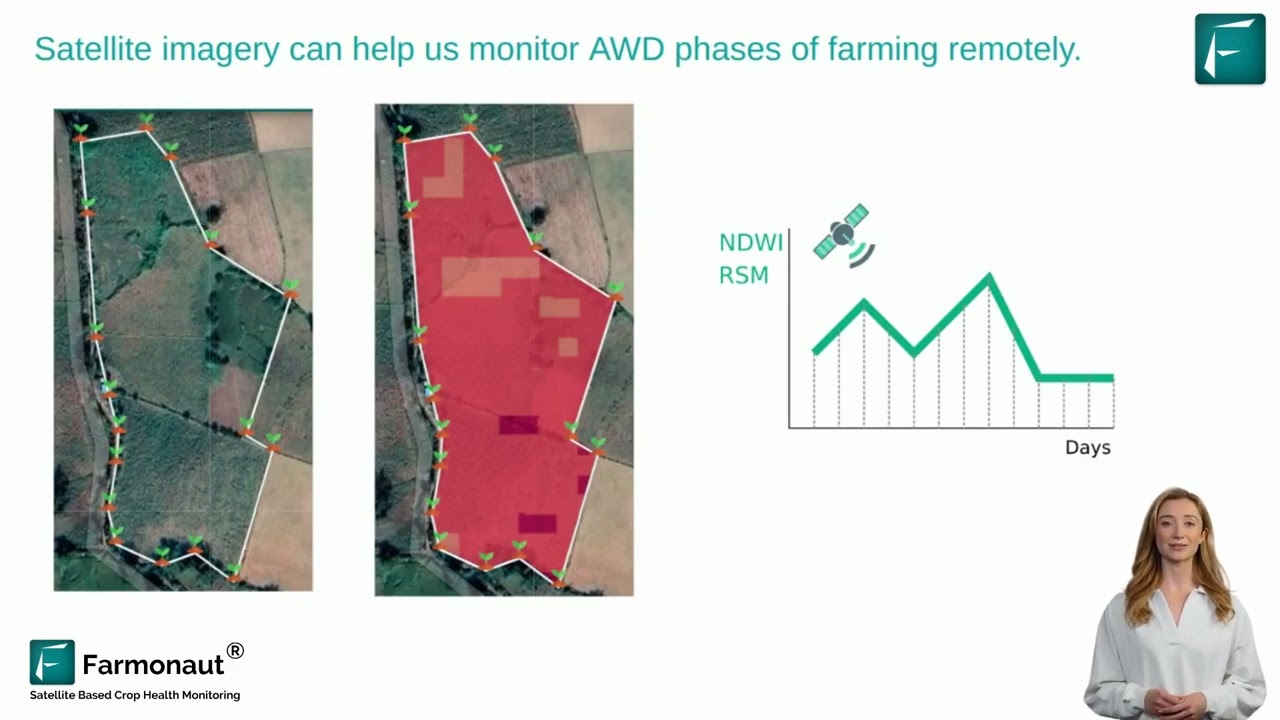
Farmonaut’s role in this stack sits above genotyping, not inside it: we don’t run genomic evaluations, but the multispectral satellite imagery, NDVI-based crop health tracking, and AI-driven advisory (our JEEVN AI system) we provide are exactly the field-level data a genotype needs to prove itself against. A drought-tolerance marker is a hypothesis until you can see, zone by zone, which parts of a field actually went under water stress this season and how the marked variety responded there compared with a conventional check.
- Satellite-based monitoring: continuous crop health, vegetative vigor, soil condition, and water status data that can be layered against genotype records.
- AI-driven agronomic advisory: our JEEVN AI system combines environmental and field data to generate management recommendations.
- Blockchain traceability: supply-chain transparency from seed selection through to harvested produce.
- Fleet and resource management: aligning equipment logistics with field-level insight.

These tools are available on web, Android, and iOS, or through our satellite and weather API — see the developer documentation if you’re building genotype-by-environment analysis into your own system rather than using ours directly.

How to Evaluate a Genotyping or Agrigenomics Vendor
Market-size figures and adoption percentages will keep moving. What doesn’t move is the set of questions that separate a genotyping solution with real predictive value from one that’s mostly marketing. Before signing a contract or a research agreement, get direct answers to each of these:
- What’s the reference population size, and how is it updated? A genomic prediction is only as good as the population it was trained against — CDCB’s dairy evaluation, for instance, drew on 6.6 million genotypes as of the 2022 review cited above. A vendor with a reference population of a few thousand animals or plants is selling something structurally different, even if the marketing language sounds identical.
- What accuracy or reliability figure do they publish, and for which trait? Accuracy varies by trait — don’t accept a single blanket number covering every trait in the panel.
- Is there independent, third-party validation? A land-grant university field trial or a peer-reviewed publication carries more weight than an internal white paper.
- Who owns the genomic data once it’s generated, and can you take it elsewhere? Get this in writing before sampling, not after.
- Does the solution connect to your existing field, weather, or farm-management data — or does it operate as an island? A genotype without a way to check it against field performance is a lab result, not a farming decision.
- What’s the total cost, including sample logistics — not just the per-sample lab fee? Shipping, chain-of-custody, and turnaround time often outweigh the genotyping fee itself for smaller operations.
Re-run this checklist against any vendor claim, current or future — it’s the part of this article that should still be useful long after the market-size numbers above have been revised.
Frequently Asked Questions
What is agrigenomics?
Agrigenomics is the application of genomic technologies — sequencing, genotyping arrays, and bioinformatics — to identify genetic variation in plant and animal genomes, so breeders can select for traits like yield, disease resistance, or feed efficiency without waiting to observe the trait directly.
How big is the agrigenomics genotyping solution market?
Estimates vary by firm and scope. Precedence Research put the global market at $4.82 billion in 2025, projecting $11.72 billion by 2035 at a 9.29% CAGR, with the U.S. at $1.56 billion in 2025 and North America holding 43% of the global market that year. Check the source page above for any figure more recent than August 2026.
Is agrigenomics the same as agronomic technology?
No — agronomic technology is the broader category, covering equipment and data tools like automated guidance, variable-rate application, and remote sensing that manage a crop once it’s planted. Agrigenomics sits upstream of that, deciding which genetic material goes into the ground or the herd in the first place. The two connect once field or herd performance data is used to validate a genetic marker’s real-world value.
What technologies lead the genotyping market?
Next-generation sequencing (NGS) for discovery work, SNP arrays for routine low-cost genotyping once markers are known, and the marker-assisted or genomic-selection breeding methods that use either type of result. Cloud-based bioinformatics is the layer that’s changed fastest, enabling evaluations across millions of genotype records rather than thousands.
Does genomic selection actually work in a measurable way?
In U.S. dairy cattle, yes, and it’s documented: CDCB’s national evaluation moved the industry’s average annual Net Merit gain from about $40 per cow to about $85 per cow after genomic selection became official in 2009, per the Frontiers in Genetics review cited above. That’s a national average, not a per-herd guarantee — run the calculator in this article against your own herd size to see the order of magnitude for your operation.

Summary
The agrigenomics genotyping solution market is real, growing at a rate most published sources put in the high single digits to low double digits annually, and it’s largest today in North America even as Asia-Pacific is flagged as the fastest-growing region. But the number that matters more to a working farm or ranch is adoption, not market size: USDA data show automated guidance on 70% of large U.S. crop farms and genomic selection running the national dairy cattle evaluation since 2009 with a documented doubling of genetic gain. Genotyping earns its value only when it’s checked against field or herd performance — which is exactly where satellite monitoring, fleet logistics, and farm-management data (the tools linked throughout this piece) come in. Use the vendor checklist above on any claim you’re evaluating, and treat every market-size figure here as a snapshot to be re-checked against the source, not a permanent fact.

 GalaxEye Space
 Soybean Processors Association
 Sun Palm Australia
 Grandstream Algérie
 XOS Realty
 Geospatial Lab Africa
 Agro La Gándara
 HIPSAC
 ZOL Zimbabwe
 Juligerm
 AdBio
AdBio MISE Maroc
 NWNS
NWNS Red August Group
 Farm Inc
 WeMe Global
 Agrotoken
 Blue BearX
 Insignito
 DnCubed
