

Vertical Integration in Agriculture: Definition, Examples, Data
Reviewed September 2026 against USDA Economic Research Service, Eurostat, and University of Surrey/Springer Nature research.
Try it: Run your own numbers →
Vertical integration in agriculture is when a single company controls more than one stage of the food chain — for example, a poultry company that owns the hatchery, the feed mill, the grow-out contracts, and the processing plant, instead of buying birds on an open market. It is not a 2026 trend; it is the dominant structure in several major US commodities already, and it has been for years. In broiler chickens, USDA’s Economic Research Service put the vertical integration rate at roughly 90%, and in hogs at roughly 75%, per ERS’s Concentration in Agriculture report (USDA ERS).
This article covers what vertical integration in agriculture means, the difference between forward and backward integration, real examples with sourced figures from the US and EU, where the model breaks down for smaller operations, and the technology layer — satellite monitoring, traceability, contract automation — that is making partial integration accessible below the scale of a national meatpacker. Every figure below carries its source and the date it was published, plus how to pull a fresher number when you need one.
Table of Contents
- 1. What Is Vertical Integration in Agriculture?
- 2. Forward vs. Backward Integration: The Two Directions
- 3. Vertical Integration in Agriculture: Examples by Sector
- 4. Farm Consolidation in the EU: What the Data Shows
- 5. Vertical Farming vs. Vertical Integration — They’re Not the Same Thing
- 6. Calculator: Estimate Your Integration Exposure
- 7. The Technology Layer: How Smaller Operations Integrate Without Owning Everything
- 8. Farmonaut’s Satellite-AI Tools for Integrated Operations
- 9. Where Vertical Integration Breaks Down
- 10. What to Watch Next
- 11. Frequently Asked Questions
- Try it: Run your own numbers
What Is Vertical Integration in Agriculture?
Vertical integration in agriculture means one company owns or contractually controls two or more consecutive stages of production — inputs, farming, processing, distribution, or retail — instead of transacting with independent businesses at each stage through open markets. The opposite is a fragmented supply chain, where a grain farmer sells at a spot elevator price to a trader, who sells to a miller, who sells to a bakery, each stage negotiating independently.
The distinction that matters for anyone searching this term: vertical integration is a structural description of who owns what, not a synonym for “efficient” or “modern” supply chains. A company can be vertically integrated and still run badly; a fragmented market of independent family farms selling through cooperatives can still be efficient. What integration actually changes is who bears price risk, who controls quality specs, and who captures margin at each stage.
The clearest evidence of how far this has gone is in US meat and poultry. USDA ERS’s Concentration in Agriculture report found broiler chicken production is approximately 90% vertically integrated — companies like the major integrators own the birds from egg through processing, with growers operating under contract rather than owning the animals. Hog production runs at roughly 75% vertical integration by the same measure. Beef is structured differently: rather than full ownership integration, 40–50% of beef cattle move through captive supply arrangements — forward contracts, marketing agreements, or packer ownership that functions like integration without full vertical ownership (USDA ERS). These figures reflect ERS’s dataset as published; ERS updates its Concentration in Agriculture series periodically, so check the current edition at ers.usda.gov before citing these numbers in anything time-sensitive.
Forward vs. Backward Integration: The Two Directions
Every real-world example of agriculture vertical integration falls into one of two directions, and most large integrators do both simultaneously.
- ✔ Forward integration: moving toward the consumer — a farm or cooperative that acquires processing capacity, packaging, distribution, or retail. A grain grower who builds an on-farm mill and sells flour directly is integrating forward.
- ✔ Backward integration: moving toward inputs — a processor that acquires or contracts hatcheries, feed mills, seed production, or farmland itself, to secure and control its raw material supply instead of buying it on the open market.
Poultry integrators are the textbook case of both directions at once: they own the hatchery and feed mill (backward) and the processing plant, and sometimes branded retail products (forward), while growers under contract supply only the physical barns and labor. That is why the sector’s integration rate is measured near 90% rather than at a single stage.

Contract farming is not the same as vertical integration, though the two overlap heavily in US livestock. A grower under contract to a poultry integrator does not own the birds — the integrator does. That is full integration with contracted labor, distinct from a marketing contract where an independent farmer still owns the animals but has pre-agreed a sale price.
Vertical Integration in Agriculture: Examples by Sector
The table below compares integration structure across the US sectors where USDA has published concentration data, so you can see which markets are genuinely integrated versus merely concentrated among a few buyers.
| Sector | Integration Structure | Reported Rate / Concentration | What’s Owned vs. Contracted |
|---|---|---|---|
| Poultry (broilers) | Full vertical integration | ~90% integrated (USDA ERS) | Integrator owns birds, feed, processing; grower contracts the barn and labor |
| Hogs | Full vertical integration | ~75% integrated (USDA ERS) | Similar structure to poultry; contract growers common in Iowa, North Carolina |
| Beef cattle | Captive supply / partial integration | 40–50% under captive supply arrangements (USDA ERS) | Packer ownership or forward contracts rather than full ownership from calf to plate |
| Beef packing (processing stage) | Market concentration, not integration per se | Top 4 packers: 83–86%; Top 5: 88.7% (USDA ERS) | Few firms control slaughter capacity even where cattle ownership stays independent |
| Hog packing (processing stage) | Market concentration | Top 5 packers: 71.6% (USDA ERS) | Processing concentrated even where finishing contracts vary by region |
All five figures above come from the same USDA ERS Concentration in Agriculture report (USDA ERS). ERS revises its concentration figures on a periodic basis rather than a fixed annual schedule — the 4-firm beef packer ratio has held in the 83–86% band since roughly 2009 according to ERS’s own trend data, which is itself worth noting: concentration in beef processing has been stable for over a decade, not a recent shift.

Outside livestock, vertical integration shows up differently — in produce, it is often a branded grower-shipper that owns cooling, packing, and sometimes retail-ready branding rather than owning farmland outright; in grain, it is a co-op or trader that owns elevators, rail logistics, and export terminals. USDA does not publish a single blended “vertical integration rate” across all of US agriculture — the ERS data above is sector-specific because integration structures genuinely differ by commodity. If you need a rate for a sector not listed here (row crops, dairy, or produce), the method is the same one ERS uses: check USDA’s Census of Agriculture and the ERS Concentration in Agriculture series directly, since a single number pulled from elsewhere is very likely to be a guess dressed up as data.
Farm Consolidation in the EU: What the Data Shows
In the European Union, the relevant trend is not corporate vertical integration in the US meatpacking sense — EU farm structures remain far more fragmented and family-operated — but rapid consolidation into fewer, larger holdings, which is the precondition for more integration further up the chain. Eurostat’s farm structure data shows the EU-27 lost 5.6 million farms between 2005 and 2023, while average farm size grew from 11 hectares to 18 hectares over the same period (Eurostat).
As of the 2023 reference year, Eurostat counted 8.8 million farms across the EU-27 working a total utilised agricultural area of 156.2 million hectares. That combination — far fewer farms, each noticeably larger, working roughly the same total land base — is the structural setup that makes forward integration (a cooperative acquiring processing or export capacity) and backward integration (input suppliers contracting directly with fewer, larger buyers) more commercially viable than it was when the average holding was 11 hectares. Eurostat runs a full agricultural census roughly every ten years with provisional updates issued more frequently in between; the next full census is due in 2027, so check Eurostat’s “Farms and farmland in the European Union” page directly for any figure more recent than the 2023 data cited here.
Farm consolidation and vertical integration are related but distinct. Consolidation is fewer, bigger farms. Integration is one company controlling multiple stages. The EU has seen heavy consolidation without matching the US meat sector’s level of ownership integration — most EU farmland consolidation still results in independent, if larger, family or corporate farms selling into cooperative or investor-owned processing rather than being owned outright by a single integrated entity.
Vertical Farming vs. Vertical Integration — They’re Not the Same Thing
These two terms get confused constantly because they share the word “vertical,” and it is worth being precise since the underlying data is completely different. Vertical farming is a production method — growing crops in stacked layers, usually indoors, under controlled light. Vertical integration is an ownership structure across supply chain stages. A vertical farm can be vertically integrated (if it also owns its own retail distribution) or not (if it simply sells wholesale like any other grower).
A 2024–2025 University of Surrey study published in Agronomy for Sustainable Development, via Springer Nature, measured UK vertical farm lettuce output at 97 kg per square metre per year, against 3.3 kg per square metre for conventional field production of the same crop — roughly a 29-fold yield density difference (Springer Nature / Agronomy for Sustainable Development). The same study found the emissions trade-off runs the other way: UK vertical farm lettuce carried 0.93 kg CO2e per kg of product, compared with 0.57 kg CO2e per kg for field-grown lettuce in the UK — vertical farming’s controlled-environment energy use outweighs its land-efficiency gain on a per-kilogram carbon basis, at least for this crop and this study.
In the US, market research compiled around 2024–2025 counted approximately 1,950 vertical farms operating nationally, with the US vertical farming market sized at $1.58 billion for 2026 according to Zion Market Research (Zion Market Research). That count and market-size figure move with each new industry report; Zion Market Research and comparable firms reissue vertical farming market sizing on an annual cycle, so search “US vertical farming market” for whichever edition is current when you need a fresher figure than the one cited here.
Calculator: Estimate Your Integration Exposure
The figures above show how integrated an entire sector is. For a single operation, the more useful question is what share of your own value chain you actually control versus what you buy or sell on the open market at each stage. Enter your stage-by-stage ownership below.
Run your own numbers
Assumptions: this is a simple stage-count model, not a financial valuation — it does not weight stages by revenue share or risk exposure, and “control” here means ownership or binding long-term contract, not a one-off spot sale. Use it to see your structure at a glance, not as a substitute for a supply chain audit.
The Technology Layer: How Smaller Operations Integrate Without Owning Everything
Full ownership integration like the US poultry model requires capital most farms and even most mid-size agribusinesses don’t have. The more accessible path is contractual and digital integration — using shared data, traceability records, and satellite verification to get some of the control benefits of ownership (consistent quality, traceable origin, faster settlement) without buying the processing plant or the retail shelf.
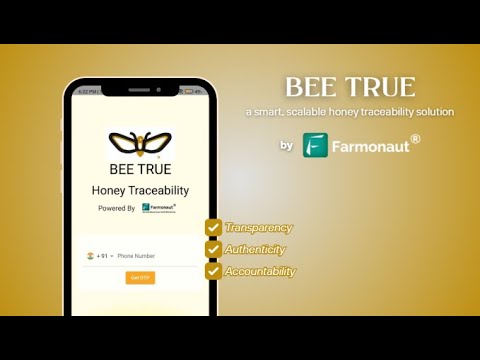
- ✔ Traceability records that follow a lot from field to buyer let a processor or retailer verify quality and origin without owning the farm — see Farmonaut’s product traceability tools.
- ✔ Contract farming with digital settlement gives growers guaranteed offtake and processors guaranteed supply, without either side owning the other’s stage.
- ✔ Satellite-verified crop condition lets a lender or insurer extend credit against a crop they don’t own and haven’t physically inspected — see Farmonaut’s crop loan and insurance tools.
- ✔ Fleet and logistics coordination replaces owning distribution infrastructure with shared visibility into where inputs and outputs are moving — see Farmonaut’s fleet management.

This matters directly for the EU consolidation data above: a cooperative representing dozens of newly-larger 18-hectare-average farms can achieve some of the coordination benefits of a vertically integrated US-style operation — consistent quality specs, pooled logistics, joint sustainability reporting — through shared digital infrastructure, without any single farm giving up ownership. That is the model behind Farmonaut’s broader look at the advantages of agriculture technology adoption for independent and cooperative operations alike.




Farmonaut’s Satellite-AI Tools for Integrated Operations
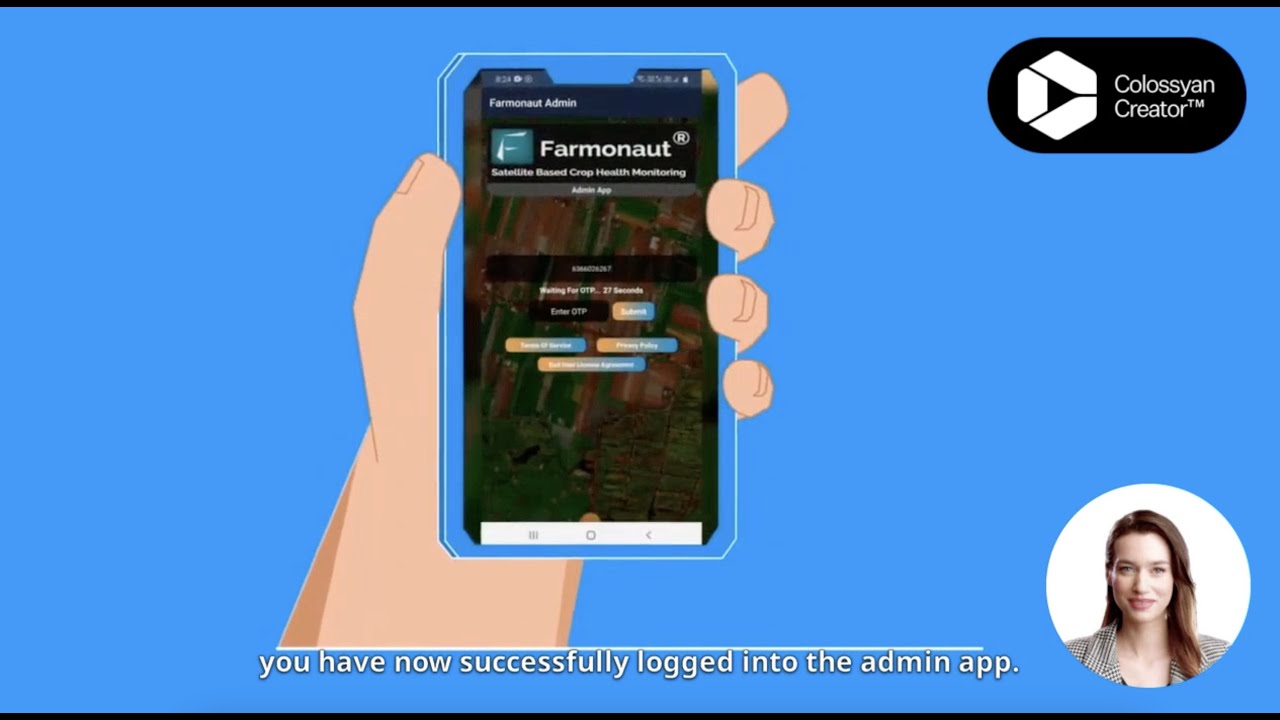
Farmonaut provides satellite-driven monitoring, AI advisory, blockchain traceability, and logistics tools that let farms, cooperatives, and agribusinesses coordinate across supply chain stages without needing to own every one of them:
- ✔ Large Scale Field Mapping for multi-farm or multi-region monitoring and planning
- ✔ AI-based crop health and input advisory via Jeevn AI for precision decisions at the production stage
- ✔ Blockchain product traceability connecting the production and buyer stages
- ✔ Fleet & resource management to coordinate logistics between input suppliers, farms, and buyers
- ✔ Carbon footprinting for compliance and sustainability reporting across the chain
These tools are accessible via web, Android (here) and iOS (here). For developers and enterprises building their own integration layer, Farmonaut’s API is available at Farmonaut API, with documentation at Farmonaut’s API developer docs.

Where Vertical Integration Breaks Down
The US poultry and hog data above shows integration works at scale, but the same structure creates specific, well-documented problems that anyone evaluating it should weigh against the efficiency gains.
- ⚠️ Grower dependency: under the ~90% poultry integration structure, growers typically own the barn and debt but not the birds, meaning their income depends entirely on a single integrator’s contract terms — a structure USDA ERS’s broader concentration research has flagged as a bargaining-power imbalance.
- ⚠️ Processing bottlenecks: the 83–86% four-firm concentration in beef packing means a single plant closure or disruption affects a large share of national slaughter capacity — this is a market concentration risk distinct from ownership integration, but it compounds where the two overlap.
- ⚠️ Capital barriers to entry: replicating a fully integrated operation from scratch requires input production, processing, and distribution capital simultaneously, which is why most new entrants pursue partial or contractual integration instead of full ownership.
- ⚠️ Loss of flexibility: a fully integrated operation locked into one crop or livestock system has less room to pivot than an independent farm selling into an open market, particularly when demand or regulation shifts quickly.
None of the sources behind this article publish a direct cost-per-unit or profit-margin comparison between integrated and independent operations in the same commodity — that comparison would need to control for scale, region, and year simultaneously, and no dataset in this brief does that. If that comparison matters for a specific decision, the closest public proxy is USDA’s Agricultural Resource Management Survey (ARMS) cost-of-production data by operation type, cross-referenced against the ERS concentration figures above.
What to Watch Next
Three threads worth tracking, each with a specific place to check rather than a prediction of where they’ll land:
- ✔️ USDA ERS concentration updates. The 90% poultry and 75% hog integration figures, and the 83–86% beef packer concentration band, come from ERS’s Concentration in Agriculture series. ERS revises this periodically — check ers.usda.gov directly for whether these rates have moved before citing them in anything beyond casual reference.
- ✔️ EU farm structure census. Eurostat’s next full agricultural census is due in 2027; provisional updates to the 8.8 million farm count and 18-hectare average size are issued in the interim. Search “Farms and farmland in the European Union” on Eurostat’s site for whichever release is current.
- ✔️ US vertical farming capacity. The 1,950-farm count and $1.58 billion 2026 market size are from one market research compilation; firms like Zion Market Research reissue sizing annually, so a fresher figure is likely available by the time you’re reading this — search “US vertical farming market” for the latest edition.
The durable way to evaluate any vertical integration claim you encounter — in this article or elsewhere — is to ask three questions: which stages does the number actually cover (ownership, contract, or just market concentration among buyers)? What year and what source is it from? And is there a periodic update series behind it, or is it a one-off estimate? The USDA ERS and Eurostat sources cited throughout this piece both pass that test; treat any figure that doesn’t name its source and vintage as unverified.
Frequently Asked Questions
Q1. What is vertical integration in agriculture?
A: It is when one company controls more than one stage of the agricultural supply chain — inputs, production, processing, distribution, or retail — rather than each stage being run by an independent business trading on the open market. US broiler poultry is the clearest example, at roughly 90% vertically integrated per USDA ERS.
Q2. What’s an example of vertical integration in agriculture?
A: A poultry company that owns its hatchery, feed mill, and processing plant, and contracts growers to raise the birds it owns, is fully vertically integrated — USDA ERS puts this structure at roughly 90% of US broiler production. Hog production follows a similar model at roughly 75%.
Q3. Is vertical integration the same as vertical farming?
A: No. Vertical farming is a production method — growing in stacked indoor layers. Vertical integration is an ownership structure across supply chain stages. A vertical farm can be vertically integrated or not, independent of its growing method.
Q4. How common is vertical integration in beef compared to poultry?
A: Far less common as full ownership. Beef runs at 40–50% captive supply (contracts and packer arrangements short of full ownership), against poultry’s roughly 90% integration rate, per USDA ERS. Beef packing is separately concentrated — the top 4 packers process 83–86% of US beef — but that is market concentration among buyers, not the same as vertical ownership integration.
Q5. Is European agriculture vertically integrated like US agriculture?
A: Not in the same ownership sense. The EU-27 has consolidated heavily — from roughly 11 hectares average farm size in 2005 to 18 hectares in 2023, losing 5.6 million farms in that period per Eurostat — but this is consolidation into larger independent and cooperative farms, not corporate ownership integration comparable to the US meat sector.
Q6. Can a small or mid-size farm achieve integration benefits without full ownership?
A: Yes, through contract farming, shared traceability systems, satellite-verified crop data for lenders and insurers, and cooperative logistics — tools that give some of the coordination and risk-reduction benefits of ownership integration without the capital requirement. Farmonaut’s traceability, crop advisory, and fleet management tools are built for this partial-integration model.
Farmonaut Subscription & Platform Access
View Farmonaut’s subscription packages for satellite-AI tools that support integrated or partially-integrated operations of any size:
Conclusion
Vertical integration in agriculture is not a forecast or a trend arriving in some future year — in US poultry and hogs it is already the structure governing roughly 90% and 75% of production respectively, per USDA ERS, and beef packing sits at 83–86% concentration among four firms. In the EU, the relevant story is consolidation rather than ownership integration: 5.6 million fewer farms and average size up from 11 to 18 hectares between 2005 and 2023, per Eurostat. Neither figure set requires updating your worldview annually — both come from agencies that revise their own data on known cycles, which is the point: check ERS’s Concentration in Agriculture series and Eurostat’s farm structure statistics directly whenever you need a number newer than the ones cited here, rather than trusting a repost of either.
For operations that can’t or don’t want full ownership integration, the practical path is contractual and digital — traceability, satellite-verified crop data, and coordinated logistics — which is where Farmonaut’s tools fit, from traceability and credit verification to fleet coordination and carbon reporting.

 Etech Consulting Madagascar
 Vestlandsforsking
 Global Launch Base
 Elders
 Agritein
 Delicio
 WB Dev
 Sama Premium
 Prochecker
 Tres Valles
 LACOS Geoinformation
 Magrifly
 LatConnect 60
 WebsEdge
 Blickwinkel
 Agricultural Credit Policy Council
 Marei Nursery
 eKGIS
eKGIS Mostas Tech
 Andex
Andex
