

Gold mines · Ranked list
Best Gold Mines: Top 10 Ranked by Ounces Produced
Carlin in Nevada made about 1.12 million ounces of gold in 2025 at 100% of the mine, the most of any mine with published figures. This page ranks the top 10 on filed ounces, with owners, pros and cons, AISC costs, a country chart and a margin calculator.
Key takeaways
- Carlin (Nevada) produced about 1,117 koz of gold in 2025 at 100% of the mine, from 687 koz at Barrick’s 61.5% share (Barrick, 2025 annual report).
- Grasberg made 937 koz in 2025 after a September mud rush, against about 1.3 Moz a year at normal rates; Olimpiada (Russia) made 926.5 koz, down 27% (Freeport, Polyus, 2026).
- Carlin’s AISC was US$1,906 per ounce, Kibali’s US$1,337 and Cortez’s US$1,513; the global average was US$1,785 in Q1 2026 (company reports; World Gold Council, 2026).
- World mine output was an estimated 3,300 tonnes in 2025; China made 380 and Russia 310, and Nevada made about 64% of US gold (USGS, 2026).
- The top 10 total 7,694 koz (about 7.7 Moz), roughly 7% of world output; the ranking uses 2025 ounces only and does not score sustainability.
In this article
- The top 10 gold mines ranked by ounces produced
- How we chose these gold mines
- Cost per ounce: which of these mines are cheap to run
- Which mines produced more or less than the year before
- Best gold mining jurisdictions: where the ounces come from
- How to judge a gold mine yourself
- Calculator: what a mine earns per year at your price
- Where satellite data helps before a mine exists
- Frequently asked questions
Among gold mines whose owners published 2025 mine-level ounces, the biggest producer is Carlin in Nevada, at about 1.12 million troy ounces (Moz) counted at 100% of the mine, using Barrick’s 2025 annual report. The Grasberg district in Indonesia is second at 937 koz even after a mud-rush shutdown that cut its output (Freeport, 2026), and Olimpiada in Russia is third at 926 koz (Polyus, 2026). The full top 10 is below, with a best-for line, pros, cons and a facts row for each.
A few terms first. A troy ounce (oz) is 31.1035 grams; koz is thousand ounces and Moz is million ounces. Grade is grams of gold per tonne of rock (g/t). AISC, all-in sustaining cost, is a company-reported cost per ounce that adds sustaining capital, royalties and overhead to the direct mining and processing cost. The page is built for consultants and licence owners who compare mines on filed numbers, so every figure is dated and traced to a filing.
The top 10 gold mines ranked by ounces produced
The table gives gold produced in calendar 2025 at 100% of each mine, in thousand ounces. Where an owner reports only its own share, we divided by its ownership share. That step is marked in the last column, so you can repeat it. Three entries are districts or complexes rather than single pits (Grasberg, Ahafo and Olimpiada); the next section states the rule.
Chart
Top 10 gold mines by 2025 output, 100% basis
Thousand ounces (koz); Carlin, Cortez, Kibali and Pueblo Viejo divided by ownership share; Paracatu in gold equivalent
| Rank | Mine | Owner | Country | 2025 gold, koz (100%) | Basis |
|---|---|---|---|---|---|
| 1 | Carlin | Nevada Gold Mines (Barrick 61.5%, Newmont 38.5%) | United States (Nevada) | 1,117 | 687 koz at 61.5% share, divided by 0.615 |
| 2 | Grasberg district | PT Freeport Indonesia (Freeport-McMoRan 48.76%, operator) | Indonesia | 937 | Freeport table, Indonesia, recoverable gold |
| 3 | Olimpiada | Polyus | Russia | 926 | 926.5 koz refined gold, as reported |
| 4 | Cortez | Nevada Gold Mines (Barrick 61.5%, Newmont 38.5%) | United States (Nevada) | 738 | 454 koz at 61.5%, divided by 0.615 |
| 5 | Ahafo | Newmont | Ghana | 734 | South 664 plus North 70, as reported |
| 6 | Detour Lake | Agnico Eagle | Canada (Ontario) | 693 | 692,675 oz, as reported |
| 7 | Kibali | Barrick 45%, AngloGold Ashanti 45%, DRC government 10% | Democratic Republic of the Congo | 673 | 303 koz at 45%, divided by 0.45 |
| 8 | Canadian Malartic | Agnico Eagle | Canada (Quebec) | 643 | 642,612 oz, as reported |
| 9 | Pueblo Viejo | Barrick 60%, Newmont 40% | Dominican Republic | 632 | 379 koz at 60%, divided by 0.6 |
| 10 | Paracatu | Kinross | Brazil | 601 | 601,318 gold-equivalent oz, as reported |
Together these ten produced roughly 7.7 Moz (7,694 koz), about 7% of the 3,300 tonnes of world mine output that the USGS estimates for 2025. The largest single mine on the list, Carlin, is about 1% of the world total. Gold supply is spread across thousands of mines, so no one site moves the market.
1. Carlin, Nevada
Best for: the largest filed output of any single gold mine in this list.
- Pros: a very large operation in Nevada, with a roaster and an autoclave that can treat refractory ore (gold locked inside sulfide minerals, which plain leaching cannot reach). Carlin also processes higher-grade ore trucked from the nearby Cortez mine.
- Cons: 2025 output fell 11% from 2024 and missed Barrick’s guidance of 705 to 785 koz at its 61.5% share. The AISC was US$1,906 per ounce, well above Cortez (US$1,513), Pueblo Viejo (US$1,412) and Kibali (US$1,337).
- Facts: Carlin sits in Nevada Gold Mines, a joint venture of Barrick (61.5%) and Newmont (38.5%). Barrick’s 2026 forecast is 600 to 670 koz at its share, lower again as open-pit sequencing changes (Barrick, 2025 annual report).
2. Grasberg district, Indonesia
Best for: the biggest swing between a normal year and a bad year.
- Pros: gold comes as a by-product of one of the world’s largest copper deposits. At normal operating rates the underground operations produce about 1.3 Moz of gold a year, according to Freeport.
- Cons: the September 2025 mud-rush incident cut production. Fourth-quarter 2025 output was 65 koz against 432 koz a year earlier, and full-year Indonesian output was 937 koz against 1,861 koz in 2024. Output is not a steady figure.
- Facts: Freeport’s consolidated 2025 gold production was 956 koz, of which 937 koz was Indonesia and 19 koz US operations; we use the Indonesian line. Freeport has a 48.76% interest in PT Freeport Indonesia and manages it. It plans a phased restart of the Grasberg Block Cave underground mine from the second quarter of 2026, and expects most 2026 sales in the second half (Freeport, January 2026).
3. Olimpiada, Russia
Best for: seeing a planned dip: one of the largest producers is deliberately mining less.
- Pros: 926.5 koz of refined gold in 2025, about 37% of Polyus’s group total of 2,528.8 koz. The company is spending on stripping (removing waste rock) at the fifth stage of the Vostochny pit to open the next ore.
- Cons: output fell 27% from 1,265.7 koz in 2024, a planned reduction while operations moved to the next pit stages. The same release reports a 16% fall in group output.
- Facts: the owner is Polyus, and the group met its guidance of 2.5 to 2.6 Moz (Polyus, operating results for 2025).
4. Cortez, Nevada
Best for: grade. Underground ore here is far richer than at most mines on this list.
- Pros: underground ore averaged 7.83 g/t in 2025, and the AISC of US$1,513 per ounce is lower than Carlin’s. Its refractory ore feeds the Carlin roasters.
- Cons: open-pit ore was only 0.95 g/t, and the open pit moves a lot of waste rock (46.7 million tonnes in 2025 against 7.4 million tonnes of ore). Barrick forecasts 430 to 480 koz at its share for 2026, close to the 2025 level.
- Facts: Nevada Gold Mines, 61.5% Barrick, 38.5% Newmont.
5. Ahafo, Ghana
Best for: a large African mine where a second source of ore has just started.
- Pros: Newmont reports Ahafo South at 664 koz and Ahafo North at 70 koz for 2025. Ahafo North reached commercial production in the fourth quarter of 2025 and had an AISC of US$696 per ounce in the year.
- Cons: Ahafo South fell from 798 koz in 2024 to 664 koz, and its AISC rose from US$1,072 to US$1,494 per ounce. We add the two parts because they are one district; Newmont lists them as separate segments.
- Facts: Ghana changed its gold royalty to a sliding scale in March 2026 that can reach 12% above US$4,500 per ounce, replacing a flat 5% (World Gold Council, 2026). Data: Newmont Q4 2025 operating statistics.
6. Detour Lake, Ontario
Best for: low cost and a long open-pit life.
- Pros: Agnico Eagle calls it Canada’s largest gold mine. Its 2025 total cash cost was US$879 per ounce. Reserves are 18.6 Moz at 0.72 g/t (open pit, end of 2025), and an underground study could add 300 to 350 koz a year.
- Cons: a low grade means huge tonnages to move. Agnico guides 700 to 730 koz for 2026 and 610 to 640 koz for 2027, below the 692,675 oz of 2025, because of a lower-grade stretch in the mine plan.
- Facts: total cash cost is a narrower measure than AISC, so do not set it against an AISC figure without care (Agnico Eagle, February 2026).
7. Kibali, Democratic Republic of the Congo
Best for: a high-grade African mine with an underground core.
- Pros: 2025 mill grade was 2.79 g/t at 90% recovery, and underground ore averaged 5.17 g/t. Barrick reports a 2025 AISC of US$1,337 per ounce, one of the lowest among its mines.
- Cons: output has drifted down, from 343 koz in 2023 to 309 koz in 2024 and 303 koz in 2025 at Barrick’s 45% share.
- Facts: Barrick owns 45% of Kibali; its 2026 forecast is 270 to 310 koz at that share.
8. Canadian Malartic, Quebec
Best for: a mine that is being rebuilt around new ore.
- Pros: 642,612 oz in 2025 at a total cash cost of US$946 per ounce. Agnico is bringing in the East Gouldie deposit and is studying a path to one million ounces a year in the longer term.
- Cons: Agnico’s own 2026 forecast is lower, at 575 to 605 koz, before a return to 640 to 670 koz in 2027.
- Facts: the Barnat pit is due to be depleted in 2029, so the long-term plan leans on East Gouldie (Agnico Eagle, February 2026).
9. Pueblo Viejo, Dominican Republic
Best for: watching how metallurgy (the process that recovers gold from ore) can cost ounces.
- Pros: throughput hit records and Barrick is building a plant expansion with a new tailings facility. Processed grade was 2.44 g/t.
- Cons: recovery slipped to 75% in 2025 from 79% in 2024 because of lower recoveries from stockpiled ore. At 100% the mine made about 632 koz.
- Facts: Barrick holds 60% and Newmont 40%. Newmont’s 253 koz at 40% gives the same 100% figure, a useful cross-check between two filings.
10. Paracatu, Brazil
Best for: seeing how a very low-grade mine still makes more than half a million ounces.
- Pros: 601,318 gold-equivalent ounces in 2025, up 14% from 528,574. Production cost of sales fell to US$978 per ounce sold from US$1,039. Kinross owns 100%.
- Cons: the average grade was only 0.43 g/t, so the mine processed 52.6 million tonnes of ore for those ounces. Harder ore lowered throughput 10%. “Gold equivalent” converts a little silver to gold at 86.29 to 1, so the figure is not pure gold.
- Facts: recovery was 82.0% against 80.2% in 2024, helped by extra gravity-circuit equipment (Kinross, 2025 management discussion and analysis).
Just below the top 10
Lihir in Papua New Guinea (Newmont) made 585 koz in 2025, down from 614 koz. A World Gold Council review of late-2024 results noted that Lihir’s AISC rose during the Phase 14A expansion and wall construction (World Gold Council, 2025). Natalka in Russia (Polyus) made 567 koz, up 25%. Boddington in Western Australia (Newmont) made 565 koz, plus 24 thousand tonnes of copper, at an AISC of US$1,514 per ounce. Then come Turquoise Ridge in Nevada (about 554 koz after dividing 341 koz by 0.615), Yanacocha in Peru (515 koz) and Meadowbank in Nunavut (493 koz).
How we chose these gold mines
“Best” means different things to different readers, so we picked one measurable metric: gold produced in calendar 2025, in ounces, taken from company filings. We did not rank on reserves, grade, margin or environmental record, because those need different tests.
- Source: annual reports and results releases from Barrick, Newmont, Agnico Eagle, Freeport-McMoRan, Kinross and Polyus, all opened for this page. Each ounce figure is in the sources list.
- Basis: 100% of the mine, so a joint venture is not penalised for sharing ownership. Where a filing shows only the owner’s share we divide by the share. Barrick’s Pueblo Viejo and Newmont’s Pueblo Viejo lines give the same 100% result (about 632 koz), which suggests the method is sound.
- Mine, not company: we rank an operating site or district under one name. We did not rank the Nevada Gold Mines joint venture as one, because Barrick reports Carlin, Cortez and Turquoise Ridge separately. Three entries are districts or complexes: Grasberg (one orebody district run by one company), Ahafo (South and North, added together) and Olimpiada (Polyus reports it as one asset). Ahafo South alone made 664 koz, which would place it between Kibali and Pueblo Viejo, at about seventh or eighth.
- Universe: mines owned by companies that file mine-level ounces we could open. Mines whose owners do not publish a 2025 figure for the mine alone, for example Muruntau in Uzbekistan (Navoi reports only a company total of about 3.15 Moz), are not ranked. Olimpiada (Russia, Polyus, 926 koz) and Paracatu (Brazil, Kinross, about 601 koz) do publish mine figures and are ranked.
- One year: 2025 only. A mine can move several places in a year; Grasberg and Olimpiada would normally be higher.
Cost per ounce: which of these mines are cheap to run
Big output does not mean low cost. The chart plots 2025 ounces (100% basis) against each company’s reported AISC. Barrick and Newmont define AISC a little differently, so use it to see the spread, not to split a few dollars. Lihir and Boddington, just outside the top 10, are included as comparison points. Carlin made the most gold and had the highest AISC of the eight points, US$1,906 per ounce, while Kibali made 673 koz at US$1,337.
Chart
Output against all-in sustaining cost, 2025
Eight mines; AISC as defined by Barrick or Newmont, which differ slightly
The World Gold Council puts the global average AISC at US$1,785 per ounce for the first quarter of 2026, with royalties now 12% of the average operation’s cost (World Gold Council, 2026). The two periods differ (2025 for the mines, first quarter 2026 for the average), so treat the comparison as a rough guide; the World Gold Council notes this was the 28th year in a row of rising AISC.
The driver is often the rock itself. Refractory ore needs roasting or an autoclave, which burns sulfuric acid and fuel. Barrick said higher sulfuric acid use and price pushed Carlin’s costs above guidance. Soft ore that leaches in heaps is cheaper but usually lower grade.
Which mines produced more or less than the year before
Newmont’s table shows both years for sites it reports at 100%. The picture is mixed: Yanacocha and Peñasquito rose by more than 100 koz, while Ahafo South and Cadia fell by more than 75 koz. Newmont’s total attributable output also fell, from 6,849 koz in 2024 to 5,889 koz, partly because it sold mines in 2025.
Chart
Newmont sites: gold produced in 2024 and 2025
Thousand ounces as reported by Newmont for sites shown at 100%
The lesson for a ranking is that a mine’s place can change quickly. Carlin dropped 11%, Kibali drifted down 2% and Pueblo Viejo rose 8% at Barrick’s share. Ounces from a single year, like those in the table above, are a snapshot.
Best gold mining jurisdictions: where the ounces come from
The mines above sit in eight countries, including Russia, Brazil and Indonesia. The USGS estimates 2025 world mine production at 3,300 tonnes. China led with 380 tonnes, then Russia (310), Australia (280), Canada (200) and the United States (160). Nevada made about 64% of US output, and the top 25 US operations made about 94% of it.
Chart
Gold mine production by country, 2025 estimate
Tonnes of contained gold; top seven countries (USGS estimates)
What makes a jurisdiction “good” for a mine owner is mostly rules and stability, not geology. Filings from 2025 and 2026 show the range of risks:
- Contract and licence risk: Barrick’s Loulo-Gounkoto complex in Mali was placed under temporary provisional administration on 16 June 2025. Barrick regained control on 16 December 2025 and had paid a settlement to the Government of Mali in November 2025. The dates come from Barrick’s fourth-quarter 2025 release, and Barrick’s annual report shows attributable output from the complex fell by 549 koz in 2025.
- Fiscal risk: Ghana moved to a sliding royalty, and Burkina Faso introduced one in 2025 (World Gold Council, 2026).
- Operating risk: the Grasberg mud rush shows that an accident, not a government, can stop a mine for months.
The United States and Canada host four of the ten ranked mines, and both publish mining claims and licences online. If you hold or want a licence, our guides to where gold is found in the United States and to mining cadastre portals by country show how to check land status before any money is spent.
We did not use a survey of mining executives here, because the published rankings could not be opened and checked for this page. The table of production above is the verified part; the jurisdiction notes are examples from company filings, not a score.
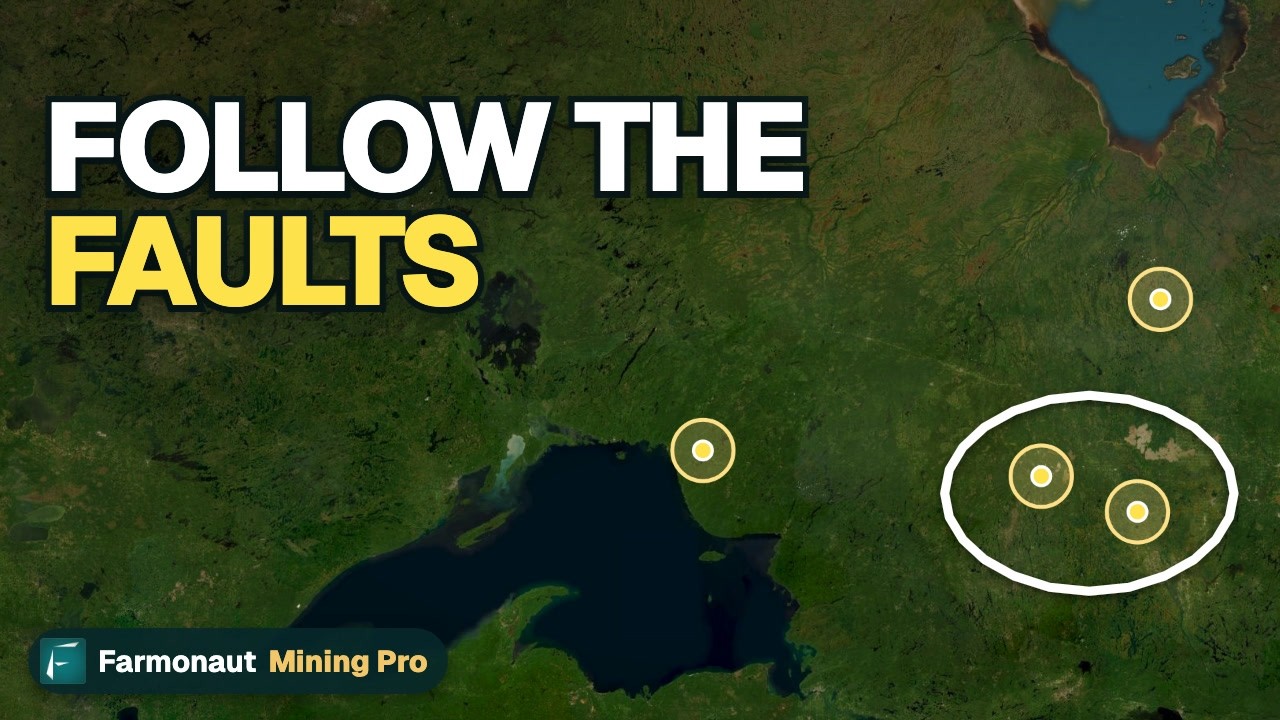
▶ Shows where Ontario’s gold sits, in a few belts of very old rock, and the big camps. · 2:53
How to judge a gold mine yourself
Ounces tell you size. To compare mines or projects, check these items in the company’s latest annual report and technical report.
- Grade and recovery. Compare the processed grade (g/t) and the percent of gold recovered. Pueblo Viejo’s 2025 recovery of 75% against 79% a year earlier cost real ounces.
- Cost against price. Subtract AISC from the gold price. The calculator below does it for you. A mine with a lower cost but a short life may be worth less than a bigger, dearer one.
- Reserve life. Divide proven and probable reserves by annual output. Detour Lake’s 18.6 Moz against about 0.7 Moz a year is a long life; a figure drawn from resources, not reserves, is far less certain. Reserves are ore that is economic at a stated price; resources are mineralisation that may become economic.
- Ore type. Simple ore that does not need roasting is cheaper to treat. Refractory ore needs a roaster or autoclave, which adds cost and risk.
- Waste and water. Compare waste moved with ore mined. At Cortez, 46.7 million tonnes of waste came with 7.4 million tonnes of ore in the open pit. Ask for the water and tailings plan too.
- Jurisdiction. Look at royalty changes, permit timelines and any recent state intervention.
- Ownership. Check which share is reported in a table: 100%, the company’s share, or consolidated.
The ranking in this guide does not measure environmental performance. Each operator publishes its own sustainability report, and independent audits and site visits are a better basis for that judgement than an output table.

▶ Follows a clay gold nugget from rock to ring: drilling, crushing, dissolving, melting and refining. · 5:27
Calculator: what a mine earns per year at your price
The calculator below uses the same logic as the cost chart: ounces times the gap between your gold price and the mine’s AISC. Enter your own numbers or copy figures from a company report. It gives a margin before interest, growth capital and hedging, not a valuation.
Calculator
What does a mine earn per year at your price?
Enter annual ounces, a gold price and an AISC from a company report.
- Revenue (US$ million): 2,000 US$m
- Operating margin (US$ million): 1,100 US$m
- Illustrative after-tax margin (US$ million): 825 US$m
- Margin as share of price: 55.0 %
Example values only, not any mine’s figures or a forecast. The price is an input: example, use today’s price (US$ per ounce). AISC comes from the company’s report and follows its own definition. The result excludes interest, growth capital, hedging and tax unless you set a rate; the tax rate is an example to confirm with an adviser.
Where satellite data helps before a mine exists
Every mine on this list started as an exploration target. Satellites cannot see gold, but they can map iron-oxide staining, clay minerals and fault patterns at the surface, which help geologists decide where to drill first. Farmonaut turns a licence boundary into a satellite-based mineral detection report that flags possible exploration targets, ahead of any resource estimate; you can also request a quote. For the basics of finding gold, read our guide to mining prospecting for gold.
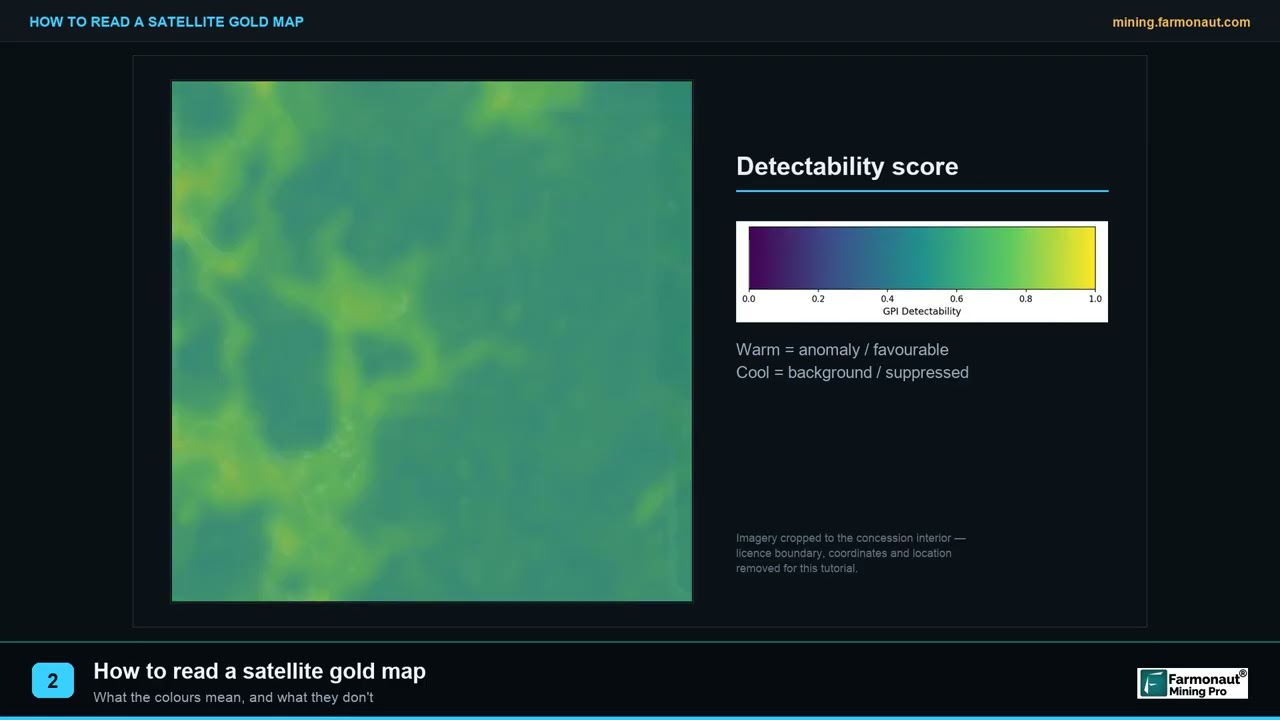
▶ Explains how to read a satellite gold map, which shows clues to gold rather than gold itself. · 1:40
Frequently asked questions
What is the largest gold mine in the world?
In the filings we could open for 2025, Carlin in Nevada made the most gold, about 1.12 Moz at 100% of the mine. The answer depends on the year and on whether you count a mine or a whole district: the Grasberg district would normally be higher, at about 1.3 Moz a year (Freeport), and Olimpiada made 1,265.7 koz in 2024 (Polyus). We did not rank Muruntau because we found no 2025 filing figure.
Which country produces the most gold?
China, with an estimated 380 tonnes of mine output in 2025, ahead of Russia at 310 tonnes and Australia at 280 tonnes (USGS, 2026). World mine production was about 3,300 tonnes.
What is the best gold mining jurisdiction?
There is no single answer. It depends on royalty rates, permit speed, legal stability and geology. Nevada hosts the largest mine in our list and a second at fourth and made about 64% of US gold in 2025 (USGS). Filings also show how fast rules can change, as with Ghana’s sliding royalty and the Mali administration of Loulo-Gounkoto.
How many ounces are in a tonne of gold?
About 32,151 troy ounces, because one tonne is 1,000,000 grams and one troy ounce is 31.1035 grams. A mine making 700,000 oz a year therefore produces roughly 21.8 tonnes.
What does AISC mean for a gold mine?
AISC, all-in sustaining cost, is a cost per ounce that adds sustaining capital, royalties and overhead to mining and processing costs. The World Gold Council’s global average for the first quarter of 2026 was US$1,785 per ounce. Companies define it slightly differently, so check each one’s notes.
Is a higher-grade gold mine always better?
No. Cortez underground ore averaged 7.83 g/t in 2025, while Detour Lake’s reserves average 0.72 g/t. Detour makes up for the low grade with scale and a total cash cost of US$879 per ounce. Compare grade with recovery, cost and mine life together.
Why did Grasberg’s gold output fall?
A mud rush in September 2025 led to a suspension of operations at PT Freeport Indonesia. Fourth-quarter gold production was 65 koz against 432 koz in the same quarter of 2024. Freeport plans a phased restart of the Block Cave mine from the second quarter of 2026.
Which of these mines has the lowest cost per ounce?
On company-reported figures, Yanacocha had an AISC of US$964 per ounce and Ahafo North US$696, but both are co-product figures from Newmont and Ahafo North only began commercial production in late 2025. Among Barrick mines in this list, Kibali’s US$1,337 was lowest. Because definitions differ, these are not exact comparisons.
Who owns Carlin and Cortez?
Both belong to Nevada Gold Mines, a joint venture in which Barrick holds 61.5% and Newmont holds 38.5%. Each company reports its own share, which is why ranking by 100% output needs the division shown in the table.
How can I check a mine’s current status?
Read the owner’s latest quarterly results and technical reports on SEC EDGAR or SEDAR+, and check the claim or licence record in the national cadastre. Mine output, costs and guidance change each quarter, so treat any ranking, including this one, as dated.
Do these rankings show which gold mines are the most sustainable?
No. This ranking uses ounces produced. Sustainability depends on water use, tailings management, closure plans and community agreements, which you can only judge from each operator’s own reports and independent audits.
This page is for information only. It is not investment advice. It gives no share prices or targets; check each company’s own reports before you decide anything.
Farmonaut mining
Map your mining site from space
Consultants can screen a licence area with satellite data to find exploration targets ahead of a resource estimate.

Mining Pro sample view, synthetic data
Keep reading
Sources
- Barrick Mining Corporation, Annual Report 2025: s25.q4cdn.com
- Barrick, Full Year and Fourth Quarter 2025 Results: finviz.com
- Newmont, Q4 2025 Operating Statistics (19 February 2026): s24.q4cdn.com
- Agnico Eagle, Fourth Quarter and Full Year 2025 results: s205.q4cdn.com
- Freeport-McMoRan, Fourth-Quarter and Year Ended 2025 Results (SEC exhibit 99.1): sec.gov
- USGS, Mineral Commodity Summaries 2026: Gold: pubs.usgs.gov
- World Gold Council, Record gold prices outpace rising mining costs in Q1’26: gold.org
- World Gold Council, Ever upwards for AISC, but distinct regional variations are emerging: gold.org
- World Gold Council, Gold Demand Trends Q2 2026: Supply: gold.org
- USGS, Mineral Commodity Summaries 2026 (full volume): pubs.usgs.gov
- Polyus, Operating results for the second half and full year 2025 (PDF): polyus.com
- Kinross Gold, Management’s discussion and analysis, year ended 31 December 2025: sec.gov
Discussion
Questions, corrections or field experience? Share them below. First-time comments are reviewed before they appear, and your email is never published.
No comments yet. Be the first to add a question or your experience.

 Ileys General Trading
 SG Gold Mining LLC
 VRV Global Pte Ltd
 Omsri International FZE
 G.I.T.T.
 Jaunita Erss Ltd
 Almosi SARL
 SRK Consulting
 Berks Gold Limited
 Mwerezi Minerals Company Limited
 Mining SARL
 SenGold Invest SAS
 Sean Mining Limited
 NTS Group (Pty) Ltd
 Mine4Africa
 Lithspo Minerals Limited
 Tintina Mining Group

 Licence holder · Nigeria · Gold + lithium










