

Reviewed September 2026 against USDA Economic Research Service, USDA National Agricultural Statistics Service, and Credence Research data.
Try it: Run your own numbers →
Digital farm management is the use of satellite data, AI, IoT sensors, and cloud software to plan, monitor, and coordinate every stage of an agricultural supply chain — from planting through storage, transport, and final sale. In the United States, the digital agriculture market was valued at $28.56 billion in 2024 and is projected to reach $58.64 billion by 2030, a 12.74% compound annual growth rate, according to Market Research Reports / StatiFacts. This article covers what digital farm management actually includes, how agribusiness supply chain management and agriculture digital supply chain tools differ from on-farm precision equipment, and where storage and logistics technology fits into the picture.
What Digital Farm Management Actually Covers
Digital farm management sits at the intersection of on-farm precision tools (GPS guidance, yield monitors, soil sensors) and supply chain software (planning, traceability, logistics, storage automation). USDA’s Economic Research Service reports that 67% of US corn planted acres used GPS guidance systems as of 2016, and USDA NASS’s Agricultural Census found 86% of cotton planted acres used precision agriculture equipment by 2023. But GPS guidance on a tractor is only the input side. The other half — moving that harvest through storage, transport, and into a buyer’s hands with verifiable data — is what the agriculture supply chain management market is built to solve.
That distinction matters because the two halves are adopted at very different rates. USDA NASS’s October 2024 release put overall precision agriculture adoption at 27% of US farms in 2023, while farmers spent $3 billion on irrigation equipment and computer technology that same year. The supply chain software layer on top of that hardware — planning, traceability, fleet, and storage systems — is a separate, faster-growing market: $1.58 billion in the US in 2025, projected to reach $2.86 billion by 2030 at a 12.62% CAGR, per Credence Research.
Agribusiness Supply Chain: Where the Market Stands
An agribusiness supply chain runs from seed and input supply through planting, harvest, storage, processing, transport, and final sale to wholesale, retail, or export buyers. Agribusiness supply chain management is the discipline of planning and coordinating that flow using shared data instead of phone calls and paper tickets. The US market for the software that does this — agricultural supply chain management platforms specifically, not general farm equipment — was $1.58 billion in 2025 and is forecast to grow to $2.86 billion by 2030, a 12.62% CAGR, according to Credence Research’s agriculture supply chain management market report.
Adoption of the underlying precision layer varies sharply by crop. USDA’s Economic Research Service “Charts of Note” series (chart ID 93064) puts GPS guidance adoption at 67% of corn acres, 86% of cotton acres, with wheat and rice lower, based on the most recent USDA NASS Agricultural Census data available at time of publication. Because the Census of Agriculture runs on a 5-year cycle and ERS updates its charts annually, readers should check the USDA ERS Charts of Note page directly for the current-year figures rather than relying on any fixed number here.
What “Agribusiness Supply Chain” Requires in Practice
- ✔ Visibility across inputs, farming practices, and harvest lots
- 📊 Data-driven planning and forecasting to align supply and demand
- ⚠ Risk management tools against weather, disease, and market volatility
- 🌱 Sustainable value-chain practices that minimize environmental impact
- 🔗 End-to-end traceability for compliance and quality assurance

Vehicle Tracking and IT Services for Agribusiness Logistics
Vehicle tracking for agricultural supply chain management is a logistics tool, not a crop-monitoring one: it is GPS- and telematics-based software that records a vehicle’s location, route, speed, and idle time as grain, produce, or livestock move between farm, storage, and buyer. Inside an agribusiness supply chain, it functions as the transport layer that connects harvest data to delivery data — confirming that what left the field or bin is what arrived at the elevator, processor, or port, and when.
This is one piece of the broader category of IT services for the agribusiness supply chain: hosted software, APIs, and integration support that connect farm-level data (yield, moisture, harvest timing) to downstream systems (storage inventory, transport scheduling, buyer contracts). USDA does not publish a separate adoption figure for commercial fleet-tracking software in agricultural transport — the GPS guidance data cited above covers in-field equipment guidance, not logistics fleets. A buyer evaluating vehicle tracking or IT services for their own supply chain should request adoption or ROI figures directly from the vendor, since no independent US government survey currently isolates this category.
Farmonaut’s fleet and resource management tools apply this same logic to agribusiness logistics — route and schedule visibility layered on top of the crop and storage data already being collected, rather than a separate system a business has to reconcile by hand. Learn how Farmonaut’s fleet management tool supports agribusiness logistics.
Seven Digital Trends Shaping Agribusiness & Value Chain Management
Seven digital trends currently define agribusiness and value chain management. Together they reshape planning, traceability, in-transit monitoring, storage, collaboration, risk management, and sustainability reporting.
- AI-Powered Planning & Forecasting: Satellite data and machine learning for demand-driven production planning.
- Integrated Traceability & Blockchain Solutions: Field-to-buyer transparency, compliance, and origin authentication.
- Internet of Things (IoT) & Sensor Networks: Real-time monitoring of crop conditions, handling, storage, and logistics.
- Cold Chain Intelligence & Automated Infrastructure: Temperature and humidity monitoring to preserve perishables in transit.
- Cloud-Based Collaboration Platforms: Shared data and scheduling across farmers, processors, and retailers.
- Risk Management Platforms & Insurance Tech: Scenario modeling and satellite-verified claims for continuity.
- Sustainability Analytics & Environmental Impact Tracking: Emissions and resource-use monitoring for compliance and premium markets.

Comparative Summary Table: 7 Digital Trends & Impact
| Trend | Key Technologies | Primary Supply Chain Stage | What It Directly Enables |
|---|---|---|---|
| AI-Powered Planning & Forecasting | Satellite imagery, machine learning | Pre-planting to harvest | Demand-matched production, yield estimation |
| Blockchain Traceability | Blockchain, mobile data capture | Harvest through retail | Origin proof, recall readiness, certification |
| IoT & Sensor Networks | Field, storage, and transport sensors | Storage and logistics | Real-time condition monitoring |
| Cold Chain Intelligence | Temperature/humidity sensors, refrigerated transport | Transit | Spoilage prevention, shelf-life extension |
| Cloud Collaboration Platforms | Web/mobile apps, shared dashboards | Cross-stakeholder | Joint planning, reduced information gaps |
| Risk Management Platforms | AI analytics, satellite-based insurance verification | Whole chain | Continuity through weather/market shocks |
| Sustainability Analytics | Carbon tracking, API integrations | Whole chain | Compliance reporting, premium-market access |
Bioagriculture Storage: Grain Silos and Automated Handling
Bioagriculture storage refers to the facilities and systems that hold harvested biological products — primarily grain, but also feed and biomass — between harvest and processing or sale. The global grain silos and storage system market was valued at $1.751 billion in 2024, according to Grand View Research and Market Research Future. Digital storage management overlays sensors and software onto these physical silos and bins: monitoring grain moisture and temperature to prevent spoilage, tracking inventory levels in real time, and automating load-in/load-out to cut labor time and human error.
USDA does not publish a farm-level adoption rate specifically for automated grain handling; the research brief for this article notes that periodic USDA NASS facility modernization surveys, along with annual adoption and efficiency reports from the National Grain and Feed Association and USA Grain Council, are the most reliable sources for current figures. Anyone sizing a storage-automation investment should pull the latest numbers from those sources directly rather than rely on a static figure that ages out.
Farmonaut: Digital Tools for Agribusiness Supply Chains
Farmonaut provides satellite imagery, AI, and blockchain tools that agribusinesses, cooperatives, and individual farmers use to run the digital side of their supply chain — planning, monitoring, traceability, and logistics — from one connected platform.
Farmonaut’s platform provides:
- Satellite-Based Crop Monitoring: Real-time NDVI, field conditions, and harvest-timing data for input planning and yield forecasting.
- Jeevn AI Advisory System: Weather forecasting, risk alerts, and harvest-timing recommendations from satellite data.
- Blockchain Traceability: Tamper-proof, farm-to-buyer documentation supporting compliance and rapid recalls.
- Fleet & Resource Management Tools: Route, scheduling, and usage management to cut logistics costs. See fleet management details.
- Environmental Impact Monitoring: Carbon footprint, soil health, and resource-use tracking. See carbon footprinting.
- Crop Loan and Insurance Support: Satellite-verified data for insurance and finance applications. Learn about crop loan support.
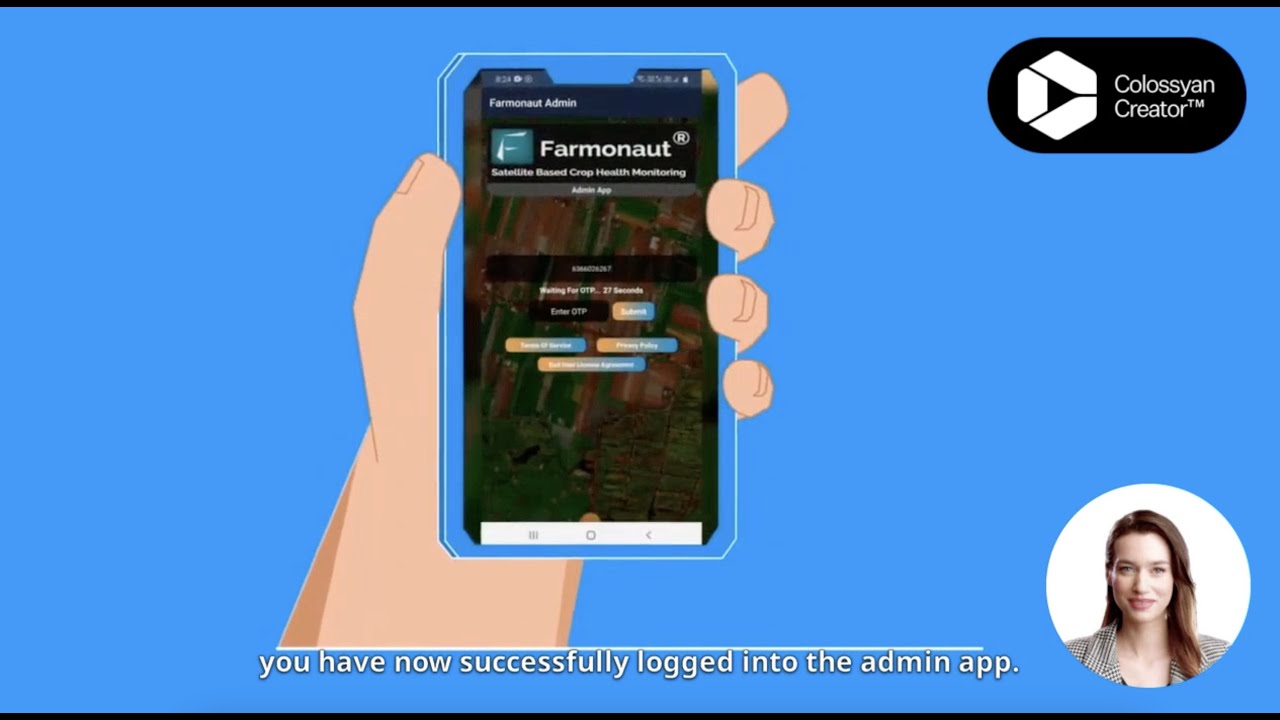
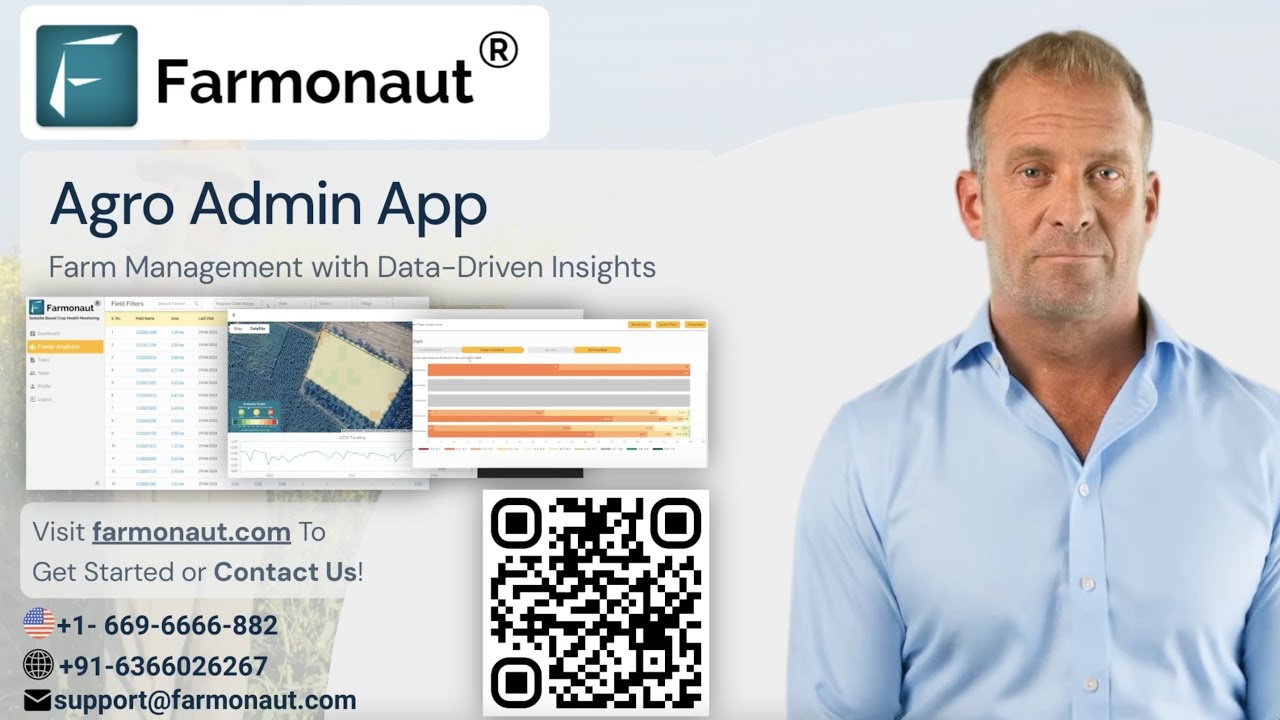
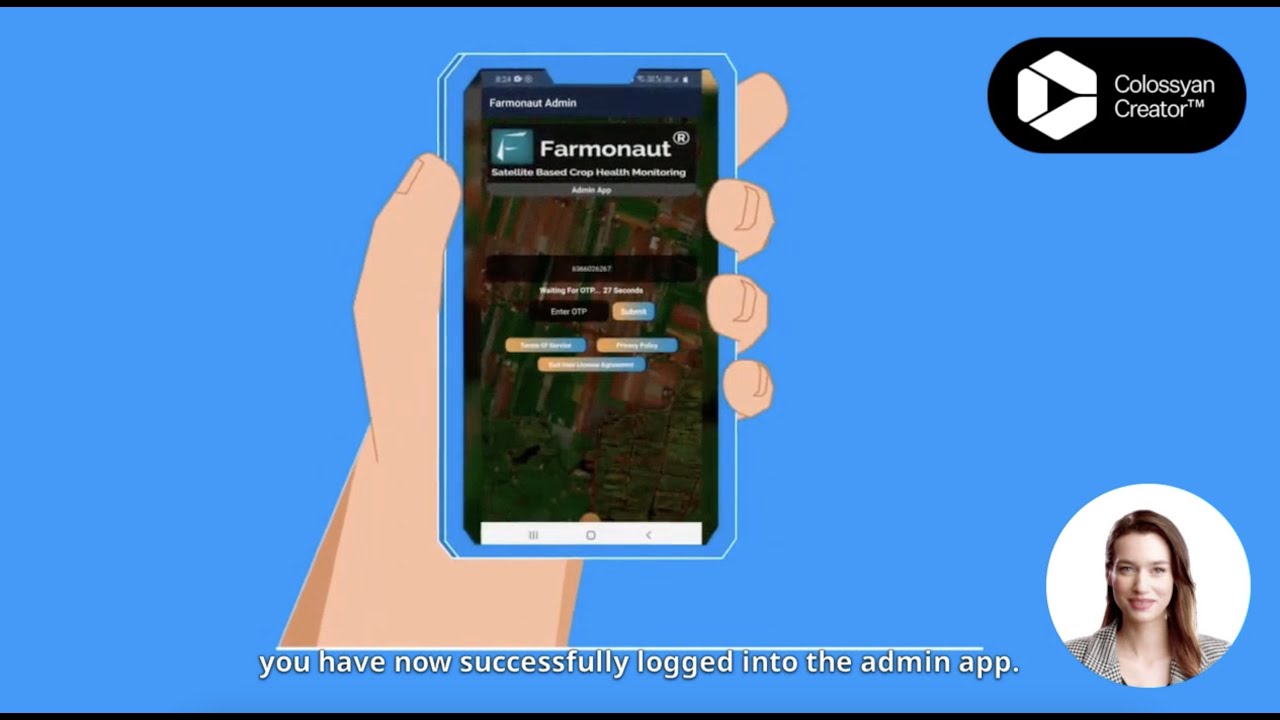
- Large-Scale Farm Management: For agribusinesses coordinating multiple fields or producers, the Agro Admin App centralizes data collection and collaboration across supply networks.

In-Depth: The 7 Trends
1. AI-Powered Planning & Forecasting
AI-powered planning uses satellite imagery and machine learning to align production with real demand signals rather than historical guesswork. It supports demand-driven production plans, yield estimation for input and rotation decisions, and scenario modeling that reduces bottlenecks before they occur. This is the layer that lets processors align intake capacity and cold-chain providers anticipate throughput ahead of harvest surges.
2. Integrated Traceability & Blockchain
Traceability systems track a product from field through washing, grading, packing, and storage, documenting each handoff on a blockchain ledger that can’t be quietly edited after the fact. This supports recall readiness, certification documentation for export and premium markets, and origin authentication that buyers increasingly require as a condition of purchase.
3. Internet of Things (IoT) & Sensor Networks
IoT sensors bring continuous visibility to crop conditions, storage temperature and humidity, and in-transit conditions for perishable goods. They feed a centralized platform automatically, replacing manual spot-checks with alerts that fire the moment a threshold is crossed — before spoilage sets in, not after.

4. Cold Chain Intelligence & Infrastructure
Cold chain integrity determines how much of a perishable harvest actually reaches a buyer sellable. Temperature and humidity sensors, insulated transport, and managed cold storage together minimize spoilage, extend shelf life, and expand market reach for specialty and perishable crops. AI-based monitoring alerts stakeholders the moment cold chain conditions break, before losses compound.
Discover how Farmonaut’s fleet management tool supports cold chain logistics

5. Cloud-Based Supply Chain Collaboration Platforms
Cloud platforms give farmers, processors, and buyers joint access to the same planning and inventory data instead of each party working from its own spreadsheet. This reduces the information gaps that cause overproduction in one place and shortages in another, and it supports automated scheduling updates as harvest timing shifts.
6. Risk Management Platforms
Risk management tools combine AI analytics, scenario planning, and satellite-verified insurance claims to protect continuity through weather events, disease outbreaks, and price volatility. Satellite-based verification is increasingly used directly in loan and insurance underwriting. Read more about crop loan and insurance support.
7. Sustainability Analytics
Sustainability analytics track soil health, water use, and carbon emissions so an agribusiness can document compliance with eco-certification standards and support premium-market positioning. Farmonaut’s carbon footprinting gives agribusinesses a data-backed route to meeting these requirements rather than relying on self-reported estimates.

Storage Loss & Automation Payback Calculator
Estimate what unmonitored grain storage loss is costing per season, and how many seasons an automated monitoring system would take to pay for itself, using your own bushels, price, and loss-rate assumptions.
Run your own numbers
Assumptions: uses the volume, price, and loss-rate figures you enter — it does not assume a fixed spoilage rate for your operation. It excludes financing costs, installation labor, and ongoing subscription or maintenance fees for the monitoring system, so treat the payback period as a starting estimate to refine with an actual vendor quote.
Measuring Success in Digital Farm Management
Digital transformation in agribusiness supply chains is measured against operational metrics, not adoption claims. The metrics that matter:
- 📊 Yield per acre: improvement from optimized planning and input use
- 🔻 Post-harvest loss rate: reduction through better cold chain, storage, and logistics
- 📦 Order fill rate & on-time delivery: reliability for buyers and retailers
- 💸 Inventory turnover rate: speed of data-driven movement through the chain
- 😃 Buyer retention: tied to traceable origin and consistent product quality
For market-level benchmarking, the US agricultural supply chain management software market's growth from $1.58 billion (2025) to a projected $2.86 billion (2030) — a 12.62% CAGR per Credence Research — is a useful proxy for how fast peers are investing in these categories. Farm-level adoption of the underlying precision technology can be checked against USDA NASS's periodic Census of Agriculture releases and the annual figures published in USDA's NASS newsroom.
Farmonaut Subscription Plans
Farmonaut offers scalable subscription options so individual farmers, cooperatives, and enterprise supply chain managers can each access the tier of satellite, AI, and blockchain tooling that fits their operation.
Frequently Asked Questions
What is digital farm management?
Digital farm management combines on-farm precision technology (GPS guidance, sensors, satellite monitoring) with supply chain software (planning, traceability, logistics, storage) to coordinate an agricultural operation from input through final sale using shared, real-time data instead of manual records.
What is agribusiness supply chain management?
It is the planning, monitoring, and coordination of agricultural inputs, production, harvest, storage, processing, and distribution, ending in traceable delivery to retail or export markets. The US market for this software category was $1.58 billion in 2025, projected to reach $2.86 billion by 2030 (Credence Research).
What kind of tool is vehicle tracking for agricultural supply chain management?
It is a GPS/telematics logistics tool that records vehicle location, route, and timing as goods move between farm, storage, and buyer — distinct from in-field precision equipment. It functions as the transport-verification layer connecting harvest data to delivery data.
What are IT services for the agribusiness supply chain?
Hosted software, APIs, and integration support connecting farm-level data to downstream storage, transport, and buyer systems — covering everything from satellite monitoring APIs to fleet-tracking dashboards and blockchain traceability platforms.
What is bioagriculture storage and how is it measured?
Bioagriculture storage covers the facilities holding harvested grain, feed, or biomass between harvest and sale. The global grain silo and storage system market was valued at $1.751 billion in 2024 (Grand View Research / Market Research Future); digital storage management adds sensors and software on top of that physical infrastructure to track moisture, temperature, and inventory in real time.
How can I access Farmonaut's digital supply chain tools?
Farmonaut offers web, Android, and iOS apps for real-time supply chain monitoring, plus an API for integrating satellite and blockchain data directly into an existing platform.





Conclusion: Building Agribusiness Supply Chains That Hold Up
Digital farm management works when the precision layer (GPS, sensors, satellite monitoring) and the supply chain layer (planning, traceability, logistics, storage) are connected rather than run separately. USDA's adoption figures show the precision layer is well established in major crops — 67% of corn acres and 86% of cotton acres used GPS guidance as of the years cited above — while the software layer that turns that data into supply chain decisions is the smaller, faster-growing piece: $1.58 billion in the US in 2025, headed toward $2.86 billion by 2030.
Whichever of the seven trends above an agribusiness prioritizes first, the durable test is the same one to reapply each season: can a shipment be traced back to its field, can a storage loss be measured before the buyer complains about it, and can a logistics delay be seen the day it happens rather than the week after. Check USDA ERS and NASS directly for updated adoption figures, and use the calculator above with current bushel and price data to re-run the storage math for any given season.




 Messina Beej
 Dirks Bros Farms
 Red August Group
 Farm Inc
 WeMe Global
 Agrotoken
 Blue BearX
 Insignito
 Croptimum
 DnCubed
 Field Capacity
 Indosistim Teknologi
 Liquify Digital
 CU Foods
 BeyondTech Global
 Rouge VC
 AgroGreen Dynamics
 AgroRisk
