

Gold price · Data guide
Gold Price per Ounce: Chart and Drivers
Spot gold was US$4,157.70 per troy ounce on 15 October 2026 (Kitco), about 26% below January’s high. This page charts five quarters of averages and the rock behind one ounce, and values your ore.
Key takeaways
- Kitco’s spot bid was US$4,157.70 per troy ounce (about US$133.67 per gram) at 2:50 p.m. EDT on 15 October 2026.
- The LBMA PM price averaged US$4,506.29 in Q2 2026, 8% below the Q1 record of US$4,872.90 and 37% above Q2 2025 (World Gold Council).
- One ounce is 31.1035 grams: at 1 g/t about 31 tonnes of rock hold an ounce, and eight Agnico Eagle mines range from about 3 to 32 tonnes per ounce (Q2 2026).
- Above-ground gold was 222,600 tonnes, about 7.2 billion ounces, at end-June 2026 (World Gold Council).
- The global average all-in sustaining cost was US$1,785 per ounce in Q1 2026 (World Gold Council).
In this article
- Gold price per ounce today and how to read the quote
- Gold price per ounce history: five quarters of averages
- What moves the gold price
- How much rock is needed for one ounce of gold
- How many ounces of gold exist above ground
- What an ounce costs to produce, and how that compares
- How a higher price changes royalties and the value of a deposit
- Calculate what your ore is worth per tonne and per ounce
- Where to check the live price
- Where satellite screening fits before you drill
- Frequently asked questions
Gold traded at US$4,157.70 per troy ounce on 15 October 2026 (Kitco spot bid, 2:50 p.m. New York time). That is about US$133.67 per gram. It is roughly 26% below the January 2026 high of US$5,595, which the World Gold Council (WGC) says was touched only momentarily. The quarterly average was higher still: the LBMA PM benchmark averaged US$4,506.29 in the second quarter of 2026.
This page does four things that a live ticker does not. It shows the price in plain units and by carat. It charts five quarters of benchmark averages. It shows how many tonnes of rock sit behind one ounce at real mines. And it gives you a calculator for the value of your own ore. Prices change by the minute, so every figure below carries a date and a source.
Gold price per ounce today and how to read the quote
Gold is priced in troy ounces. One troy ounce is 31.1035 grams, which is heavier than the 28.35 grams of an ordinary (avoirdupois) ounce. If a source says “ounce” next to a gold price, it means the troy ounce. Mixing the two puts a result out by about 10%, because the troy ounce is 31.1035 g against 28.35 g.
The number you see on a chart is the spot price: the price for gold bought now, from the global over-the-counter market. A quote shows a bid (what a dealer pays you) and an ask (what a dealer charges you). On 15 October 2026, Kitco showed a bid of US$4,157.70 and an ask of US$4,159.70, with a day range of US$4,099.20 to US$4,169.40. Physical coins and bars sell above spot because of dealer premiums.
The same Kitco page converts the spot bid into other units and purities. The values below are metal value only, at that moment.
| Unit or purity | Metal value, 15 Oct 2026 (US$) |
|---|---|
| 1 troy ounce, 24K | 4,157.70 |
| 1 gram, 24K | 133.67 |
| 1 kilogram, 24K | 133,675.21 |
| 1 troy ounce of 22K gold (91.67%) | 3,811.36 |
| 1 troy ounce of 18K gold (75%) | 3,118.27 |
| 1 troy ounce of 14K gold (58.33%) | 2,425.19 |
| 1 troy ounce of 10K gold (41.67%) | 1,732.51 |
Source: Kitco gold chart page, prices as of 2:50 p.m. EDT, 15 October 2026. Jewellery or scrap is worth less than these figures once refiners take their fees.
Banks and miners often quote the LBMA Gold Price instead. It is set in auctions twice a day, run by ICE Benchmark Administration. The WGC uses it for its quarterly averages, which is why the history chart below uses it too.
Gold price per ounce history: five quarters of averages
Averages hide the daily noise and show the direction. According to the WGC, the LBMA PM price set 53 new all-time highs during 2025 and averaged a record US$3,431 per ounce for the year, up 44% on 2024. The fourth quarter of 2025 averaged US$4,135.
Chart
LBMA PM gold price, quarterly average
US$ per troy ounce, Q2 2025 to Q2 2026
The first quarter of 2026 went higher again, to US$4,872.90. The WGC reports that the second quarter average of US$4,506.29 was 8% below the first-quarter record but still 37% above the second quarter of 2025. In other words, the price fell back from its peak and stayed far above where it stood a year earlier.
Spot gold on 15 October 2026 (US$4,157.70) sits below the second-quarter average. The chart shows where the last five quarterly averages fall.
Longer history comes from the USGS. Its yearly gold price, in dollars per troy ounce, was US$1,801 (2021), US$1,802 (2022), US$1,945 (2023), US$2,388 (2024) and an estimated US$3,300 for 2025, which the USGS describes as a 38% rise to a new record annual price. The USGS 2025 figure is its own estimate from Engelhard quotes, so it differs from the WGC’s LBMA-based US$3,431. When you compare prices across sources, check which benchmark and which averaging period each one uses.
What moves the gold price
No single driver explains a move. The WGC’s second-quarter report points to the following forces:
- Central banks. They bought 289 tonnes in the second quarter of 2026, and 863 tonnes across 2025. Their buying has stayed historically high.
- Investment funds. Gold ETFs lost 45 tonnes in the second quarter as prices softened, interest-rate expectations rose and the US dollar strengthened.
- Bars and coins. Retail buying held steady at 307 tonnes in the second quarter after two extraordinarily strong quarters.
- Jewellery. Volume fell to 278 tonnes, the lowest quarter since the pandemic, because of high prices. Spending on jewellery still rose 14% to US$40 billion.
- Technology. Electronics and AI-related demand was 80 tonnes, slightly firmer.
- Supply. Total supply was 1,269 tonnes in the second quarter. Mine output rose 2% and recycling fell 6%, because lower prices discouraged people from selling old jewellery.
Day-to-day moves follow bond yields, the dollar and inflation news. On 15 October 2026, Kitco reported spot gold up 1.05% in early trading as Treasury yields and the dollar fell, one day after a sharp loss.
How much rock is needed for one ounce of gold
An ounce of gold is a small thing: 31.1 grams. At a grade of 1 gram per tonne (g/t), you need about 31 tonnes of rock to hold one troy ounce. Divide 31.1035 by the grade and you have the tonnes of ore per contained ounce. Grade means the grams of gold in each tonne of rock.
Chart
Tonnes of rock per contained ounce, eight Agnico Eagle mines
31.1035 divided by the reported Q2 2026 gold grade; before recovery losses
This is before recovery. A plant that recovers 90% of the gold from 1 g/t rock needs about 35 tonnes for each ounce it sells. Grade also decides how big the pit, the waste dumps and the tailings store must be, so it drives cost as much as the price does.
The chart uses the head grades Agnico Eagle reported for eight of its mines in the second quarter of 2026. Grades run from 0.97 g/t at the Detour Lake open pit to 10.96 g/t at the Macassa underground mine. That is a spread of more than 11 times, so the rock needed per ounce varies from about 3 tonnes to about 32 tonnes. The tonnes-per-ounce figures are our own division of 31.1035 by each reported grade.
Low-grade open pits survive on scale and cost control. High-grade underground mines move less rock but pay more to mine each tonne. Neither is better by default. The price per ounce only pays if cost per tonne and grade fit together, which is why the calculator below starts from tonnes and grade.

▶ How gold is found, drilled, crushed, dissolved, caught on carbon, melted and refined. · 5:27
How many ounces of gold exist above ground
The WGC estimated total above-ground gold at 222,600 tonnes at the end of the second quarter of 2026, worth about US$29.0 trillion at the price on that date. Divide by 31.1035 grams per ounce and that is about 7.2 billion troy ounces. All of it would fit in a cube about 22.6 metres on each side, according to the WGC.
Chart
Above-ground gold by holder, end-Q2 2026
Tonnes, rounded; total 222,600 t
Jewellery is the largest holder at about 45% (99,700 tonnes). Bars and coins hold about 21%, and central banks about 18%. Gold still in the ground is counted separately. The US Geological Survey (USGS) lists world gold reserves of 66,000 tonnes and estimates 2025 mine production at 3,300 tonnes. Dividing one by the other gives about 20 years of mining at that rate. That is a ratio, not a forecast, because reserves grow as companies explore.
China (380 tonnes), Russia (310) and Australia (280) led 2025 mine output in the USGS estimates. The United States produced 160 tonnes, worth about US$17 billion, and Canada an estimated 200 tonnes, with Ontario and Quebec together making 68% of Canadian output in 2024 according to Natural Resources Canada. For where US gold sits by state, see our guide to gold deposits in the United States.
| Country | 2025 mine output, tonnes (USGS estimate) | About, million troy ounces |
|---|---|---|
| China | 380 | 12.2 |
| Russia | 310 | 10.0 |
| Australia | 280 | 9.0 |
| Canada | 200 | 6.4 |
| United States | 160 | 5.1 |
| Ghana | 150 | 4.8 |
| Mexico | 140 | 4.5 |
| Kazakhstan | 130 | 4.2 |
| Uzbekistan | 130 | 4.2 |
Source: USGS, Mineral Commodity Summaries 2026, gold. The ounce column is our conversion at 31.1035 grams per ounce. World output was 3,300 tonnes (about 106 million ounces). Countries not in the table made about 1,420 tonnes, including Peru (110), Indonesia (90), South Africa (90) and Brazil (80).
What an ounce costs to produce, and how that compares
Producers report cost as the all-in sustaining cost (AISC). It adds site costs, sustaining capital and royalties, and divides by ounces sold. The WGC reports that the global average AISC rose 16% on a year earlier to US$1,785 per ounce in the first quarter of 2026, the 28th yearly rise in a row. Royalties were the biggest driver.
Put side by side, a spot price of US$4,157.70 against that AISC leaves about US$2,370 per ounce for the average producer. The two figures are from different dates, and cost varies widely by mine. A mine with a cost in the upper range feels a price fall much sooner than one in the lower range. Our guide to the gold mining cost curve explains how to read that range, and our epithermal gold guide covers how one type of grade-rich deposit forms.
How a higher price changes royalties and the value of a deposit
A higher price lifts what each tonne of rock is worth, and it also lifts what governments take. The WGC notes that Ghana replaced its flat 5% royalty with a sliding scale in March 2026 that reaches 12% when gold is above US$4,500 per ounce. Burkina Faso set 10% for prices between US$4,000 and US$4,500 per ounce, and Mali set 9.5% at US$4,100. Check the royalty table for your own licence before you apply a price to your ore, and ask the regulator for the current rate.
Here is the maths for a worked example with round numbers, not a benchmark. Rock at 1.5 g/t with 90% recovery yields 1.35 grams per tonne, or 0.0434 ounce. At an example price of US$4,000 per ounce, that is about US$174 of gold per tonne of ore, before royalties and costs. If mining, hauling and milling cost US$60 per tonne, the margin before royalty is about US$114. At 0.5 g/t the same rock yields about US$58 per tonne and loses money at that cost. This is why grade and price are always read together. The point where a tonne just pays its costs is the cut-off grade.
Calculate what your ore is worth per tonne and per ounce
The calculator below turns tonnes, grade, recovery and a price you choose into ounces and value. Type in your own numbers. It stops at gross value: royalties, costs and taxes are not included.
Calculator
What is your ore worth per tonne and per ounce?
Enter your own tonnes, grade, recovery and gold price. Results update as you type.
- Contained ounces: 4,823 oz
- Recovered ounces: 4,340 oz
- Tonnes of ore per recovered ounce: 23.0 t
- Gross value of recovered gold: $17,361,390
- Price per gram: $129
Example values only, not benchmarks or forecasts. Gold price is an input: example, use today’s price. Uses 31.1035 grams per troy ounce (Royal Mint). Gross value only: royalties, costs and taxes are not included. Money is in US$.
Where to check the live price
For a quick spot quote, use a live chart such as Kitco, with the bid and ask. For the benchmark that contracts and reports use, check the LBMA price page. For quarterly averages, supply and demand, use the WGC’s Gold Demand Trends reports. Always check the unit (troy ounce or gram), the currency and the time stamp. A price quoted in dollars at 10:00 will not match one quoted at 15:00.
Where satellite screening fits before you drill
Grade is only known from samples, so no satellite can tell you gold per ounce. What satellites can do is map rust-coloured iron stains, clay minerals and fault lines that often sit around gold systems, so you drill in fewer wrong places. Farmonaut offers satellite mineral detection for licence areas, with results as exploration targets that still need sampling. To price a project, request a quote or contact us.
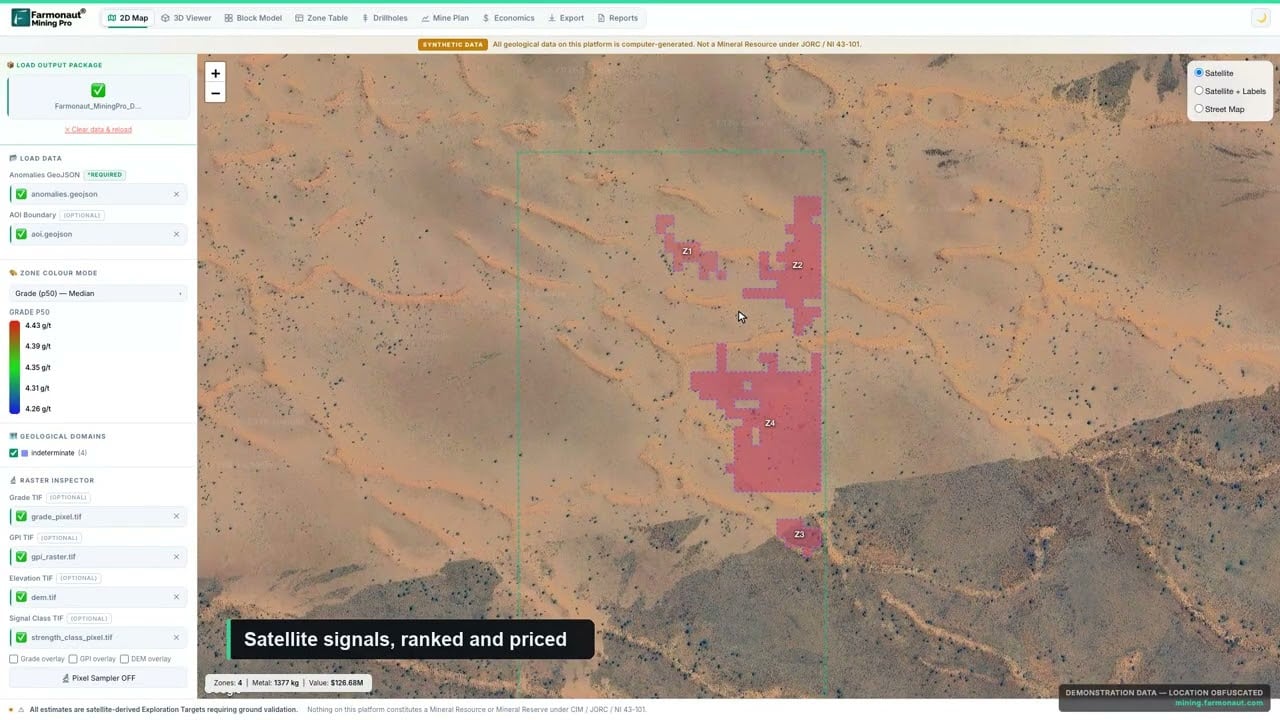
▶ A quick look at Farmonaut Mining Pro, which turns a licence boundary into a geological and economic picture. · 4:56
Frequently asked questions
How much is an ounce of gold worth?
Kitco showed a spot bid of US$4,157.70 per troy ounce at 2:50 p.m. EDT on 15 October 2026. The price changes every few seconds in trading hours.
How much is a gram of gold?
About US$133.67 for pure (24K) gold on the same Kitco quote. Divide the ounce price by 31.1035 to check it.
What is the difference between a troy ounce and a regular ounce?
A troy ounce is 31.1035 grams. A regular ounce is about 28.35 grams (Royal Mint). Gold is always priced in troy ounces.
How many tonnes of ore make one ounce of gold?
Divide 31.1035 by the grade in g/t. At 1 g/t that is about 31 tonnes. At 10 g/t it is about 3 tonnes. Recovery losses raise the figure.
How many ounces of gold are there above ground?
The WGC estimates 222,600 tonnes at the end of June 2026, or about 7.2 billion troy ounces.
What was the highest gold price on record?
The WGC says spot gold momentarily reached US$5,595 per ounce in January 2026. The highest quarterly average was US$4,872.90 in the first quarter of 2026 (LBMA PM).
What is the difference between spot gold and the LBMA price?
Spot is the live market price. The LBMA Gold Price is a benchmark set in auctions twice a day, and reports and contracts often use it.
How much gold does the United States mine?
The USGS estimates 160 tonnes in 2025, mostly from Nevada, which produced about 64% of the total.
Is 14K gold worth much per ounce?
On the 15 October 2026 Kitco quote, an ounce of 14K gold held metal worth about US$2,425. Retail jewellery costs more, and scrap pays less.
What does it cost a miner to produce an ounce?
The global average AISC was US$1,785 per ounce in the first quarter of 2026 (WGC), with wide variation between mines.
This page is for information only. It is not investment advice. Prices are dated and change constantly; check a live quote before any decision.
Farmonaut mining
Map your own licence area from space
Request a quote for satellite mineral detection on your licence area, with results delivered as exploration targets.

Mining Pro sample view, synthetic data
Keep reading
Sources
- Kitco, gold price chart (spot bid, 15 Oct 2026): kitco.com
- Kitco News, Gold, silver rebound as Treasury yields tumble (15 Oct 2026): kitco.com
- World Gold Council, Gold Demand Trends Q2 2026: gold.org
- World Gold Council, Gold Demand Trends Q4 and Full Year 2025: gold.org
- World Gold Council, How much gold has been mined (above-ground stocks): gold.org
- World Gold Council, Record gold prices outpace rising mining costs in Q1’26: gold.org
- Agnico Eagle Mines, Q2 2026 quarterly report (operating statistics): s205.q4cdn.com
- USGS, Mineral Commodity Summaries 2026: Gold: pubs.usgs.gov
- Natural Resources Canada, Gold facts: natural-resources.canada.ca
- Royal Mint, What is a troy ounce?: royalmint.com
- LBMA, Precious metal prices: lbma.org.uk
Discussion
Questions, corrections or field experience? Share them below. First-time comments are reviewed before they appear, and your email is never published.
No comments yet. Be the first to add a question or your experience.

 Faith At Work (Pty) Ltd
 Geotech Mining Solutions plc
 Vulcan International Limited
 Kidepo Associates
 GKY Mining
 Alkimy SARL
 Double A Trading
 GemSprout Metals Limited
 Qader Group
 Ileys General Trading
 SG Gold Mining LLC
 VRV Global Pte Ltd
 Omsri International FZE
 G.I.T.T.
 Jaunita Erss Ltd
 Almosi SARL
 SRK Consulting
 Berks Gold Limited
 Mwerezi Minerals Company Limited
 Mining SARL
 SenGold Invest SAS

 Exploration consultancy · South Africa · Gold










