

Mutual fund · Price and holdings guide
VGPMX Price: NAV, Holdings and Fees From Filings
VGPMX is Vanguard Global Capital Cycles Fund, once the Precious Metals and Mining Fund. Its NAV was US$23.47 on 31 July 2026 (SEC report). Here are its price history, holdings, fees and a cost calculator.
Key takeaways
- VGPMX is Vanguard Global Capital Cycles Fund; the name, benchmark and strategy changed on 26 September 2018 (SEC summary prospectus, May 2026).
- NAV was US$23.47 on 31 July 2026, up from US$22.42 on 31 January 2026; net assets were US$3,739 million across 94 holdings (Vanguard semi-annual report).
- Total return was 75.37% in the fiscal year to 31 January 2026 and 6.00% in the six months after (fund financial highlights).
- Total annual costs were 0.42% in the May 2026 prospectus; the minimum to open an Investor Shares account is generally US$3,000.
- Miners and royalty firms were about 28.3% of net assets by our count of the 31 July 2026 schedule; the rest was other sectors.
In this article
- What VGPMX is and how the fund changed
- How VGPMX is priced each business day
- VGPMX price history from the financial highlights
- What drives the fund's NAV up and down
- VGPMX performance against its index and a world stock index
- VGPMX fees, minimum investment and risks
- VGPMX cost and price-move calculator
- How miners' own numbers connect to the fund price
- How to check the latest NAV and holdings yourself
- Frequently asked questions
VGPMX is the ticker of Vanguard Global Capital Cycles Fund, an actively managed mutual fund that was called Vanguard Precious Metals and Mining Fund until 26 September 2018. Its net asset value (NAV, the per-share price) was US$23.47 on 31 July 2026, according to the fund’s semi-annual report filed with the SEC. It is not a Growth Index fund, and it does not price during the trading day: the NAV is set once per business day. This page gives the filed price history, the holdings behind it, the fees and a cost calculator.
The facts below come from Vanguard’s own filings with the US Securities and Exchange Commission (SEC) and from the World Gold Council and the US Geological Survey (USGS) for the metals side. Every figure carries its date. For today’s NAV, check Vanguard or your broker. Not investment advice.
What VGPMX is and how the fund changed
Per the fund’s summary prospectus dated 28 May 2026, the fund changed its name, performance benchmark and investment strategy effective 26 September 2018. Returns before that date reflect the old precious metals and mining strategy. Returns through 27 July 2018 reflect the previous adviser, M&G Investment Management Limited. The ticker VGPMX stayed the same, and the May 2021 prospectus still carried the footnote “Formerly known as Vanguard Precious Metals and Mining Fund”.
The strategy today is active stock picking. The prospectus says the fund buys companies and industries where capital spending is declining, and avoids assets and business models that are easy to copy. Companies that are hard to copy include those with a low-cost advantage or a differentiated product. It holds U.S. and foreign stocks of all sizes, in developed and emerging markets. After the change, the May 2019 prospectus described the same approach, so the strategy has been stable since the 2018 reset.
Two rules explain why the price still moves with metals. First, the fund is “nondiversified”, which means it may put a larger share of its money in a few issuers than a diversified fund. Second, as a fundamental policy it must keep 25% or more of net assets in companies whose main business is precious metals and mining. The other three-quarters can sit anywhere, which is why the July 2026 holdings include banks, drug makers and water utilities next to the miners.
Wellington Management Company LLP is the investment adviser. The portfolio manager named in the May 2026 prospectus is Keith E. White, who has managed the fund since 2018.
How VGPMX is priced each business day
VGPMX is a mutual fund, not an exchange-traded fund (ETF), so there is no live bid and ask. The SEC’s guide to mutual funds and ETFs explains that funds must price their shares each business day, typically after the major U.S. exchanges close. That price is the NAV: the fund’s assets minus its liabilities, divided by the number of shares. An order placed during the day gets the next NAV that is calculated, so you do not know your price when you place it.
Chart
VGPMX net asset value per share
US$ per share at fiscal year end (31 January) and 31 July 2026
The last NAV in the fund’s filings is US$23.47 per share at 31 July 2026. That day the fund held net assets of US$3,739 million across 94 holdings, with 159,300,564 shares outstanding. The fund’s page on Vanguard’s investor site lists the fund by name and ticker, and a broker quote page shows the latest daily NAV.
The chart below plots the NAV at each fiscal year end. The fund’s fiscal year ends on 31 January, so the points are January values, with the last point at 31 July 2026. The NAV rose from US$13.12 to US$22.42 in the year to 31 January 2026, and a further US$1.05 in the six months after that.
VGPMX price history from the financial highlights
The financial highlights in the July 2026 semi-annual report give one row per fiscal year. Total return includes reinvested dividends, and it does not include account service fees that may apply. The six-month row is not annualized.
| Fiscal year ended 31 January | NAV at start (US$) | NAV at end (US$) | Dividends per share (US$) | Total return | Net assets at end (US$ million) | Expense ratio |
|---|---|---|---|---|---|---|
| 2022 | 9.57 | 11.28 | 0.361 | 21.74% | 1,359 | 0.36% |
| 2023 | 11.28 | 12.43 | 0.376 | 13.81% | 1,520 | 0.43% |
| 2024 | 12.43 | 11.74 | 0.395 | -2.52% | 1,327 | 0.44% |
| 2025 | 11.74 | 13.12 | 0.339 | 14.76% | 1,431 | 0.44% |
| 2026 | 13.12 | 22.42 | 0.530 | 75.37% | 3,586 | 0.42% |
| Six months to 31 July 2026 | 22.42 | 23.47 | 0.265 | 6.00% | 3,739 | 0.40% (annualized) |
Two things stand out. The price was between US$9.57 and US$13.12 across five January readings, then jumped by 71% in one year. And net assets grew from US$1,431 million to US$3,586 million in that same year. The statement of changes in net assets shows US$1,350 million of shares issued against US$430 million redeemed in the year to 31 January 2026, so about US$981 million of the US$2,155 million rise came from net new money and about US$1,175 million from investment results after distributions.
The fund also pays dividends. It distributed US$0.530 per share in the year to 31 January 2026, all from net investment income, and US$0.265 in the latest six months. A dividend lowers the NAV by about the same amount on the payment date, so the NAV alone understates the return. That is why the table shows total return beside the NAV.
What drives the fund’s NAV up and down
Because the NAV is the sum of the holdings, the price follows the stocks the manager owns. At the report date the largest single lines in the schedule of investments were not all miners. The chart below shows the eight largest holdings as a share of net assets, calculated from the market values in the report.
Chart
Eight largest holdings, share of net assets
Per cent of net assets, 31 July 2026; calculated from market values
Pulling the metals and mining lines out of the schedule gives a rough picture. We counted 19 lines that are miners, a platinum-group producer or gold royalty companies: BHP (two lines), Bellevue Gold, Teck Resources, Eldorado Gold, Barrick Mining, Hemlo Mining, Lundin Mining, LunR Royalties, B2Gold, Zijin Mining, AngloGold Ashanti, Valterra Platinum (two lines), Anglo American, Glencore, Rio Tinto (two lines) and Royal Gold. Their combined market value was about US$1,059 million, or 28.3% of net assets. This grouping is ours, not Vanguard’s, and it excludes fertilizer makers such as Nutrien and Mosaic and the steel maker Aperam. It is consistent with the 25% minimum in the fund’s policy.
| Holding (July 2026 report) | Business | Market value (US$ million) | Share of net assets |
|---|---|---|---|
| Anglo American plc | Diversified miner | 163.8 | 4.4% |
| Samsung Electronics Co. Ltd. | Electronics | 127.7 | 3.4% |
| Teck Resources Ltd. Class B | Copper and zinc miner | 127.5 | 3.4% |
| Glencore plc | Diversified miner and trader | 123.2 | 3.3% |
| AngloGold Ashanti plc | Gold miner | 103.1 | 2.8% |
| American Water Works Co. Inc. | Water utility | 100.0 | 2.7% |
| Molina Healthcare Inc. | Health insurer | 95.1 | 2.5% |
| Heineken NV | Brewer | 84.6 | 2.3% |
Shares of the same company can appear on two lines when it trades in two places (for example BHP and its American depositary receipt, or Rio Tinto and its ADR), so the table shows lines as filed, not combined companies. Rio Tinto, for instance, appears twice for a combined US$120.3 million. Holdings change often: portfolio turnover was 33% in the latest six months and 50% in the year to 31 January 2026, according to the report and prospectus.
Metal prices sit behind the miners’ share prices. The World Gold Council reports that the LBMA PM gold price averaged US$4,506.29 per ounce in the second quarter of 2026, 8% below the first-quarter record and 37% above the second quarter of 2025. USGS lists the annual average gold price at US$1,801 per troy ounce in 2021 and an estimated US$3,300 in 2025. For copper, USGS gives an estimated 490 cents per pound for the U.S. producer cathode price in 2025, against 395.3 cents in 2023. These are the kinds of moves that flow through to the earnings of the miners in the portfolio.
Currency and geography matter too. The report shows Europe at 40.4% of net assets, North America at 28.9%, Asia at 17.6%, South America at 5.6%, Africa at 4.0% and Oceania at 2.8%. Many holdings are priced in pounds, euros, Hong Kong dollars or other currencies, so a stronger U.S. dollar lowers the NAV in dollars even if local share prices are flat. The prospectus lists currency risk, emerging-market risk and industry concentration among the principal risks. For a view of how energy names in the same portfolio behave, see our overview of energy and commodity sector trends.
Chart
Portfolio by region
Per cent of net assets, 31 July 2026
VGPMX performance against its index and a world stock index
The May 2026 summary prospectus compares the fund with a spliced index. That index is the S&P Global Custom Metals and Mining Index to 25 September 2018, and the S&P Global BMI Metals & Mining 25% Weighted Index (USD, custom) after that. It also shows the MSCI ACWI Index as a broad world stock benchmark. Returns are for periods ended 31 December 2025, before the tax effects.
Chart
VGPMX against a world stock index
Annual total return, periods ended 31 December 2025, before taxes; five- and ten-year are per year
The fund returned 65.92% over one year, 19.90% a year over five years and 15.06% a year over ten years. The spliced index returned 37.21%, 12.01% and 15.39% over the same periods, and MSCI ACWI returned 22.34%, 11.19% and 11.72%. The fund beat the index over one and five years and trailed it by a third of a percentage point a year over ten. The prospectus warns that past performance does not show future results, and it gives the best and worst calendar quarters on record as +34.84% (30 June 2016) and -25.28% (31 March 2020). That range is the volatility you accept in a concentrated metals fund. The year-to-date return to 31 March 2026 was 7.85%.
VGPMX fees, minimum investment and risks
| Item | Figure | Source and date |
|---|---|---|
| Management fee | 0.40% | Summary prospectus, 28 May 2026 |
| Other expenses | 0.02% | Summary prospectus, 28 May 2026 |
| Total annual operating expenses | 0.42% | Summary prospectus, 28 May 2026 |
| Expense ratio, latest six months | 0.40% (annualized) | Semi-annual report |
| Cost of US$10,000 over 1, 3, 5, 10 years | US$43, US$135, US$235, US$530 | Prospectus example, assumes 5% return a year |
| Sales load, purchase fee, redemption fee | None | Summary prospectus |
| Account service fee | US$25 a year for certain balances below US$5,000,000 | Summary prospectus |
| Minimum to open an Investor Shares account | Generally US$3,000 | Summary prospectus |
The fund pays its adviser a basic fee that is adjusted each quarter by how the fund performed against the Custom Global Capital Cycles Index over the preceding five years. A good run therefore raises the fee and a poor run lowers it. The report explains this in the notes to the financial statements. The prospectus lists the principal risks as general market, foreign markets, emerging markets, currency, equity markets, market cap, active management, nondiversification and industry concentration. The fund is not insured by the FDIC.
VGPMX cost and price-move calculator
The calculator below turns an amount you choose into a number of shares, a year of fund costs and the value after a price move you type in. Use the NAV from your broker or Vanguard for today’s price; the default is the July 2026 figure from the filing. The numbers are examples, not forecasts.
Calculator
What do shares, fees and a price move come to?
Enter your own amount, the NAV and the expense ratio.
- Fund costs in year one (US$): $42
- Fund costs over the years held (US$, flat balance): $210
- Value after the price change (US$): $11,000
Example values only, not a forecast. NAV default is the 31 July 2026 figure from the fund’s report (example, use today’s price); expense ratio default is the May 2026 prospectus total of 0.42%. Costs assume a flat balance and exclude any US$25 account service fee.
How miners’ own numbers connect to the fund price
If you want to judge why the NAV moves, read the reports of the companies it owns. For a gold miner the useful numbers are ounces produced, all-in sustaining cost (AISC, the cost to produce and sustain an ounce) and the realized price. For a copper miner they are tonnes of copper, grade and unit cost. A mine with a higher grade or lower cost keeps more margin when metal prices fall. Our guide to mineral asset valuation explains how analysts turn grade, tonnes and price into a value for a deposit, and our explainer on mining royalties covers the royalty model used by firms such as Royal Gold, which is a holding.
Before a mine reports any of those numbers, exploration has to find the deposit. Early work often uses satellite data to map rock alteration and structures, then ground sampling confirms or rejects the targets. Our pages on copper deposits and where to explore and on gold claims and satellite targets in Alaska show how that stage works. A satellite screen gives an exploration target, not a resource estimate or an investment signal.

▶ Explains how satellites map the rock and alteration around gold rather than the gold itself. · 4:25
How to check the latest NAV and holdings yourself
- Open the fund’s page on Vanguard’s investor site, or your broker’s quote page, and note the NAV and its date.
- Open the latest semi-annual or annual shareholder report on SEC EDGAR (filer CIK 734383, Vanguard Specialized Funds). It lists every holding with its market value, as in the July 2026 report used here.
- Divide each holding’s market value by net assets to get its weight. The report states net assets in thousands of US dollars.
- Read the financial highlights for NAV, dividends, total return and expense ratio by year.
- Read the summary prospectus for fees, the minimum, the benchmark and the risks.
- For the most recent quarter, look at the fund’s Form N-PORT filings, which the report says carry the complete schedule of holdings for the first and third quarters of each fiscal year.
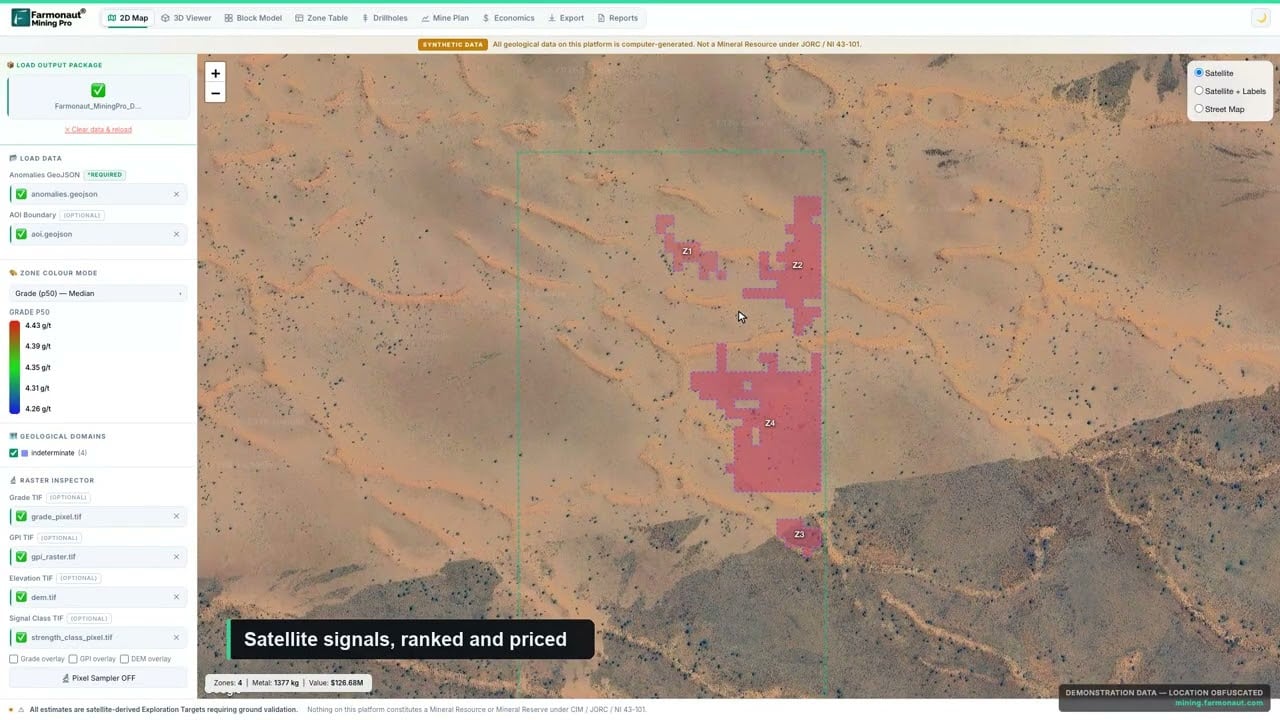
▶ A short look at Farmonaut Mining Pro, which screens a client area of interest for target zones, alteration and structures before field teams deploy. · 4:56
Frequently asked questions
What does VGPMX stand for?
VGPMX is the ticker for Vanguard Global Capital Cycles Fund Investor Shares. The ticker did not change when the fund’s name changed on 26 September 2018 from Vanguard Precious Metals and Mining Fund (SEC summary prospectus, 28 May 2026).
Is VGPMX a Growth Index fund?
No. It is an actively managed global stock fund run by Wellington Management. It must keep at least 25% of net assets in precious metals and mining companies, so it is a concentrated fund, not a broad index fund.
What was the VGPMX price on its latest filing?
The NAV was US$23.47 per share on 31 July 2026, up from US$22.42 on 31 January 2026 (semi-annual report). Check Vanguard or a broker for the current NAV.
Why is the VGPMX price only updated once a day?
It is a mutual fund. Funds must price their shares each business day, typically after U.S. exchanges close, and orders are filled at that next NAV (SEC guide to mutual funds and ETFs).
What is the VGPMX expense ratio?
Total annual operating expenses were 0.42% in the May 2026 prospectus (0.40% management fee plus 0.02% other). The annualized ratio for the latest six months was 0.40%.
What is the minimum investment in VGPMX?
The summary prospectus says the minimum to open an Investor Shares account is generally US$3,000, and US$1 to add to an existing account. Brokers may set their own rules.
Does VGPMX pay a dividend?
Yes. It paid US$0.530 per share in the fiscal year ended 31 January 2026 and US$0.265 in the latest six months, from net investment income. Distributions may be taxable.
What does VGPMX hold?
In the July 2026 report it held 94 positions. Anglo American, Samsung Electronics, Teck Resources, Glencore and AngloGold Ashanti were among the largest. Metals and mining lines were about 28.3% of net assets by our count.
Is VGPMX a gold fund?
Not purely. Gold miners such as AngloGold Ashanti, Eldorado Gold, Barrick Mining and B2Gold are in the portfolio, but so are copper, diversified and platinum-group miners and many non-mining companies.
How did VGPMX perform recently?
Total return was 75.37% in the fiscal year ended 31 January 2026 and 6.00% in the latest six months. For calendar 2025 the one-year return was 65.92%. Past performance does not show future results.
Where can I read the VGPMX holdings list?
In the fund’s shareholder reports and Form N-PORT filings on SEC EDGAR, and on Vanguard’s fund literature page. Our figures use the July 2026 report.
This page is for information only. It is not investment advice. It gives no price targets and no buy or sell view, and it does not consider your goals, tax or risk tolerance. Read the fund’s prospectus and speak to a licensed adviser before you invest.
Farmonaut mining
See an exploration target from space
Investors can see how satellite data screens a licence area for minerals as an exploration target, ahead of a resource estimate.

Mining Pro sample view, synthetic data
Keep reading
Sources
- Vanguard Global Capital Cycles Fund, semi-annual shareholder report (31 July 2026), SEC: sec.gov
- Vanguard Global Capital Cycles Fund, summary prospectus (28 May 2026), SEC: sec.gov
- Vanguard Global Capital Cycles Fund, summary prospectus (28 May 2021), SEC: sec.gov
- Vanguard Global Capital Cycles Fund, summary prospectus (May 2019), SEC: sec.gov
- SEC, Mutual Funds and ETFs: A Guide for Investors: sec.gov
- Vanguard, VGPMX fund profile: investor.vanguard.com
- World Gold Council, Gold Demand Trends: Q2 2026: gold.org
- USGS, Mineral Commodity Summaries 2026: Gold: pubs.usgs.gov
- USGS, Mineral Commodity Summaries 2026: Copper: pubs.usgs.gov
- SEC EDGAR, filings for Vanguard Specialized Funds (CIK 734383): sec.gov
Discussion
Questions, corrections or field experience? Share them below. First-time comments are reviewed before they appear, and your email is never published.
No comments yet. Be the first to add a question or your experience.

 SMA Investments Ltd
 NTS Group (Pty) Ltd
 Mine4Africa
 Lithspo Minerals Limited
 Tintina Mining Group
 Dalgety Minerals Pty Ltd
 Vortex Minerals Pty Ltd
 Faith At Work (Pty) Ltd
 Geotech Mining Solutions plc
 Vulcan International Limited
 Kidepo Associates
 GKY Mining
 Alkimy SARL
 Double A Trading
 GemSprout Metals Limited
 Qader Group
 Ileys General Trading
 SG Gold Mining LLC
 VRV Global Pte Ltd
 Omsri International FZE
 G.I.T.T.
 Jaunita Erss Ltd
 Almosi SARL
 SRK Consulting
 Berks Gold Limited











