

Mining companies · Business model
Evolution Mining Business Model: 7 Parts and Trends
Evolution Mining sells gold and copper from six mines in Australia and Canada at spot prices, uses copper to cut its net gold cost and pays out about 60% of group cash flow. Here is how each part works, with FY26 numbers.
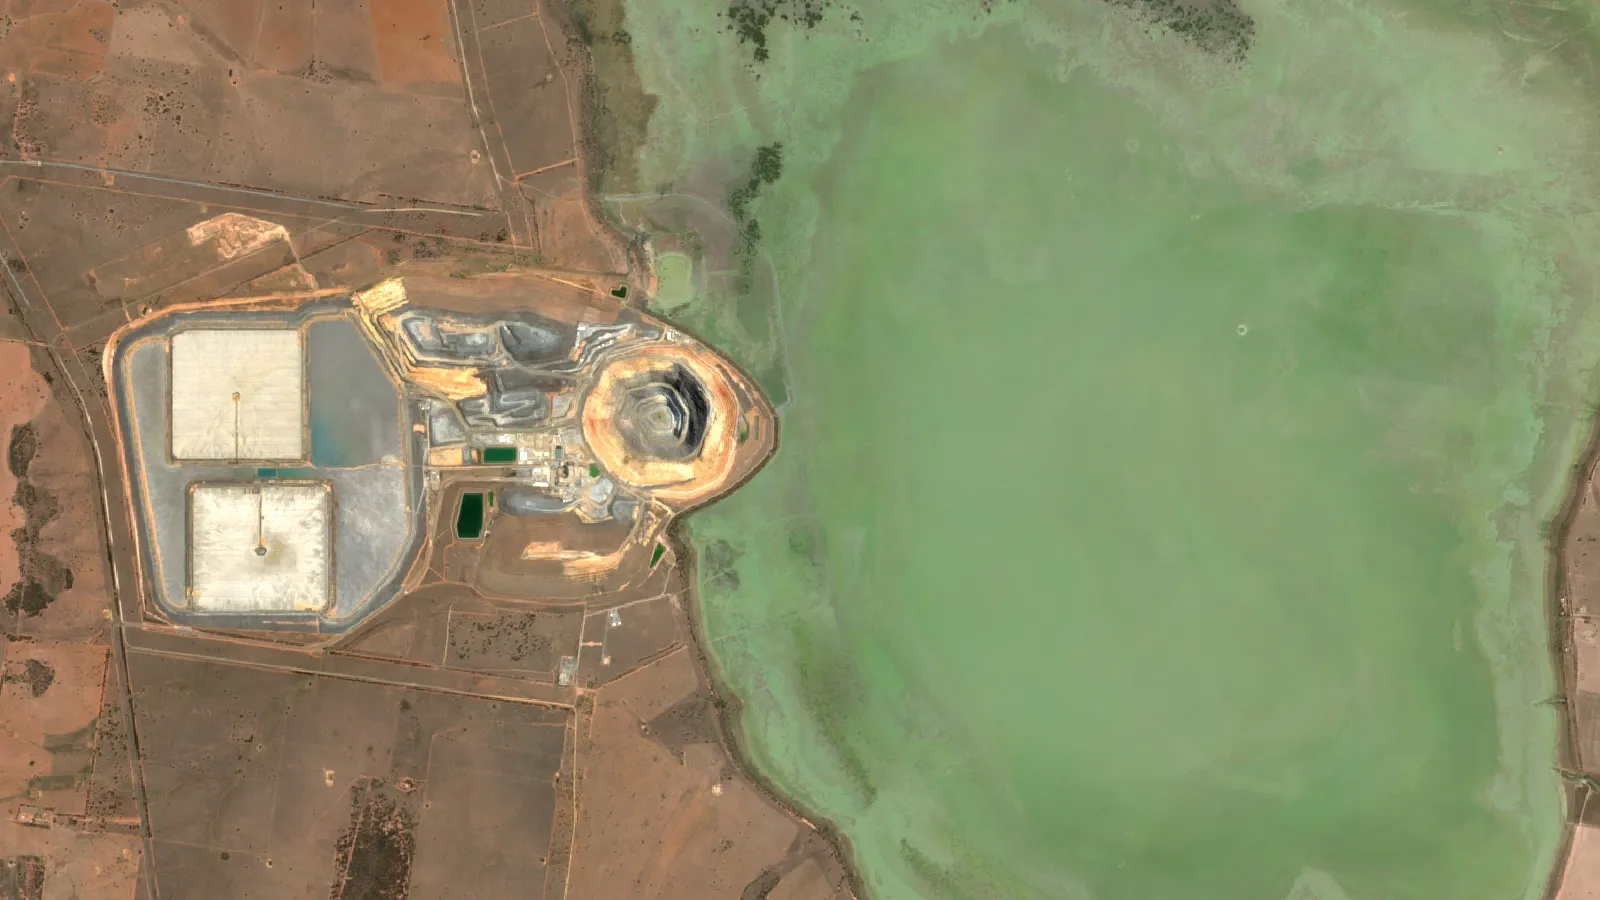
Key takeaways
- FY26 output: 715 koz gold and 66 kt copper at an AISC of A$1,717/oz (Evolution annual report, Aug 2026).
- Revenue rose 28% to A$5.56 billion; copper was about 22% of it.
- Cowal produced A$851.7 million of net mine cash flow, about 41% of the group total.
- Dividend policy now targets about 60% of group cash flow; FY26 dividends were 41.0 cents a share.
- Hedges ended in FY26; FY27 guidance is 660-730 koz gold and 63-70 kt copper.
In this article
- Evolution Mining business model in brief
- The six mines and what each contributes
- Seven parts of the Evolution Mining business model
- How the business model shows in the numbers
- Growth projects and their returns
- Seven mining trends that shape the model
- Risks to the Evolution Mining strategy
- What consultants and licence owners can take from it
- Frequently asked questions
Evolution Mining (ASX: EVN) makes money by mining gold and copper at six owned or part-owned mines in Australia and Canada, selling the metal at spot prices, and using copper sales to cut the net cost of each gold ounce. In the year to 30 June 2026 that model produced 715,000 ounces of gold and 66,000 tonnes of copper, A$5.56 billion of revenue and a record A$1.48 billion net profit, according to its FY26 annual financial report. This guide breaks the strategy into seven working parts, shows which mines carry the cash flow, and lists the trends that could change the picture.
All figures below are in Australian dollars unless marked otherwise, and come from the company’s own ASX filings unless another source is named. Evolution’s financial year runs from 1 July to 30 June, so “FY26” means the year ended 30 June 2026.
Evolution Mining business model in brief
Evolution describes itself as a gold miner operating six mines in Australia and Canada (company website, November 2026). The annual report lists five wholly owned mines (Cowal in New South Wales, Ernest Henry and Mt Rawdon in Queensland, Mungari in Western Australia and Red Lake in Ontario) and an 80% share of Northparkes in New South Wales. Its principal activities are exploration, mine development, mining and the sale of gold and gold-copper concentrate.
The model is simple to state and hard to copy. The company buys or builds long-life mines in stable mining jurisdictions, runs them for cash, and puts the cash into three places: projects that extend mine life, debt reduction, and dividends. Copper is not a side business. In FY26 copper sales were A$1.21 billion, or about 22% of revenue, and that copper income is deducted from gold costs when the company reports its all-in sustaining cost.
For a wider view of how the company sits among its peers, see our list of the top gold and copper mining companies. Readers who want the narrower question of who buys the metal (refiners and smelters, not households) will find it in our companion guide, Is Evolution Mining B2B or B2C?
The six mines and what each contributes
A mining company’s business model is only as good as its mines. Net mine cash flow (operating cash from a mine minus all capital spent on it) shows which assets pay for the rest. In FY26 Cowal alone produced A$851.7 million of net mine cash flow, more than any two other mines combined.
Chart
Net mine cash flow by mine
A$ million, year to 30 June 2026
| Mine | Location | Ownership | Gold, FY26 (oz) | Copper, FY26 (t) | Net mine cash flow, FY26 (A$m) |
|---|---|---|---|---|---|
| Cowal | New South Wales | 100% | 297,029 | – | 851.7 |
| Mungari | Western Australia | 100% | 186,115 | – | 366.5 |
| Ernest Henry | Queensland | 100% | 55,060 | 37,751 | 302.4 |
| Red Lake | Ontario, Canada | 100% | 127,159 | – | 286.1 |
| Northparkes | New South Wales | 80% | 27,299 | 27,885 | 234.5 |
| Mt Rawdon | Queensland | 100% | 22,067 (closing) | – | 38.4 |
Source: Evolution Mining FY26 annual financial report (August 2026). Mine production figures are as reported for each operation.
Three points stand out. First, Cowal is the anchor: the company calls it a world-class operation, and its A$430 million Open Pit Continuation project is meant to keep it running for many more years. Second, Mungari had a turnaround year after its expanded 4.2 million tonne a year mill was commissioned ahead of schedule and below budget (A$212 million against a A$250 million budget), lifting gold output to a record 186,115 oz. Third, Mt Rawdon is ending: processing of its last low-grade stockpiles was expected to stop in the September 2026 quarter, so the group is moving from six to five producing mines.
New South Wales hosts two of the six mines. Our map of gold mines in New South Wales shows where Cowal and Northparkes sit among the state’s other gold districts.
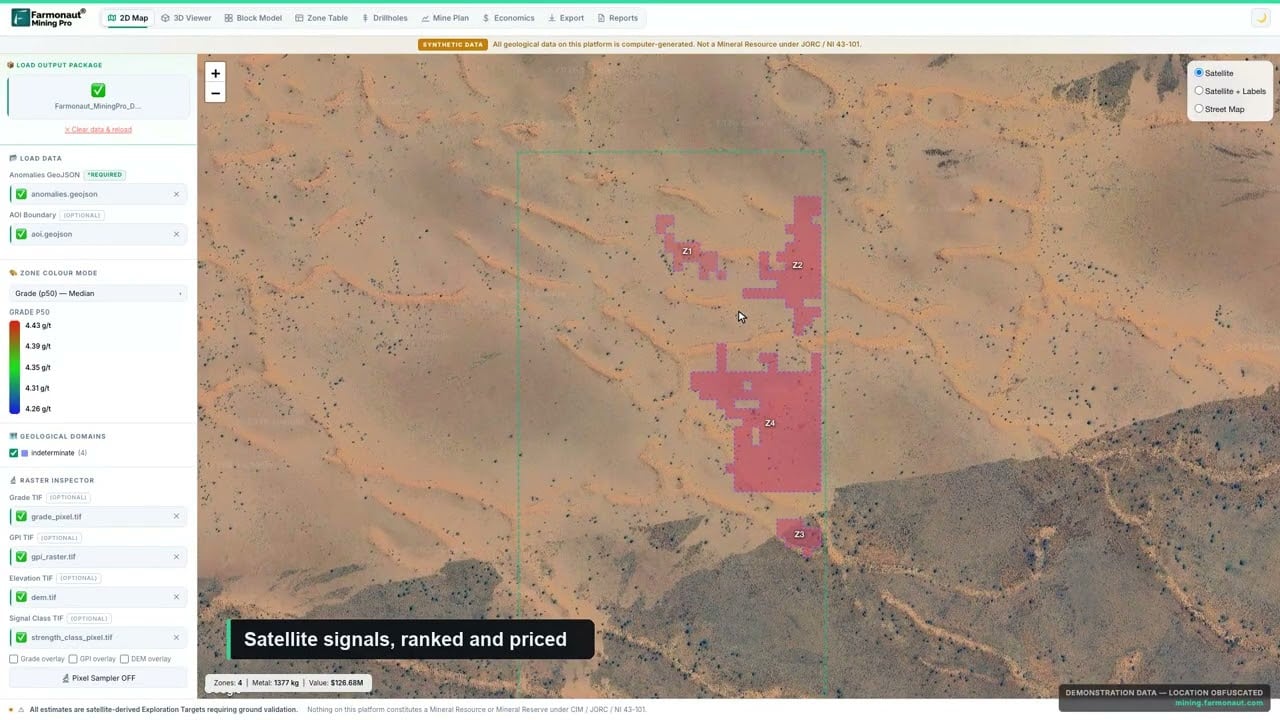
▶ What Farmonaut Mining Pro shows for a licence area, from satellite data to an economic picture. · 4:56
Seven parts of the Evolution Mining business model
The original version of this page talked about broad industry trends. The more useful question for a consultant or investor is how one mid-tier miner turns those trends into cash. Here are the seven parts that show up in Evolution’s filings.
1. Buy proven mines, then improve them
Evolution grew mainly by acquisition and then spent money to lift output or extend life. Red Lake in Ontario produced 127,159 oz in FY26 and a record A$286.1 million net mine cash flow, which the company says equals a 20% payback of the total capital it has invested there. Northparkes, its most recent large purchase, had a record year in FY26. The model depends on paying a fair price for a mine with years of ore left, then cutting cost per ounce through better mills, new ore sources and steady operations.
2. Gold plus copper, not gold alone
Ernest Henry and Northparkes are copper-gold mines. Their copper revenue is used as a “by-product credit”: it is subtracted from the cost of producing gold. That is why both mines report negative all-in sustaining costs per gold ounce in FY26 (Ernest Henry A$(2,975)/oz and Northparkes A$(8,314)/oz). Copper also spreads price risk. When gold and copper prices do not move together, one metal can support the other. The company’s July 2026 move to buy Carnaby Resources, whose Greater Duchess copper-gold project lies near Ernest Henry, adds to this copper side (see part 5).
3. Cost discipline measured by AISC
All-in sustaining cost (AISC) is a cost measure set out by the World Gold Council guidance note on non-GAAP metrics, first issued in 2013. It adds mining and processing costs, royalties, overheads and the capital needed just to keep a mine running, then divides by gold ounces sold. Evolution’s group AISC was A$1,717/oz in FY26 (A$1,572/oz in FY25), against an achieved gold price of A$6,023/oz. The gap between those two numbers is the margin that pays for everything else. FY27 guidance is an AISC of A$1,795 to A$1,995/oz, based on an assumed gold price of A$5,700/oz and copper at A$18,000/t (FY26 results release, August 2026).
4. Selling at spot, with hedges now gone
In FY26 the company sold 659,541 oz of gold at spot prices and delivered the last 50,000 oz into an Australian dollar hedge book at A$3,234/oz, far below the A$6,236/oz average spot price it received in Australia. The annual report states that no further gold or copper hedges are in place. The result is full exposure to metal prices: higher prices flow straight into margin, and lower prices are not cushioned.
5. Reinvest in projects with high returns
Evolution spends a large share of its cash on its own mines rather than on new purchases. The annual report lists five approved projects and their internal rates of return (IRR, the yearly return at which the project’s cash flows break even). At the company’s base-case prices they range from 23% to 77%, above the group’s historical average of 18% since acquiring its operations. It also agreed in July 2026 to acquire Carnaby Resources by scheme of arrangement for about A$213 million in Evolution shares (0.0682 Evolution shares per Carnaby share), according to the ASX deal announcement. Carnaby shareholders approved the scheme on 26 October 2026, with 89.22% of shareholders present and voting, and 95.42% of votes cast, in favour (Carnaby scheme meeting result).
6. Pay out cash to shareholders
The board raised its dividend policy to a target of about 60% of annual group cash flow, up from about 50%. Group cash flow here means cash before dividends, debt repayments, equity raises and acquisitions. FY26 group cash flow was A$1,389.2 million, and total FY26 dividends were 41.0 cents a share (A$832.6 million), the company’s 27th consecutive dividend. The company also moved from net debt to a net cash position during FY26, with A$1,347.5 million in cash at 30 June 2026 and no debt repayments due until FY29.
7. Partners and streams that fund growth
Evolution uses outside capital where it fits. At Northparkes it owns 80% and has a streaming agreement with Triple Flag, a royalty and streaming company listed in Toronto and New York (TFPM). A stream is a deal in which a financier pays money up front in return for the right to buy part of a mine’s metal at a low fixed price. In FY26 Evolution delivered 17,151 oz of gold and 245,776 oz of silver to Triple Flag. The amended agreement includes a A$120 million upfront payment to Evolution due in December 2026 and better terms for developing the gold-rich E44 deposit. Triple Flag reported in October 2026 that the Northparkes mill expansion study is looking at 10 to 11 million tonnes a year, up from about 7.5 million tonnes now (Triple Flag Q3 release).
How the business model shows in the numbers
Revenue rose 28% in FY26 to A$5,558.8 million, while gold ounces sold fell from 748,752 oz to 709,541 oz. Price, not volume, drove the gain: the achieved gold price rose 40% to A$6,023/oz, silver 88% to A$94/oz and copper 25% to A$18,051/t. Gold sales were A$4,311.6 million, copper A$1,209.2 million and silver A$78.9 million.
Chart
Revenue by metal, FY25 to FY26
A$ million, years to 30 June
Underlying EBITDA (earnings before interest, tax, depreciation and amortisation) reached a record A$3,171.3 million, up 44%. Statutory net profit after tax was A$1,475.1 million, up 59%, and basic earnings per share rose to 72.84 cents from 46.49 cents. Net mine cash flow from all operations doubled to A$2,079.5 million.
The lesson for anyone studying the model: in a high-price year a miner with steady costs keeps most of the price gain. Group AISC rose by about 9%, while the gold price rose by 40%. The reverse also holds. If prices fall, the same fixed costs eat into a smaller margin, and an unhedged miner feels it at once. Our guide to mining profitability sets out the margin drivers that apply to any producer.
Growth projects and their returns
The five approved projects show where the company expects its next decade of output to come from. Each IRR below is the company’s own estimate at its base-case prices: A$3,300/oz gold for Cowal OPC, and A$4,000/oz gold and A$14,350/t copper for the others. At its “upside” prices (A$6,500/oz gold, A$18,000/t copper) the returns are much higher.
Chart
Base-case returns of approved projects
Internal rate of return, %, company estimates
- Cowal Open Pit Continuation: base-case IRR 34%. Four new open pits next to the main E42 pit; the first, E46, began mining ore in the June 2026 quarter. Budget A$430 million, on schedule at 30 June 2026.
- Northparkes E48 sub-level cave: base-case IRR 77%. Production started in FY26.
- Northparkes Coarse Particle Flotation: base-case IRR 23%. A processing change meant to lift copper and gold recovery.
- Northparkes E22 block cave: base-case IRR 28%. Approved by the board in February 2026.
- Ernest Henry Bert: base-case IRR 23%. First production scheduled for FY29.
Copper is a theme across this list. Three of the five projects are at Northparkes, and the Carnaby acquisition adds copper-gold ground near Ernest Henry. Copper demand depends on power grids, electric vehicles and construction; the USGS Mineral Commodity Summaries 2026 estimate world mine production of about 23 million tonnes of copper in 2025, with Australia at about 730,000 tonnes. For context on the wider copper sector, see our ranking of the largest copper producers.
Seven mining trends that shape the model
The trends below are the outside forces that push on the seven parts above. Each one is tied to a dated fact, not a forecast.
- Record gold prices: the company’s achieved gold price rose 40% in FY26. High prices favour unhedged producers but raise the cost of buying new mines.
- Copper as a growth metal: three of five approved projects are copper-gold, and copper was 22% of FY26 revenue.
- Brownfield growth over new discoveries: the company’s projects extend existing mines rather than build new ones from scratch, which uses existing mills, roads and permits.
- Cost pressure: the annual report cites higher fuel costs linked to tensions in the Middle East and higher labour costs. FY27 AISC guidance is higher than FY26.
- Climate and weather risk: about 300 mm of rain in 24 hours in late December 2025 suspended underground mining at Ernest Henry, costing about 12,000 oz of gold and 8,000 t of copper in FY26 output and A$45.4 million in recovery work.
- Mine closure and land use: Mt Rawdon is closing, and the Queensland Government decided not to prioritise a proposed pumped hydro project there, according to the annual report.
- Higher payouts: the move from about 50% to about 60% of group cash flow as dividends reflects investor demand for cash returns from miners in a strong price cycle.
Geography matters too. Australia and Canada are among the world’s five largest gold producers. The USGS gold summary for 2026 estimates Australian mine output at 280 tons in 2025, and Natural Resources Canada reports that Ontario and Quebec together produced 68% of Canada’s gold in 2024. Working only in these two countries lowers political risk compared with miners spread across many jurisdictions.
Risks to the Evolution Mining strategy
Every business model has weak points. These are the ones a reader can track in public filings.
- Price risk without hedges: with no gold or copper hedges after FY26, a fall in either price reduces margin at once.
- Concentration in one mine: Cowal produced about 41% of group net mine cash flow in FY26. Any long stoppage there would hit the whole group.
- Project delivery: five large projects run at once. The company reported all on budget and schedule at 30 June 2026; that needs checking each quarter.
- Weather and water: the Ernest Henry flood shows how one event can take a large mine offline for a quarter.
- Stream obligations: the Triple Flag stream means part of Northparkes metal is sold below spot; the cost of that obligation was A$134.1 million in FY26.
- Rising costs: FY27 AISC guidance of A$1,795 to A$1,995/oz is above the FY26 result.
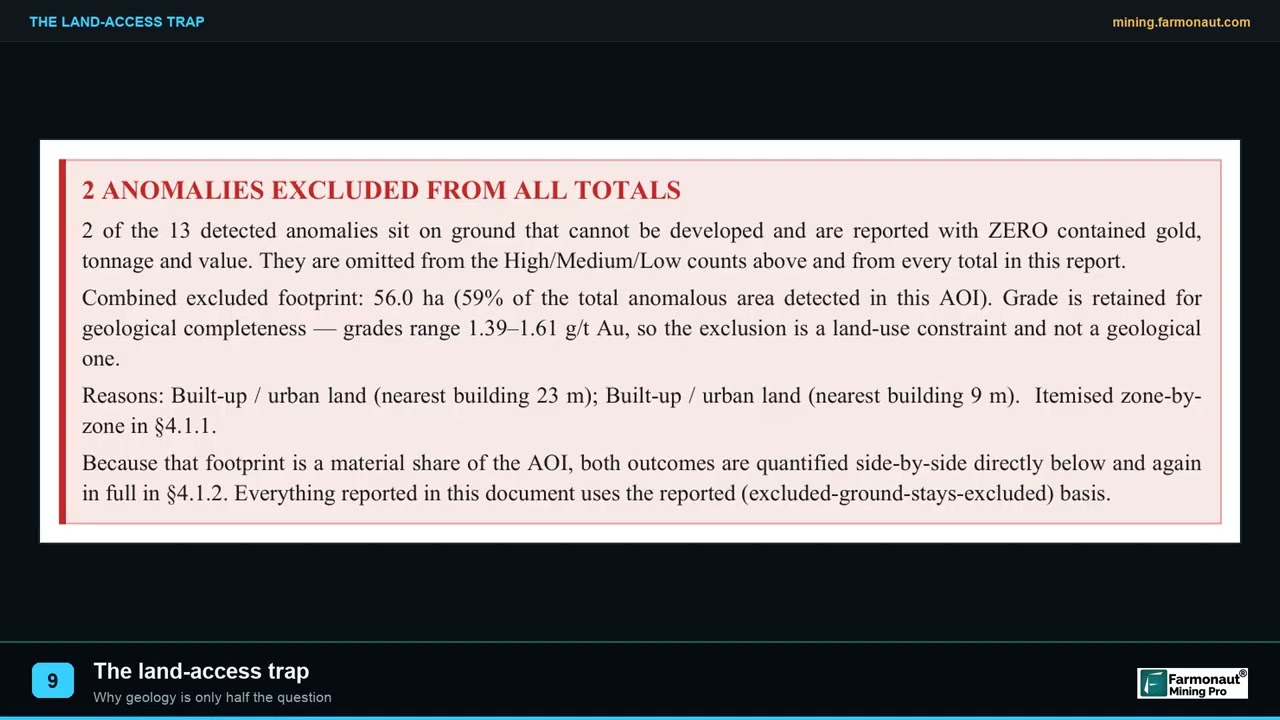
▶ Why good rock can still be unmineable: the land access trap. · 2:05
What consultants and licence owners can take from it
Most readers of this page do not run a six-mine group, but the same logic applies to a single licence. A buyer like Evolution looks for ground with long life, a nearby mill or the space for one, by-product metals that lower cost per ounce, and a jurisdiction where permits move. If you own or advise on a licence, three checks follow from the model:
▶ What an AI mining app does across exploration, planning and operations. · 3:52
- Know your margin, not just your grade. A deposit’s value depends on cost per ounce against price. Use the calculator on this page to see how a by-product metal changes the picture.
- Map the whole tenement before talking to buyers. Buyers pay for evidence. Satellite mapping of alteration and structure can show where a licence has targets before any drilling. Our satellite-based mineral detection service produces exploration targets of this kind; they sit ahead of any resource estimate and are not a JORC or NI 43-101 result.
- Think about who could build on your ground. Evolution’s Carnaby deal targets ground close to an existing mine. Licences near operating mills often attract more interest than isolated ones.
To discuss a mapping project for a specific licence, use our mining query form or contact us.
Calculator
How much does copper cut the cost of each gold ounce?
Enter your own mine’s output and prices to see the copper credit per gold ounce.
- Copper revenue (A$): $1,170,000,000
- Net cost after credit (A$/oz): 1,829
- Margin per gold ounce (A$): 4,171
- Copper share of revenue (%): 21.8
Example values only, not a benchmark. Defaults are rounded from Evolution’s FY26 output (annual report, August 2026). Prices are inputs: example, use today’s price.
Frequently asked questions
What is Evolution Mining’s business model?
Evolution Mining mines gold and copper at six mines in Australia and Canada, sells the metal at spot prices, uses copper revenue to lower its net gold cost, reinvests in mine-life projects and pays about 60% of annual group cash flow as dividends.
How does Evolution Mining make money?
Mainly from gold sales. In FY26 gold brought in A$4,311.6 million, copper A$1,209.2 million and silver A$78.9 million, for total revenue of A$5,558.8 million.
Which is Evolution Mining’s most important mine?
Cowal in New South Wales. It produced 297,029 oz of gold and A$851.7 million of net mine cash flow in FY26, the most in the group.
Is Evolution Mining a gold or copper company?
It calls itself a gold miner, and gold was about 78% of FY26 revenue. Copper from Ernest Henry and Northparkes made up about 22% of FY26 revenue and is growing through new projects.
What is Evolution Mining’s all-in sustaining cost?
Group AISC was A$1,717 per ounce in FY26. FY27 guidance is A$1,795 to A$1,995 per ounce, based on A$5,700/oz gold and A$18,000/t copper.
Does Evolution Mining hedge its gold?
Not any more. The last 50,000 oz were delivered into the hedge book in FY26, and the company states it has no further gold or copper hedges.
What is Evolution Mining’s dividend policy?
The board targets a payout of about 60% of annual group cash flow, up from about 50%. Total FY26 dividends were 41.0 cents per share.
Where is Evolution Mining listed?
On the Australian Securities Exchange under the ticker EVN.
What is the Carnaby Resources acquisition?
A scheme of arrangement announced on 27 July 2026 to buy Carnaby, whose Greater Duchess copper-gold project lies in the Cloncurry region near Ernest Henry, for about A$213 million in Evolution shares. Carnaby shareholders approved it on 26 October 2026.
What is Evolution Mining’s production guidance?
For FY27 (year to 30 June 2027) the company guides 660,000 to 730,000 oz of gold and 63,000 to 70,000 t of copper.
This page is for information only. It is not investment advice.
Farmonaut mining
Map your own project area from space
Consultants can map alteration and structure across a client's licence from satellite data before planning field work.

Mining Pro sample view, synthetic data
Keep reading
Sources
- Evolution Mining, Annual Financial Report for the year ended 30 June 2026 (ASX, August 2026): announcements.asx.com.au
- Evolution Mining, FY26 full year results and FY27 guidance (ASX, 19 August 2026): announcements.asx.com.au
- Evolution Mining and Carnaby Resources, scheme implementation announcement (ASX, 27 July 2026): announcements.asx.com.au
- Carnaby Resources, results of scheme meeting (ASX, 26 October 2026): announcements.asx.com.au
- Evolution Mining, corporate website: evolutionmining.com.au
- World Gold Council, Guidance note on non-GAAP metrics: AISC and AIC: gold.org
- Triple Flag, Q3 2026 revenue release (October 2026): bnnbloomberg.ca
- USGS, Mineral Commodity Summaries 2026: Gold: pubs.usgs.gov
- USGS, Mineral Commodity Summaries 2026: Copper: pubs.usgs.gov
- Natural Resources Canada, Gold facts: natural-resources.canada.ca
Discussion
Questions, corrections or field experience? Share them below. First-time comments are reviewed before they appear, and your email is never published.
No comments yet. Be the first to add a question or your experience.

 GKY Mining
 Alkimy SARL
 Double A Trading
 GemSprout Metals Limited
 Qader Group
 Ileys General Trading
 SG Gold Mining LLC
 VRV Global Pte Ltd
 Omsri International FZE
 G.I.T.T.
 Jaunita Erss Ltd
 Almosi SARL
 SRK Consulting
 Berks Gold Limited
 Mwerezi Minerals Company Limited
 Mining SARL
 SenGold Invest SAS
 Sean Mining Limited
 NTS Group (Pty) Ltd

 Client · Oregon, USA · Gold










