

Digital Transformation in Agriculture: The Carbon Math
Reviewed August 2026 against USDA’s Economic Research Service and Government Accountability Office data, EPA’s Inventory of U.S. Greenhouse Gas Emissions and Sinks, and peer-reviewed agronomy research cited throughout.
Try it: Run your own numbers →
Digital transformation in agriculture means replacing calendar-based, blanket-rate farm decisions with sensor, satellite and software-driven ones — and it is already measurable: 27% of U.S. farms and ranches used at least one precision-agriculture practice between June 2022 and June 2023, according to USDA data cited by the U.S. Government Accountability Office. Zero-carbon (or carbon-zero) farming is the sustainability half of that same shift: using the data these tools generate to cut fertilizer-driven nitrous oxide, build soil carbon, and get paid for both. Below is the actual adoption data, the emissions math, what carbon programs pay per acre right now, and a calculator to run your own numbers.
What “Digital Transformation in Agriculture” Actually Means in 2026
Strip away the buzzwords and digital transformation in agriculture — whether you search it as “agriculture digital transformation,” “digital transformation agriculture,” or “digital transformation of agriculture,” Google treats these as the same intent — comes down to three layers working together: sensors and satellites that collect field-level data, algorithms that turn that data into a recommendation, and an interface a farmer or agronomist actually uses before the next input pass. The GAO’s January 2024 assessment found USDA and the National Science Foundation put almost $200 million into precision-agriculture research and development between fiscal years 2017 and 2021, and adoption has followed the money unevenly — it climbs sharply with farm size and stays lowest on operations with under $350,000 in gross cash farm income.
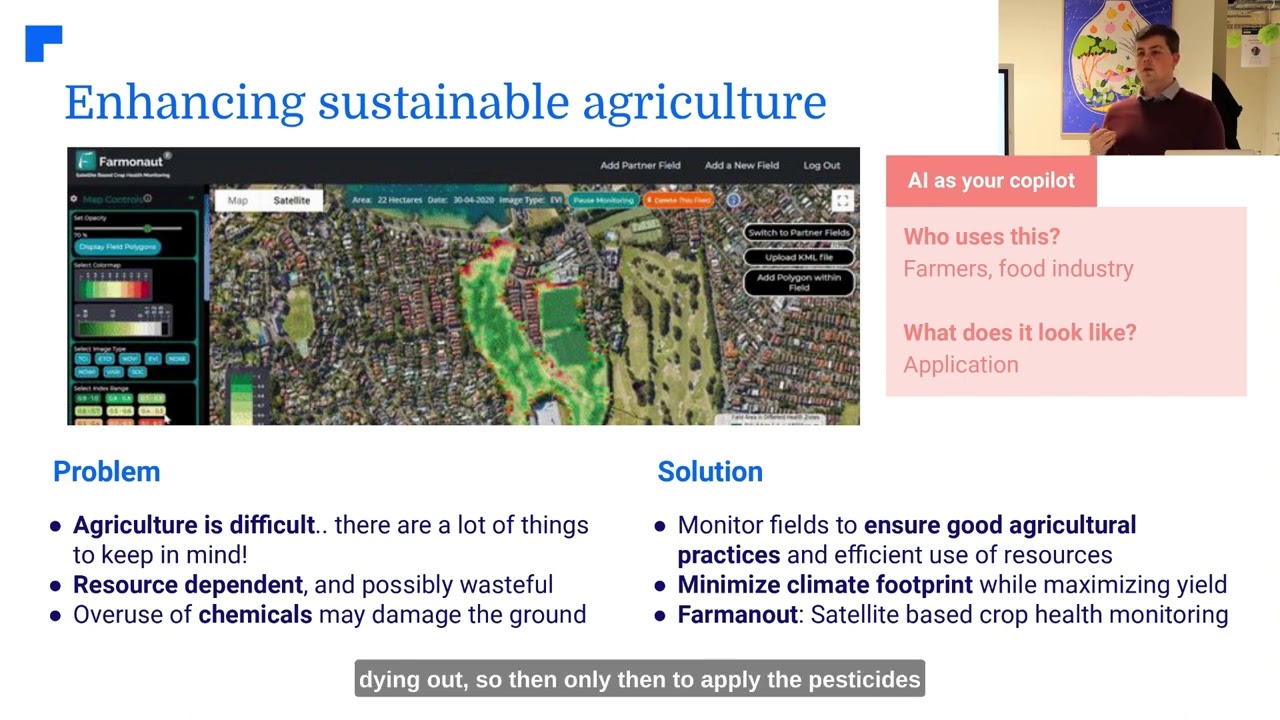
At Farmonaut, this layered approach is what our satellite-based crop monitoring and Jeevn AI Advisory System are built around: pull multispectral imagery and weather data, run it through models tuned to a specific field and crop, and hand the farmer one recommendation instead of a spreadsheet. The same principle underpins the broader shift toward data-driven digital agriculture, and it shows up in market terms too — agricultural data analytics adoption trends track the same farm-size skew the GAO documented nationally.

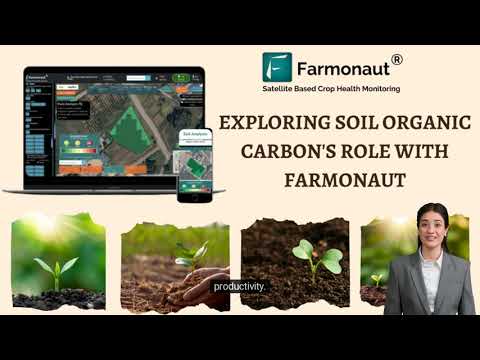
Data-Driven Algorithms: Unlocking Plant Trait Insights
This is the research question behind the tools: can an algorithm read a plant’s traits — canopy height, leaf area, nitrogen content — from imagery alone, at a scale no field crew could match? A Scientific Reports study published in August 2021 built convolutional neural network models on the TRY plant trait database (more than 11 million trait measurements across over 270,000 taxa) linked to roughly 185,000 independent citizen-science photographs, then tested how well the models predicted six traits from images alone. Results varied sharply by trait: canopy height reached an R² of 0.58 and leaf area 0.45 — moderate but real predictive power — while leaf nitrogen concentration and stem-specific density were harder to pin down (R² of 0.16 and 0.20), a reminder that plant-trait algorithms are strongest on structural traits and weakest on biochemical ones (Schiller et al., Scientific Reports).
Satellite-based platforms apply the same logic at field scale rather than per-leaf: spectral bands stand in for the biochemical signal, and vegetation indices approximate the structural and pigment traits those photographs captured. Farmonaut’s own satellite imagery and AI analytics API and the underlying satellite and weather developer documentation run on that same trait-from-signal principle — tracking canopy vigor and biomass proxies across a field the way the CNN models tracked height and leaf area across a photo library, so a change in soil organic carbon or crop stress shows up as a data point rather than a guess.
Zero-Carbon Farming: What the Emissions Math Actually Says
Agriculture generated 9.4% of total U.S. greenhouse gas emissions in 2022, or 11% once indirect land-use effects are included, per the EPA’s agriculture sector emissions data. Within that slice, the composition matters more than the headline number: agricultural soil management — fertilizer-driven nitrous oxide, mainly — accounts for just over half of it; livestock enteric fermentation (methane from digestion) makes up over a quarter; manure management adds about 14%; and rice cultivation, liming, urea application and residue burning split the remainder. That breakdown is the actual target list for “zero carbon farming” and “carbon zero farming” — cutting agriculture’s emissions means going after fertilizer nitrogen and livestock methane specifically, not agriculture in the abstract.
This is the ground the climate-smart farming practices that make up the objectives of climate-smart agriculture are built to cover — productivity, resilience and emissions reduction addressed together rather than traded off against each other.
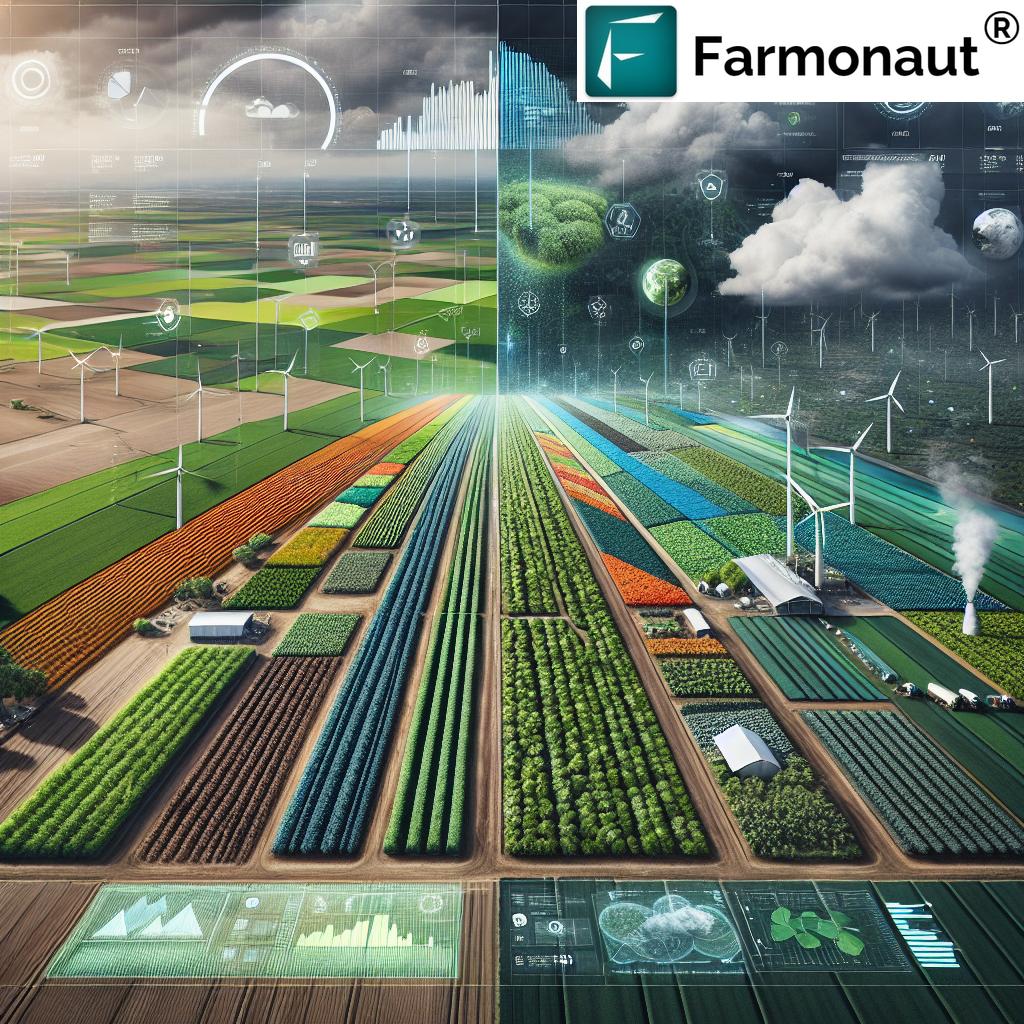
How Does Precision Agriculture Reduce Carbon Footprint?
Directly, and mostly through nitrogen. Since agricultural soil management is the single largest source inside agriculture’s emissions, precision nitrogen management is the highest-leverage lever a farm controls. A peer-reviewed field trial on maize cropping cited in a 2022 nitrogen-management study found that adding a nitrification inhibitor (nitrapyrin) to urea cut nitrous oxide emissions by 88.6% at a 69 kg N/ha application rate and 88.4% at 115 kg N/ha, dropping to 69% at the highest rate tested (161 kg N/ha) — and cut yield-scaled N2O emissions (per unit of harvested grain) by roughly 85% on average, while grain yield rose 18.4% to 31% across the three nitrogen rates (peer-reviewed nitrogen-management field trial). The mechanism generalizes even where the exact percentage will not: matching nitrogen rate, timing and placement to what the crop and soil actually need — rather than a blanket calendar application — shrinks the biggest slice of agriculture’s carbon footprint because it shrinks the biggest source inside it.
The same logic extends to tillage and residue management. No-till farming, biochar application, and the broader practice set covered in conservation agriculture and climate change all work on the soil-carbon side of the ledger rather than the fertilizer-emissions side — which is why a full carbon-footprint strategy on a working farm combines both: precision nitrogen to cut N2O at the source, and conservation tillage or biochar to pull carbon into the soil at the same time.
Turning Soil Into a Carbon Asset: Sequestration and What It Actually Pays
Soil carbon sequestration has a real, published ceiling and a real cost curve, not an open-ended promise. A peer-reviewed analysis of national no-till conversion potential modeled the 124.7 million hectares (about 308 million acres) of U.S. cropland not yet under no-till and found it could sequester 38.2 million metric tons of carbon per year (140.1 million metric tons of CO2) if sustained for 20 years — 2,803 million metric tons of CO2 in total — with marginal costs ranging from $6.36 to $589.33 per metric ton of CO2 depending on the hectare. About 95% of that 20-year total (2,660 million metric tons of CO2) is achievable at carbon prices under $100 per metric ton, and 64% to 93% is achievable within the $36.36-to-$86.06-per-ton range used for geologic carbon storage cost comparisons (soil organic carbon cost-potential study, PMC).
What a program actually pays an enrolled farm is a separate figure from the sequestration science, and it is set by contract terms, not by tonnage alone. A New Mexico State University Extension guide to agricultural carbon-credit markets documents cover-crop program payments of $6 to $55 per acre per year, no-till payments of $5 to $25 per acre per year, and generic voluntary soil-carbon offsets priced at $10 to $35 per metric ton of CO2-equivalent, with nitrogen-reduction credits starting at a minimum of $18 per metric ton. On the compliance side — not voluntary offsets but regulated cap-and-trade — the Regional Greenhouse Gas Initiative priced carbon at $20.03 per metric ton of CO2 and California’s cap-and-trade program at $36.14 per ton, both as of June 2024 (NMSU Extension Guide Z-125). Compliance-market prices move with each auction, so check the same NMSU guide or your program administrator for the current print before signing a contract.
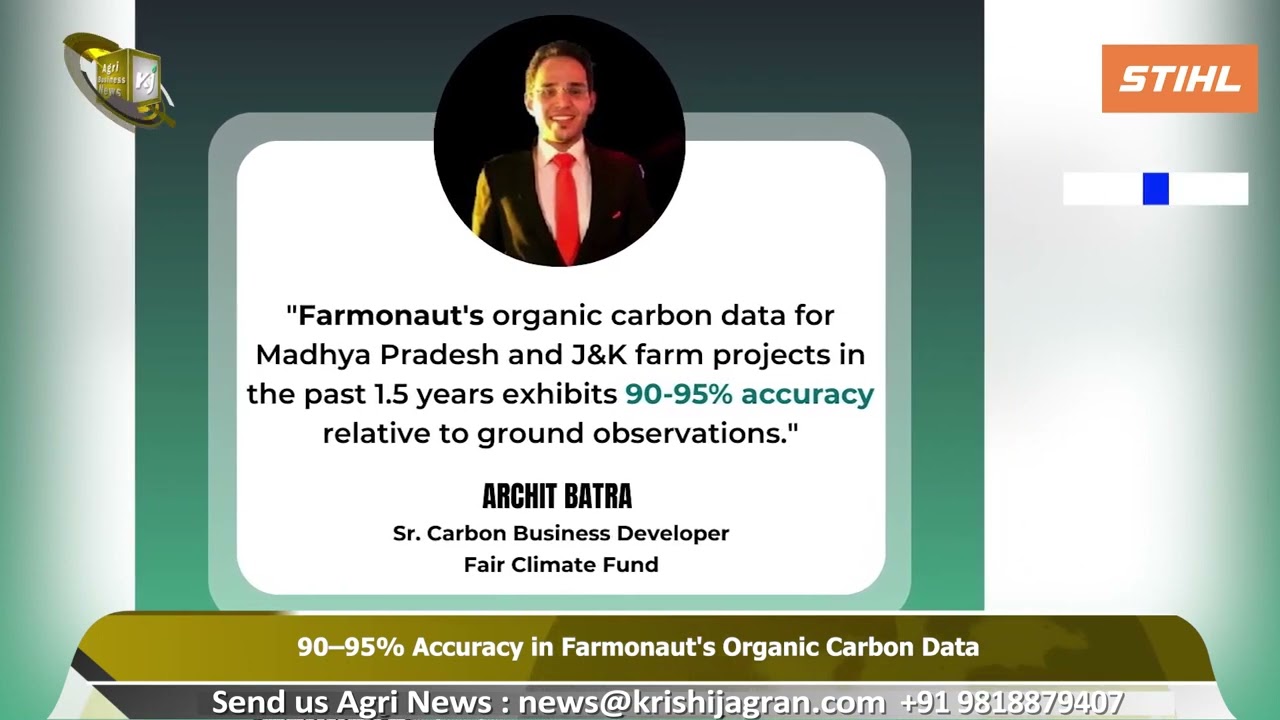
Farmonaut’s satellite carbon and soil-monitoring tools track the organic-carbon and biomass signals these programs verify against, and our writeup on verified U.S. carbon-credit impact covers how that monitoring translates into an actual enrollment.
Sustainability Tracking for Digital Farming and Land Management
Digital transformation in land management is the part of this shift that happens above the field level: tracking soil condition, land-use change and carbon stock across a whole operation or a portfolio of leased ground, not just one crop cycle. That is a distinct use case from single-season yield optimization, and it is where sustainability reporting for digital farming operations actually lives — a fertilizer-buying decision needs a real-time recommendation, but a carbon-program enrollment or a corporate sustainability disclosure needs a defensible time series. Farmonaut’s carbon footprint tracking features are built for that second job: continuous satellite monitoring an agribusiness can hand to an auditor or a program verifier rather than a one-off soil test, feeding the same AI-driven recommendation loop that supports day-to-day input decisions.
Digital vs. Conventional: The Sourced Comparison
Every figure below traces back to a cited source above — no estimated ranges, no invented deltas.
| Digital or climate-smart shift | What changes | Documented result | Source |
|---|---|---|---|
| Blanket urea → inhibitor-treated or rate-matched nitrogen | Fixed calendar application → matched to crop demand | N2O cut 69%-88.6%; yield-scaled N2O cut ~85%; yield up 18.4%-31% | Peer-reviewed field trial (PMC9626639) |
| Conventional tillage → no-till, national scale | 124.7M hectares of remaining U.S. cropland converted | Up to 140.1M metric tons CO2/year for 20 years; $6.36-$589.33/ton marginal cost | Soil carbon cost-potential study (PMC7719247) |
| Manual steering → GPS autosteer guidance | Adoption by farm size, 2023 | 52% of midsize farms; 70% of large-scale crop farms | USDA ERS Chart of Note 110550 |
| No precision tools → any precision-ag practice | National adoption, 2022-2023 | 27% of all U.S. farms and ranches | GAO-24-105962 |
| Unenrolled acres → cover-crop or no-till carbon program | Per-acre annual payment | Cover crops $6-$55/acre/yr; no-till $5-$25/acre/yr | NMSU Extension Guide Z-125 |
| No carbon market participation → compliance market sale | Price per metric ton CO2, June 2024 | $20.03 (RGGI) to $36.14 (California cap-and-trade) | NMSU Extension Guide Z-125 |
Estimate Your Own Fertilizer Savings and Carbon-Program Income
Plug in your own acreage, nitrogen rate and program terms to see where you land — the math below is exactly the arithmetic behind the figures cited above, with every input in your control.
Run your own numbers
Assumptions and exclusions: assumes a uniform nitrogen-rate cut and program payment across every acre entered, with no deduction for equipment, soil testing, verification or enrollment fees. The cited ranges above ($5-$55/acre for cover-crop and no-till programs; 69%-88.6% N2O cuts from inhibitor trials) are starting points to test, not a guarantee for your soil type or program contract.
The Real Barriers to Adoption
The GAO’s assessment names the same barriers most operations report: upfront equipment cost, data-ownership and data-sharing concerns, and a lack of interoperability standards between different vendors’ hardware and software. None of these is solved by a single tool — they are solved by starting with the highest-leverage practice for a given operation’s soil and crop, whether that is variable-rate nitrogen, no-till conversion, or simply enrolling already-eligible acres in an existing cover-crop program, and building outward from measurable results rather than adopting every available layer at once.

Where Farmonaut Fits
Farmonaut’s platform is built on the same layers this article has walked through: satellite imagery and AI analytics for the plant-trait and soil-carbon signal, the Jeevn AI Advisory System for turning that signal into a field-level recommendation, and carbon footprint tracking for the reporting a program or buyer will actually ask to see. None of it requires the equipment investment the GAO flags as the top adoption barrier — it runs from imagery already being collected, on a phone or browser.
Explore the platform:



Frequently Asked Questions
- What does digital transformation in agriculture look like on an actual U.S. farm?
Concretely: 27% of U.S. farms and ranches used a precision-ag practice in the 2022-2023 USDA reporting period, rising to 52%-70% for GPS autosteer guidance on midsize and large-scale crop farms and 68% for yield monitors and maps on large-scale operations (GAO-24-105962; USDA ERS Chart of Note 110550). - How does precision agriculture reduce carbon footprint, specifically?
Mainly by cutting nitrous oxide from fertilizer, which is the largest single source inside agriculture’s emissions (just over half, per EPA). A peer-reviewed nitrogen-management trial found N2O cuts of 69%-88.6% from matching nitrogen rate to crop need instead of blanket application. - Is “carbon zero farming” the same as “carbon neutral”?
In practice the terms get used interchangeably, but zero-carbon farming as covered here refers to the combined strategy of cutting soil and livestock emissions at the source (nitrogen management, feed and manure practices) while building soil carbon through no-till and biochar — a net accounting exercise, not a single certification. - What do carbon-smart practices actually pay per acre?
Per NMSU Extension Guide Z-125: cover-crop programs pay $6-$55 per acre per year, no-till programs pay $5-$25 per acre per year, and generic voluntary soil-carbon offsets trade at $10-$35 per metric ton of CO2-equivalent. Compliance markets (RGGI, California cap-and-trade) priced carbon at $20.03-$36.14 per ton as of June 2024 — check the same guide for the current print before enrolling. - Where do plant-trait algorithms fit into this?
They are the research layer under satellite-based crop monitoring: CNN models trained on the TRY trait database and citizen-science imagery predict structural plant traits like canopy height (R²=0.58) and leaf area (R²=0.45) from images, the same principle satellite platforms apply across a field using spectral bands instead of photographs. - What does Farmonaut provide toward this transition?
Satellite-based crop and soil monitoring, an AI-driven advisory system (Jeevn AI), a developer-facing satellite and weather API, and carbon footprint tracking built to support carbon-program enrollment and sustainability reporting.

 Mera Farmhouse
 GalaxEye Space
 Sun Palm Australia
 Grandstream Algérie
 XOS Realty
 Geospatial Lab Africa
 Agro La Gándara
 HIPSAC
 ZOL Zimbabwe
 Juligerm
 AdBio
AdBio MISE Maroc
 NWNS
NWNS Red August Group
 Farm Inc
 WeMe Global
 Agrotoken
 Blue BearX
 Insignito
 DnCubed
