

Grain marketing · Futures basics
How to Trade Wheat Futures: Specs, Margin and Hedging
A plain guide to wheat futures for farmers: which contract fits your wheat class, how margin and margin calls work, and how a short hedge protects a crop price. Figures are dated October 2026 from USDA, the CFTC and the World Bank. Education only, not investment advice.
Key takeaways
- The CBOT Chicago SRW wheat contract covers 5,000 bushels; each quarter-cent tick is $12.50 and a 10-cent move is $500 per contract (CME Group specs).
- Margin is a daily-settled deposit, not a down payment; losses can exceed it, and the CFTC warns many individual speculators lose all their money.
- Farmers mostly use futures to hedge: a short hedge locks in the futures level, but basis and yield risk remain.
- USDA’s October 2026 WASDE puts 2026/27 US wheat output at 1,534 million bushels, the smallest since 1970, with SRW at 294 million bushels.
- Get advice from a licensed broker or farm marketing adviser before trading; this page is education only.
In this article
- What wheat futures are
- Which wheat futures contract to trade
- CBOT wheat contract specs explained
- How margin works on a wheat futures trade
- How to trade wheat futures in 7 steps
- How farmers hedge wheat with futures
- Wheat futures hedge calculator
- What moves wheat prices
- Soft red winter wheat supply and prices
- Common wheat trading approaches and their risks
- Risk note and professional advice
- FAQ
To trade wheat futures you open an account with a registered futures broker, post the initial margin the exchange and broker require, and buy or sell contracts such as the CBOT Chicago SRW wheat contract, which covers 5,000 bushels and moves $12.50 for each quarter-cent change. Farmers who grow wheat mostly use futures to hedge: they sell contracts before harvest to lock in a price level, then buy them back when they sell the grain. This guide explains how to trade wheat futures step by step, with dated USDA numbers, a hedge calculator and a plain risk note.
It is education, not investment advice. The CFTC’s basics of futures trading warns that speculating in futures is volatile and risky, that many individuals lose all of their money, and that traders can owe more than they put in. Talk to a licensed broker, your farm accountant or a marketing adviser before you place any trade.
What wheat futures are
A futures contract is an agreement to buy or sell a set amount of a commodity at a future date, at a price fixed today. The CFTC notes that most contracts are closed out before the delivery date, so few traders ever deliver or receive grain. Instead, they take a gain or loss on the price change.
Two groups use the market. Hedgers, such as farmers, grain elevators and flour mills, use futures to cut the risk of price moves in grain they own or need. Speculators try to profit from price changes and carry the risk that hedgers pass on. The CFTC says most participants are commercial hedgers. Its futures glossary defines terms such as margin, basis, open interest and mark-to-market that you will meet in every broker statement.
Wheat is one of the main agricultural commodities traded on exchanges, along with corn and soybeans. Prices also respond to farm and trade rules, which our guide to agricultural policy covers in more depth.
Which wheat futures contract to trade
US wheat comes in five classes, and each has its own market. The USDA Economic Research Service, in its Wheat Sector at a Glance page, says Hard Red Winter (HRW) wheat makes up about 40% of US output and grows mainly in the Great Plains. Soft Red Winter (SRW) wheat makes up about 15–20% and grows mainly along the Mississippi River and in the East. SRW flour goes into cakes, cookies and crackers.
Chart
US wheat production by class, 2025/26
Million bushels, marketing year beginning June 1 (USDA estimate)
The class you grow decides which contract tracks your local price best. The table lists the main contracts. Check the exchange’s own page for current details, as specs and trading hours can change.
| Contract | Exchange | Size | Best for |
|---|---|---|---|
| Chicago SRW wheat | CBOT (CME Group) | 5,000 bushels | SRW growers in the Midwest and East; most traded US wheat contract |
| KC HRW wheat | CBOT (CME Group) | 5,000 bushels | HRW growers in Kansas, Oklahoma, Texas and Nebraska |
| Mini-sized wheat | CBOT (CME Group) | 1,000 bushels | Small hedges or learning with smaller size |
| Hard red spring wheat | MIAX Futures (Minneapolis) | 5,000 bushels | Northern Plains spring wheat growers |
| Milling wheat | Euronext Paris | 50 tonnes | EU and UK growers and buyers |
For readers in Europe, the Euronext milling wheat contract is the main benchmark. Australian and Canadian growers often hedge with Chicago or Kansas City contracts, then manage the gap to their local price, which is called basis.
▶ A short look at UK and European wheat market prices and the crop trends behind them. · 1:46
CBOT wheat contract specs explained
The CME Group contract specifications for Chicago SRW wheat set the rules every trader works with. Here is what each term means in practice.
- Size: one contract is 5,000 bushels, about 136 metric tons.
- Price quote: cents per bushel. A quote of 540 means $5.40 per bushel.
- Tick: the smallest move is a quarter of a cent per bushel, which is $12.50 per contract.
- Value of a 10-cent move: $500 per contract (10 cents × 5,000 bushels).
- Contract months: March, May, July, September and December. Ticker codes use H, K, N, U and Z.
- Delivery grade: No. 2 Soft Red Winter at the contract price; the exchange rulebook lists the other grades and classes that can be delivered and any premium.
- Daily price limit: the exchange resets the limit from time to time, so check the current figure before you trade.
Most traders never deliver. Your broker will usually ask you to close or roll a position before first notice day, the first day the exchange can assign delivery to holders of long positions.
How margin works on a wheat futures trade
Margin is not a down payment. It is a good-faith deposit that shows you can cover daily losses. The exchange sets a minimum, and brokers can ask for more. The CFTC says customer accounts are marked to market each day at the close. That means gains are added to your account and losses taken out every trading day.
If your balance falls below the maintenance level, you get a margin call. You must add cash, often by the next morning, or the broker can close your position. For a farmer with a short hedge, a sharp price rally can mean large margin calls before harvest, even though the crop in the bin is gaining value at the same time. Many farm lenders set up a hedge credit line for this reason.
The NFA risk disclosure statement, which brokers must give new clients, explains that you can lose more than the margin you deposit. Margin amounts change often, so the calculator below treats margin as your own input, not a fixed figure.
How to trade wheat futures in 7 steps
These steps describe the usual process. Rules and account types differ by country and broker.
- Set your goal. Decide if you are hedging grain you will grow or own, or speculating. A hedge has a matching cash position; a speculative trade does not.
- Pick the contract. Match the class you grow (SRW, HRW, spring wheat or a European contract) and the month closest to when you will sell.
- Choose a registered broker. In the US, check the firm on NFA BASIC. The CFTC says firms that handle customer funds must register with the NFA.
- Read the risk disclosure. Know the margin, fees, trading hours and your broker’s rules on margin calls.
- Size the position. Hedgers often cover part of expected output, not all of it, because yield is uncertain until harvest.
- Place the order. Market orders fill at the best price available; limit orders fill only at your price or better; stop orders trigger at a set level.
- Manage and close. Watch margin daily, and close or roll before first notice day unless you plan to deliver.
A paper trade or a mini-sized contract lets a beginner test this process with less money at risk. Neither removes risk entirely.
How farmers hedge wheat with futures
A short hedge is the classic tool for a grower. Say you expect to harvest 25,000 bushels of SRW wheat in summer. In winter you sell five July contracts. If prices fall by harvest, you sell your grain for less in the cash market, but you buy back the futures for less too, and the futures gain makes up much of the loss. If prices rise, the reverse happens: the cash sale gains and the futures position loses.
A hedge does not fix your final price exactly, because of basis. Basis is your local cash price minus the futures price. Nebraska Extension’s guide to tracking grain price basis shows how local basis follows seasonal patterns that farmers can record over several years. A hedge locks in the futures level; basis is the part you still carry.
Grain buyers also sell contracts that build futures in. A hedge-to-arrive contract sets the futures price now and leaves basis to be set later, without the farmer opening a futures account. A basis contract does the opposite: it fixes basis and leaves futures open. These suit growers who do not want to handle margin calls.
Hedging compared with other price tools
| Tool | What it locks | Margin calls | Main risk left |
|---|---|---|---|
| Short futures hedge | Futures price level | Yes | Basis, yield shortfall, cash for margin |
| Buying put options | A price floor | No (premium paid up front) | Cost of the premium, basis |
| Forward contract | Cash price at your elevator | No | Delivery shortfall if yield is low |
| Hedge-to-arrive | Futures price | No (buyer holds hedge) | Basis, delivery obligation |
| Basis contract | Basis only | No | Futures price moves |
Wheat futures hedge calculator
Use the calculator to see how a short hedge changes your price per bushel. The defaults are example values only, set so that futures do not move and the result sits at the starting level. Change the harvest futures price to see a rally or a drop. Margin is your broker’s figure, not a number from this page.
Try the numbers for your own farm below.
Calculator
What price does a short wheat hedge give you?
Enter your bushels, prices, basis and your broker’s margin and fees.
- Contracts (5,000 bu each): 5
- Cash sale price: $5.00 /bu
- Futures gain (+) or loss (-): $0
- Initial margin to post: $7,500
Example values only, not a forecast or a recommendation. Defaults assume futures do not move, so the hedged price equals the starting futures price plus harvest basis, minus fees. Basis is cash minus futures (negative when cash is under futures). Margin and fees come from your broker. Ignores interest on margin, yield shortfall and taxes. Education only; get professional advice before trading.
What moves wheat prices
Wheat futures react to supply and demand news, the dollar, weather and trade. The USDA’s World Agricultural Supply and Demand Estimates (WASDE) report each month is the main scheduled data point. The October 2026 WASDE put 2026/27 US wheat production at 1,534 million bushels, the smallest since 1970, with ending stocks of 740 million bushels and a season-average farm price of $6.30 per bushel. It cut US exports by 25 million bushels to 750 million.
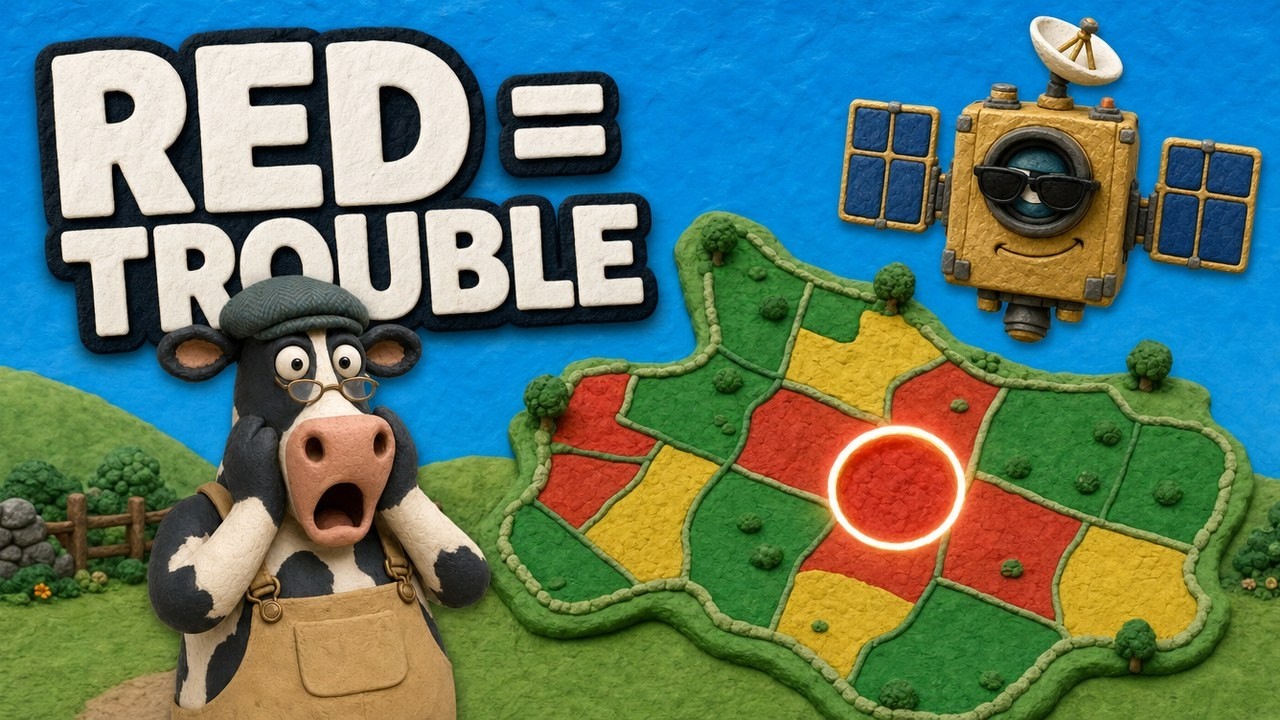
▶ How satellite NDVI maps show crop stress across a farm before it is visible from the ground. · 4:09
The same report breaks supply down by class. SRW production is projected at 294 million bushels for 2026/27, down from 353 million in 2025/26. HRW drops more sharply, from 806 million to 466 million bushels. The chart compares the two years for each class.
Global news matters as much as US news. The October WASDE projected world wheat trade at 209.0 million tons and said Russia’s exports are the lowest in five years at 40.0 million tons, citing logistical disruptions in the Black Sea region. Canada’s crop was raised to 36.5 million tons and EU output lowered to 133.0 million tons.
Field conditions drive these estimates. Satellite crop maps let growers and analysts see stress across large areas before harvest. Farmonaut’s satellite crop monitoring shows vegetation maps for your own fields through the season, which helps you judge how much of a crop to hedge.
Chart
US wheat production by class: this year vs last
Million bushels, marketing years beginning June 1
Soft red winter wheat supply and prices
SRW grows from Illinois, Indiana, Ohio and Kentucky down to Arkansas and the Carolinas. The USDA National Agricultural Statistics Service Crop Production Annual Summary puts SRW output at 449 million bushels in 2023, 344 million in 2024 and 353 million in 2025. Swings of this size are one reason SRW basis and spreads to Kansas City wheat can move sharply.
Chart
US Soft Red Winter wheat production
Million bushels by crop year
For a price series that is not a futures quote, the World Bank tracks No. 2 SRW export prices at the US Gulf. Its Pink Sheet of October 2026 shows a quarterly average of $206.0 per metric ton in July–September 2025, rising to $266.6 in July–September 2026, and $278.6 in September 2026. These are export price averages, not prices paid to farmers or futures settlements.
Chart
US SRW wheat export price at the Gulf
US$ per metric ton, quarterly averages, No. 2 SRW delivered US Gulf (export price, not a futures settlement)
Common wheat trading approaches and their risks
The old version of this page listed technical indicators and strategies. They are tools, not promises. No method removes the chance of loss.
- Seasonal patterns: some traders study how prices tend to behave around planting and harvest. Past patterns can fail in any year, as weather and trade shocks override them.
- Spreads: a calendar spread buys one month and sells another; an inter-market spread trades Chicago against Kansas City wheat. Spreads can have lower margin but still carry risk.
- Technical analysis: moving averages, support and resistance levels and volatility bands describe past prices. They do not predict supply.
- Fundamental analysis: WASDE balance sheets, export sales and crop condition reports. The CFTC’s weekly Commitments of Traders report shows how commercial and managed-money positions change.
- Options: buying puts or calls caps your loss at the premium paid. Selling options takes in premium but can carry large losses.
Risk note and professional advice
Futures use use. A small price move can wipe out your margin, and losses can exceed what you deposited. The CFTC says speculating in futures and options is rarely suitable for individual investors. Even a well-built hedge can lose money on the futures side, need cash for margin calls, or leave you over-hedged if your yield falls short.
This page gives general education with figures dated October 2026. It is not investment, tax or legal advice. Get professional advice from a licensed broker, your lender or a farm marketing adviser before you trade, and check the rules that apply in your country. In the US, the IRS treats a true hedge differently from speculation for tax purposes, so ask your accountant.
We cover a connected topic in Corn Futures Prices Prediction & Trading Trends.
FAQ
How do I buy wheat futures?
Open an account with a futures broker registered with the CFTC and NFA, deposit initial margin, and place a buy order for the contract and month you want, such as Chicago SRW wheat for July. Read the risk disclosure first.
How much money do I need to trade one wheat contract?
You need at least the initial margin your broker asks for, plus a cash buffer for daily losses. The exchange changes margin often, so ask your broker for the current amount. A 10-cent move on one 5,000-bushel contract equals $500.
What is the difference between SRW and HRW wheat futures?
Chicago futures are based on Soft Red Winter wheat, used for cakes and crackers. Kansas City futures are based on Hard Red Winter wheat, used mainly for bread. Each tracks a different class, region and buyer base.
Do I have to deliver wheat if I hold a futures contract?
Only if you hold a position into the delivery period. The CFTC notes most contracts are closed out before delivery. Brokers usually require you to close or roll before first notice day.
Is hedging with futures right for a small farm?
It depends on your size, cash and buyer. Mini-sized contracts, put options, forward contracts and hedge-to-arrive contracts can suit smaller farms. Ask your lender or a marketing adviser which fits.
Related pages on our site: corn futures market analysis, our satellite and weather API docs and the Farmonaut app.
Farmonaut crop monitoring
Watch your wheat fields from space
Draw your fields once and Farmonaut shows satellite vegetation maps for them through the season, on web, Android or iOS.




Sources
- CFTC, Basics of Futures Trading: cftc.gov
- CFTC, Futures Glossary: cftc.gov
- CFTC, Commitments of Traders, Agriculture (Futures) long report: cftc.gov
- CME Group, Chicago SRW Wheat contract specifications: cmegroup.com
- National Futures Association, Risk Disclosure Statement for futures and options: nfa.futures.org
- USDA ERS, Wheat Sector at a Glance (updated April 2026): ers.usda.gov
- USDA, World Agricultural Supply and Demand Estimates, WASDE-676 (9 October 2026): usda.gov
- USDA NASS, Crop Production 2025 Summary (2026): release.nass.usda.gov
- World Bank, Commodity Price Data (Pink Sheet), October 2026: thedocs.worldbank.org
- Nebraska Extension CropWatch, Tracking Grain Price Basis to Identify Trends: cropwatch.unl.edu
- ADM Advantage, Hedge-to-Arrive contracts: admadvantage.com
- ADM Advantage, Basis contracts: admadvantage.com
- Euronext, Milling Wheat futures (EBM): live.euronext.com
Discussion
Questions, corrections or field experience? Share them below. First-time comments are reviewed before they appear, and your email is never published.
No comments yet. Be the first to add a question or your experience.

 Aamoksh One Eighty
 Patrick America
 Red Dog Management
 Liquify Digital
 CU Foods
 BeyondTech Global
 Rouge VC
 AgroGreen Dynamics
 AgroRisk
 Oath Inc
 Reddane Farming
 Esri North East Africa
 Cresol
 MDCV UK
 Zerella Group
 Etech Consulting Madagascar
 Vestlandsforsking
 Delicio
 WB Dev
 Sama Premium
 Prochecker

 Exploration consultancy · South Africa · Gold
 Licence holder · Niger · Gold










