

A grower in northern Illinois started watching their corn from space in June 2025. This story comes with two corn yield calculators you can use on your own fields. Sixteen months, more than a hundred satellite looks per field and a renewal every single month later, they have just added an apple orchard across the border in Canada. It began with one introduction from a Farmonaut affiliate partner.
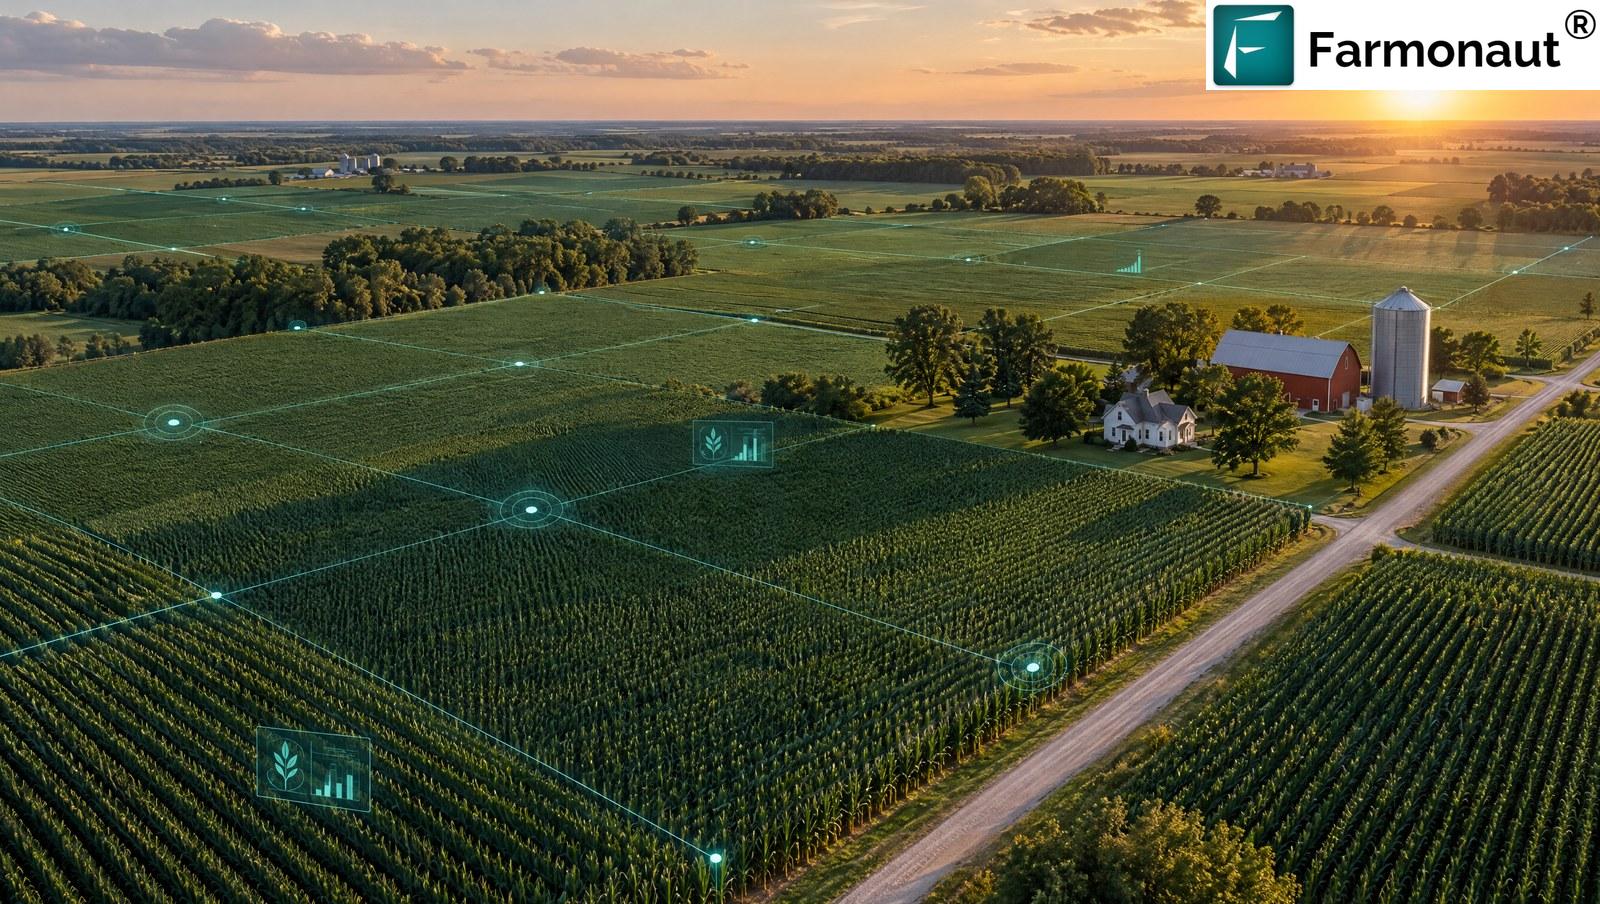
Corn growers ask one question above all: what will this field yield? This article answers it two ways, with a corn yield calculator you can run on your own ears and acres, and with a real satellite crop monitoring story from Illinois. Most farm technology is judged in a demo. This one is judged every month, at renewal. A satellite crop monitoring subscription that a grower keeps paying for through a whole growing season, a winter and the next season is a quiet vote of confidence, and this account has voted sixteen times in a row.
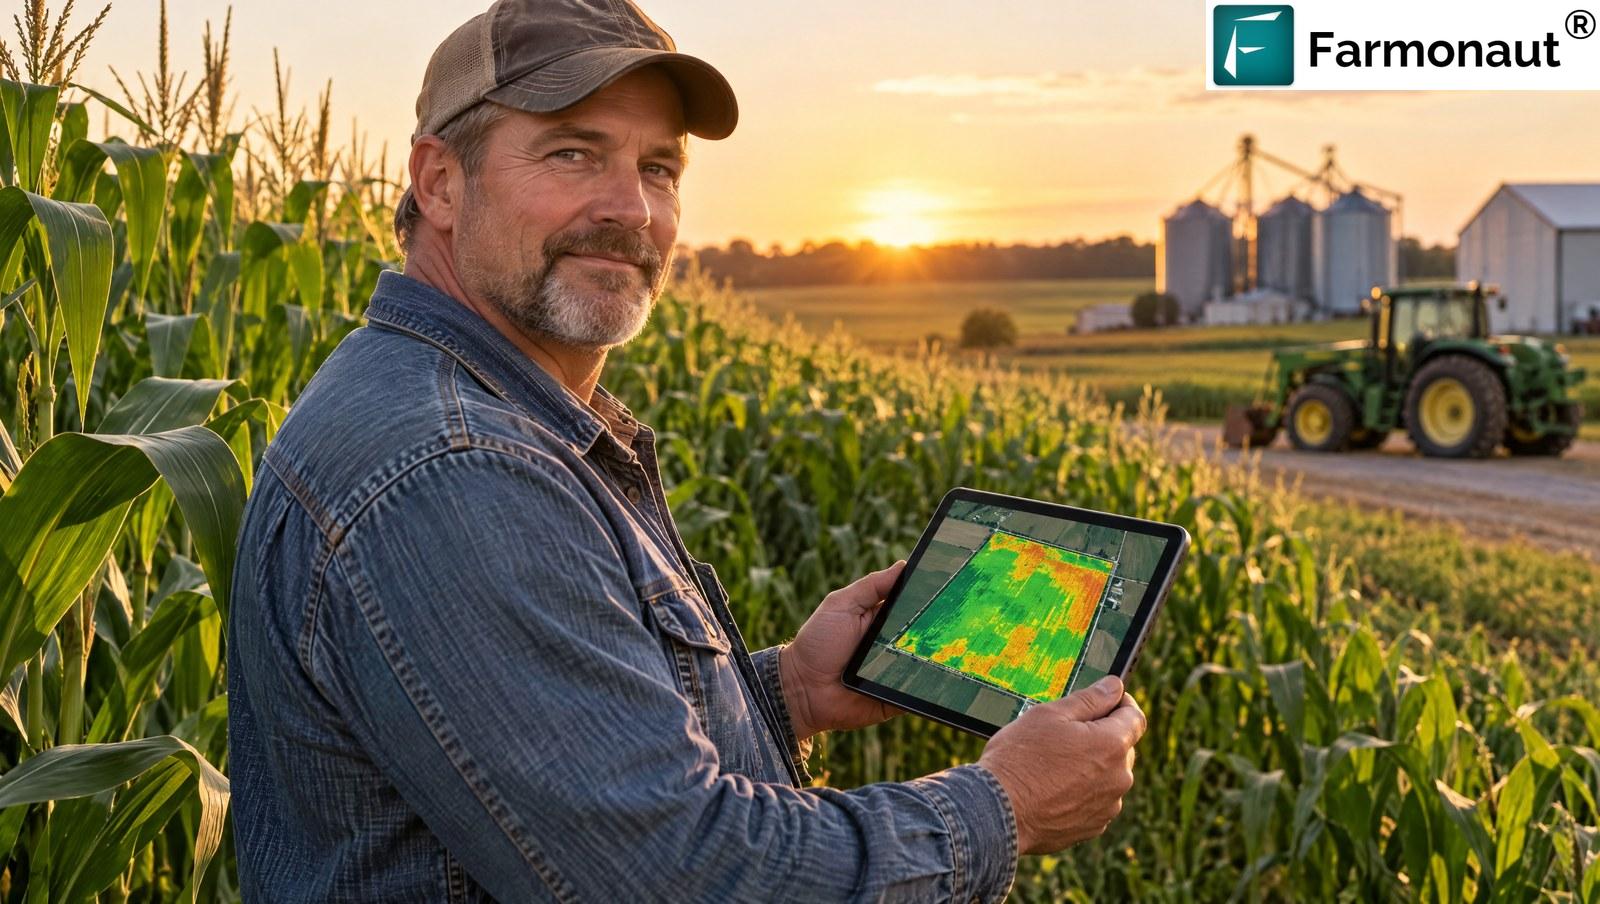
The grower in this story farms corn near the village of Wilmington in northern Illinois. They came to the Farmonaut Satellite + AI Farm Monitoring System through a Farmonaut affiliate partner, a person who knew what the platform could do and put it in front of someone who could use it. That introduction turned into a long, steady relationship with the data, and this article follows what the system has actually been doing on their ground.
“Illinois corn averaged about 214 bushels an acre in 2025. Every one percent of that is worth chasing.”
The strongest sign that satellite monitoring works for a farm is not a headline percentage. It is that the grower keeps it switched on, adds more fields over time, and then takes it to a second crop in a second country. That is exactly what happened here.

How one affiliate introduction became sixteen months of monitoring
Farmonaut’s affiliate programme is simple. A partner shares a personal promo code, and anyone who subscribes with that code is linked back to them. The partners are not salespeople in a call centre. They are agronomists, consultants, growers and enthusiasts who already trust satellite data and like to share it.
The code behind this story is the most productive in the programme. Three paying growers have come through it, in the United States and in India, and the Illinois account is the anchor. The grower’s first order was placed on 6 June 2025, and satellite coverage of their fields began on the third of that month. Every month since, the subscription has renewed on schedule.
That is the part of an affiliate success story that is easy to miss. The partner did not just generate a sign-up. They matched the right grower to the right tool, and the tool then did its own work, season after season.
What the system has watched on this operation
The account today covers four fields. Three are corn, close to each other in northern Illinois. The fourth, added in October 2026, is an apple orchard in Prince Edward County, Ontario. Together they are roughly 64 hectares, or 158 acres, under one login. Earlier in the account’s life it also tracked a soybean block, so the grower has already used the same tool across more than one crop.
| Field | Crop | Area (ha) | Area (acres) | Region | Monitored since |
|---|---|---|---|---|---|
| East Front | Corn | 21.0 | 51.9 | Northern Illinois, USA | June 2025 |
| Front Middle | Corn | 12.5 | 30.9 | Northern Illinois, USA | June 2025 |
| Southwest block | Corn | 15.7 | 38.9 | Northern Illinois, USA | June 2025 |
| Orchard | Apple | 14.7 | 36.2 | Prince Edward County, Ontario | October 2026 |
Each corn field has been looked at from orbit about 110 times, and read by radar 181 times. The most recent satellite pass on the account was on 11 October 2026. In other words, the grower does not need to remember to check anything. The system watches, and the grower reads the result when it suits them.
Why two kinds of satellite beat one
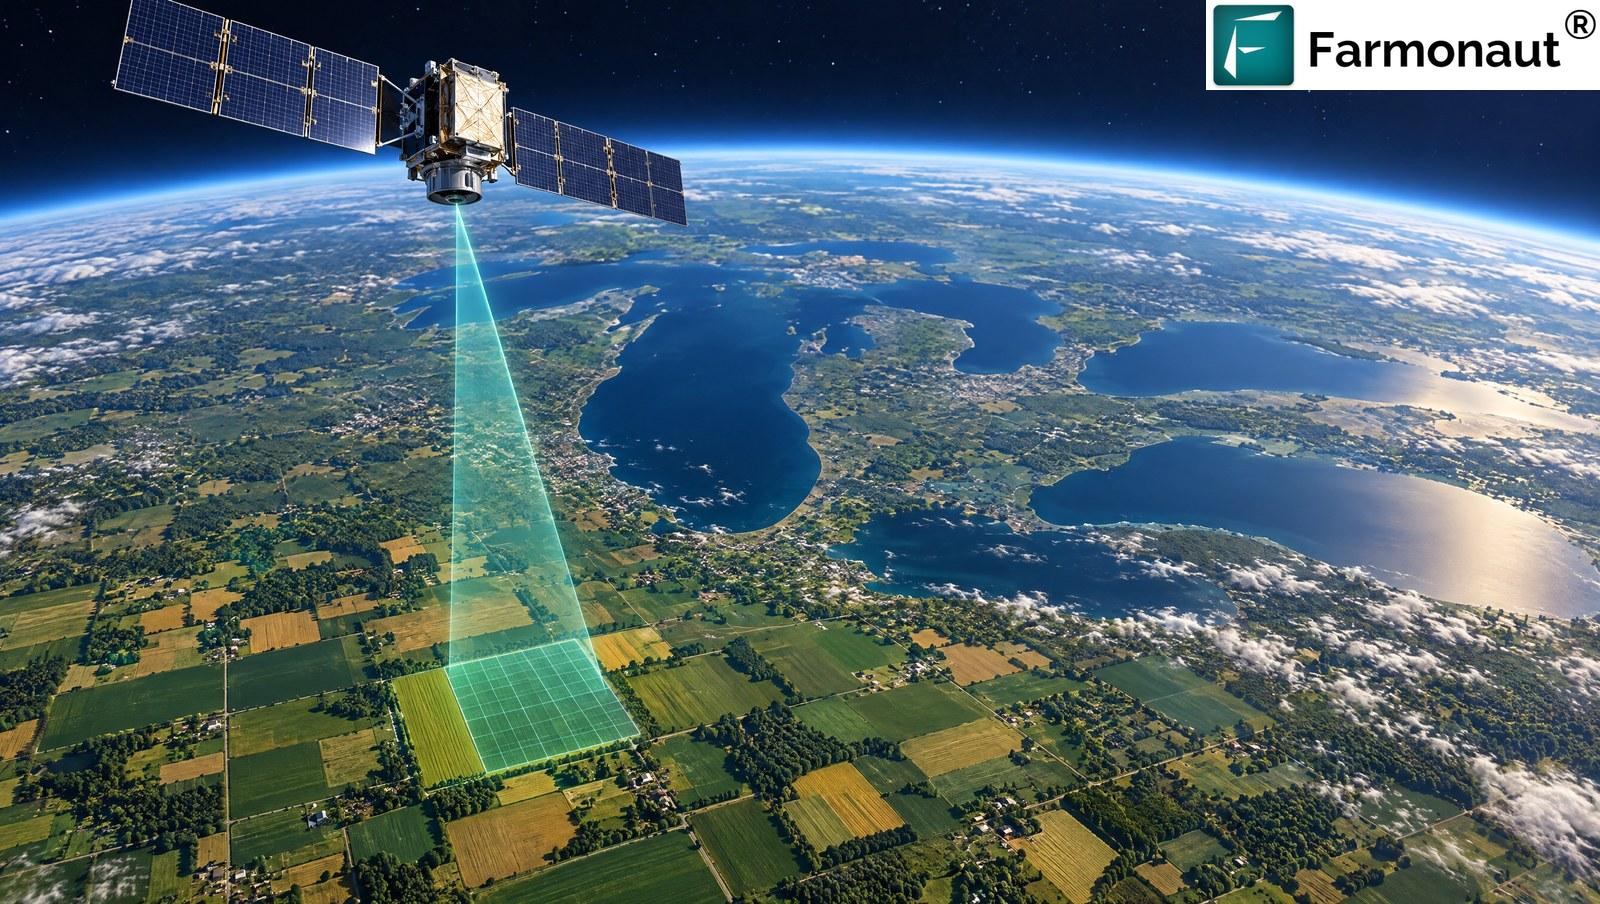
Optical satellites take pictures the way a camera does, and clouds block them. A wet northern spring can mean weeks without a clean image. Radar satellites send their own signal and listen for the echo, so cloud, haze and darkness do not matter. The Farmonaut system uses both, which is why the monitoring record on these fields has no long gaps. In a corn belt where one cloudy fortnight can hide an early problem, that continuity is worth a lot.
A season on the dashboard: corn from planting to harvest
It helps to picture what a grower actually sees as the season unfolds. Corn moves through clear stages, and the satellite record follows each one. The dates below are typical for northern Illinois, and the pattern is the same on any corn farm.
Emergence and early growth. In the first weeks the canopy is small and soil shows through. This is where EVI and SAVI earn their place, because they correct for bare ground. The map shows how evenly the crop has come up. A thin strip, a compacted headland or a wet corner appears as a pale patch, and the grower can walk to it while there is still time to replant or adjust.
Rapid vegetative growth. By midsummer the canopy closes and the crop is putting on size fast. NDVI climbs, and NDRE takes over as the more honest signal on nitrogen, because NDVI flattens out in dense canopy. A field that greens more slowly than its neighbour is worth a closer look, and the top-dress decision becomes a matter of reading two maps instead of guessing.
Tasseling and grain fill. This is the stretch where weather matters most. The moisture index and the daily weather record sit side by side, so a dry week can be read against the rain that did or did not fall. A stress signal here is a prompt to check the field, not an alarm, and it arrives early enough to act on.
Maturity and harvest. As the crop dries down, the canopy curve falls away evenly across a healthy field and unevenly across one that struggled. That shape is itself a record. Next season the grower can lay this curve over the new one and see, field by field, what changed.
Through all four stages the radar passes keep the record unbroken, even when cloud closes the optical window. That is why a grower can look back over sixteen months and find a clean line of readings rather than a patchwork.
Name every field the way you talk about it on the farm. This grower uses descriptive names such as East Front and Front Middle, so a glance at the dashboard matches the way they think about their ground.
The toolkit: what each index tells a corn grower
A satellite does not hand over a picture and walk away. For every look, the Farmonaut system turns the raw light into a set of indices, each one answering a plain farm question. A grower does not need to be a remote-sensing expert. They need to know which question each index answers.
| Index | The farm question it answers | Why a corn grower cares |
|---|---|---|
| NDVI | How green and vigorous is the crop? | Shows uneven emergence, weak patches and the real canopy curve |
| NDRE | Is the crop short of nitrogen? | Reads the chlorophyll in a dense canopy, where NDVI saturates |
| NDMI | Is the canopy holding enough water? | Flags drought stress before leaves visibly roll |
| NDWI | Where is standing water? | Finds wet spots and ponding after heavy rain |
| EVI & SAVI | How healthy is the crop once soil and haze are removed? | Cleaner readings early in the season, when soil still shows through |
| Soil organic carbon | How rich is the ground under the crop? | Helps explain why one field out-yields its neighbour |
On this account every one of these has been calculated for every field, on every clear look, for sixteen months. That gives the grower something that is hard to buy any other way: a season-by-season memory of their own ground. They can set this June’s corn beside last June’s, field against field, and see where the crop led and where it lagged.
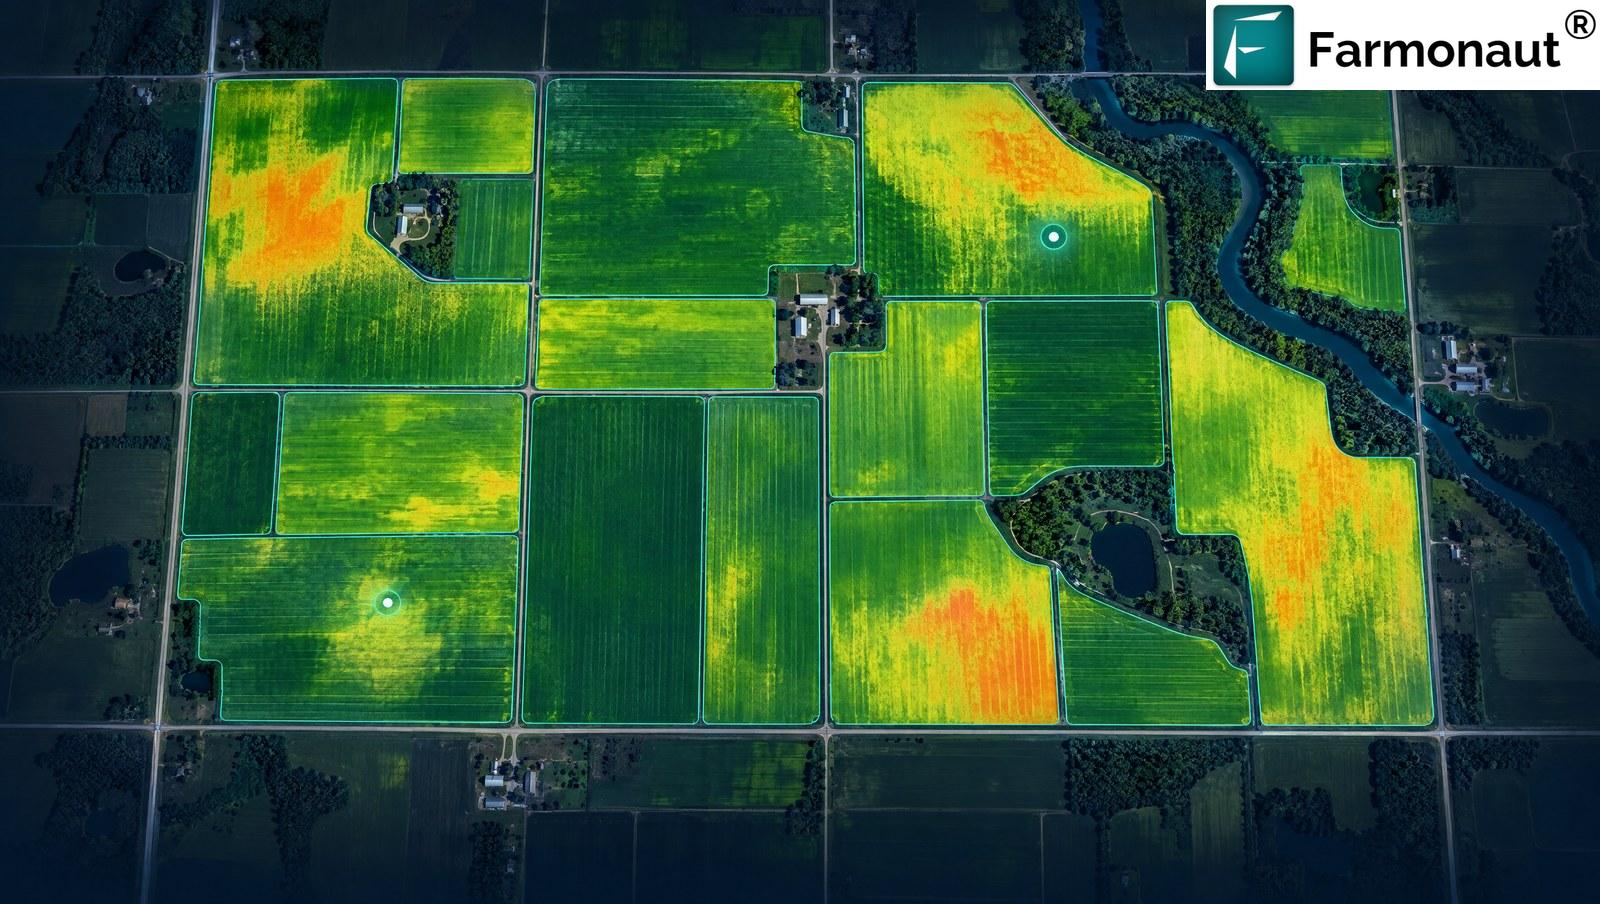
“More than a hundred satellite looks at the same field in sixteen months.”
From picture to decision
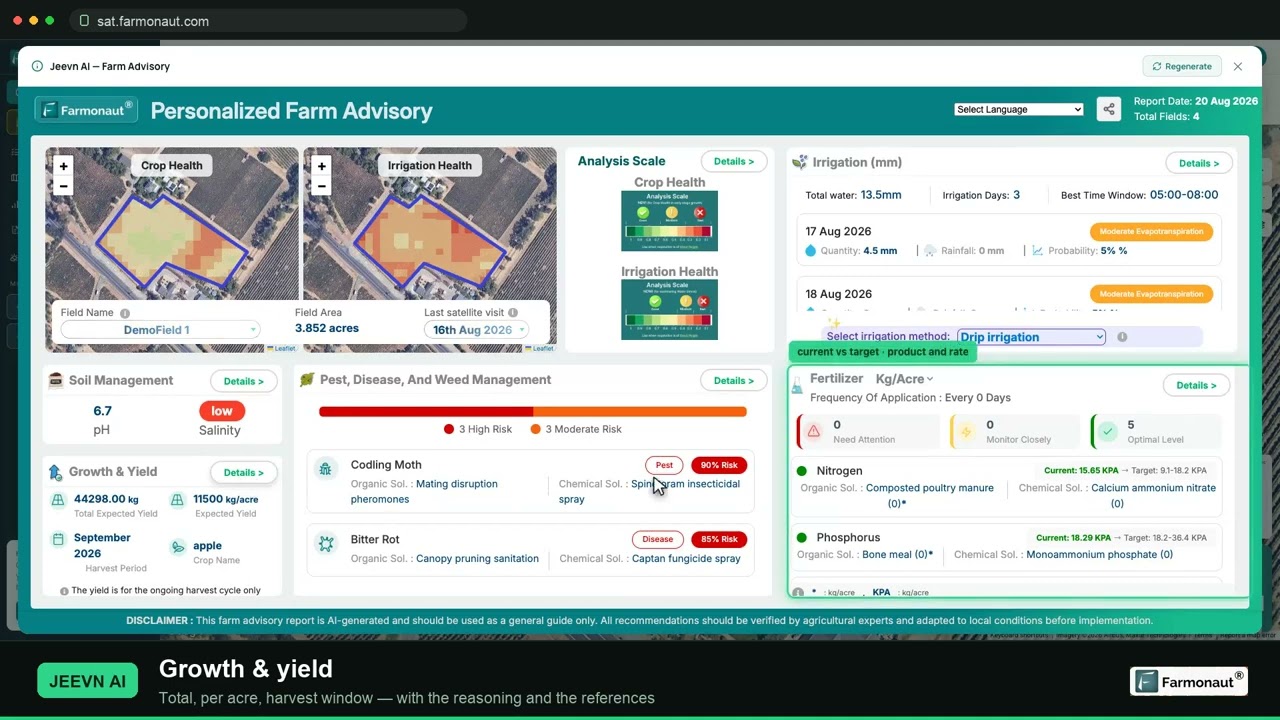
Satellite monitoring is one layer of precision agriculture, and it sits comfortably beside farm management software and the other corn farming technology a modern grower uses. What it adds is a view of every field, every few days.
The point of an index is a decision. If you want the detail behind NDVI and NDRE, our guide to NDVI versus NDRE explains the difference. In a typical corn season, three decisions carry most of the money: where to scout, when to apply nitrogen, and whether a dry spell needs action. The system helps with all three.
- ✔ Where to scout. A weak patch on the vegetation map tells the grower which corner of which field to walk first, instead of walking all 49 hectares.
- 📊 When to feed. A canopy that is greening slower than its neighbour shows up in the nitrogen-sensitive index, so a top-dress can be timed and targeted.
- ✔ When it is dry. Moisture readings and the daily weather record sit next to each other, so a stress signal can be read against the rain that actually fell.
- 📊 What worked. Last season’s curve is still there, so every change in practice can be compared with the year before.
What other growers get from the same system
This grower’s own numbers belong to them. But the same Farmonaut system has been working on other farms around the world, and several of those growers have told us what it did for them. Those reports are the best guide to what any new subscriber can expect, because they come from real farms of every size and crop.
Across the Farmonaut customer case studies, growers have reported the following improvements, each entered by the grower themselves on our in-app feedback form:
The pattern is steady. Growers in very different places, from a Florida blueberry operation to a Kenyan maize plot and a Nigerian farm hub, land in the same bracket: 30 to 50 percent better decisions on water and fertiliser, and in the best cases 50 to 70 percent. A grape grower managing 34 plots reported more than 70 percent. A Farmonaut grower in India running potatoes and sugarcane reported the same irrigation band and an additional fertiliser saving of up to 20 percent.
Satellite monitoring does not ask a farm to change its crop, its machinery or its routine. It adds information. When the information is right, the saving comes from doing less of what was not needed: water that was not required, nitrogen that was already in the soil, a scouting walk that pointed at the wrong corner.
Corn yield calculator: what a small gain is worth on 49 hectares
Before the satellite maths, a quick field tool. The best-known way to estimate corn yield before harvest is the ear-count method: count the ears in a short length of row, multiply by kernel rows and kernels per row, and divide by a standard figure for kernels per bushel. It takes minutes, it needs no equipment, and it gives a number you can compare with last year and with average corn yield per acre by state.
Corn yield estimator: count ears, get bushels per acre
Walk to a representative spot, count the harvestable ears in a 1/1000-acre sample (about 17 feet 5 inches of 30-inch row), then check a few ears for rows and kernels.
- Estimated total crop: 22,773
- Versus Illinois 2025 average of about 214: -27.3
Illustrative estimate using the standard kernel-count rule of thumb published by university extension services, which assumes about 90,000 kernels per bushel. Sample several spots across the field and average them; real yield also depends on kernel weight, moisture and harvest losses.
Run it in three or four places and average the results. Then use the calculator below to see what a small gain is worth. Satellite monitoring tells you where in the field to take those samples: the weak patches and the strong ones.
Illinois is a rain-fed corn state, so the water story that shines in Florida or Kenya matters less here. What matters is nitrogen timing, early stress detection and scouting efficiency. Those three sit directly on yield, and corn is a crop where small percentages are big numbers.
To see how big, take the three corn fields on this account: 49.2 hectares, or about 122 acres. Illinois corn averaged roughly 214 bushels per acre in 2025, according to the University of Illinois farmdoc daily summary of USDA county yields. At that average, the three fields would produce around 26,000 bushels in a season. Every one percent of yield is therefore about 260 bushels.
| Illustrative yield change | Extra corn on 122 acres | What would have to happen |
|---|---|---|
| +1% | about 260 bushels | One timely top-dress or one caught stress patch |
| +2% | about 520 bushels | Better nitrogen timing across all three fields |
| +3% | about 780 bushels | Early stress flags plus targeted scouting through the season |
These rows are a scenario, not a measurement. They show how quickly a small, plausible gain adds up on a field this size, and why a monitoring subscription is easy to weigh against a crop worth many tens of thousands of dollars. A grower who keeps the subscription for sixteen months and then adds a second crop has clearly done that sum for themselves.
What could a yield gain be worth on your corn?
Enter your own acres, yield and price. The defaults are this grower’s three corn fields and the 2025 Illinois average.
- Baseline crop: 26,108
- Extra bushels: 522
- Baseline crop value: $117,486
Illustrative arithmetic, not a forecast or a result for any grower. The price field is an editable placeholder, not a market quote; replace it with your own delivered price. Yield gains depend on crop, weather, soil and management.
Early stress is the biggest lever
Our crop-monitoring tutorial describes how stress can appear in satellite readings up to two weeks before it is visible to the eye. For corn, that matters most around the vegetative stages and early grain fill, when a few days of correction can protect a large share of yield. A grower who sees the signal on the map can drive to the right field, walk to the right corner, and decide whether it is a nutrient problem, a moisture problem or a pest problem.
That speed is the real product. A satellite does not replace the agronomist or the farmer’s own eye. It tells them where to look and when.
From corn to apples: why the orchard came next
On 1 October 2026 the account gained a new field: a 14.7-hectare apple orchard in Prince Edward County, on the Ontario shore of Lake Ontario. The first three satellite passes arrived within days, on 1, 4 and 9 October, with vegetation, moisture and soil readings ready on the dashboard.
It is worth pausing on how little the grower had to do. There was no new app, no new contract, no hardware to install and no new login. The orchard was drawn on the map, its crop was set to apple, and the same system that had been watching corn in Illinois began watching trees in Ontario. One account now spans two countries and two very different crops.
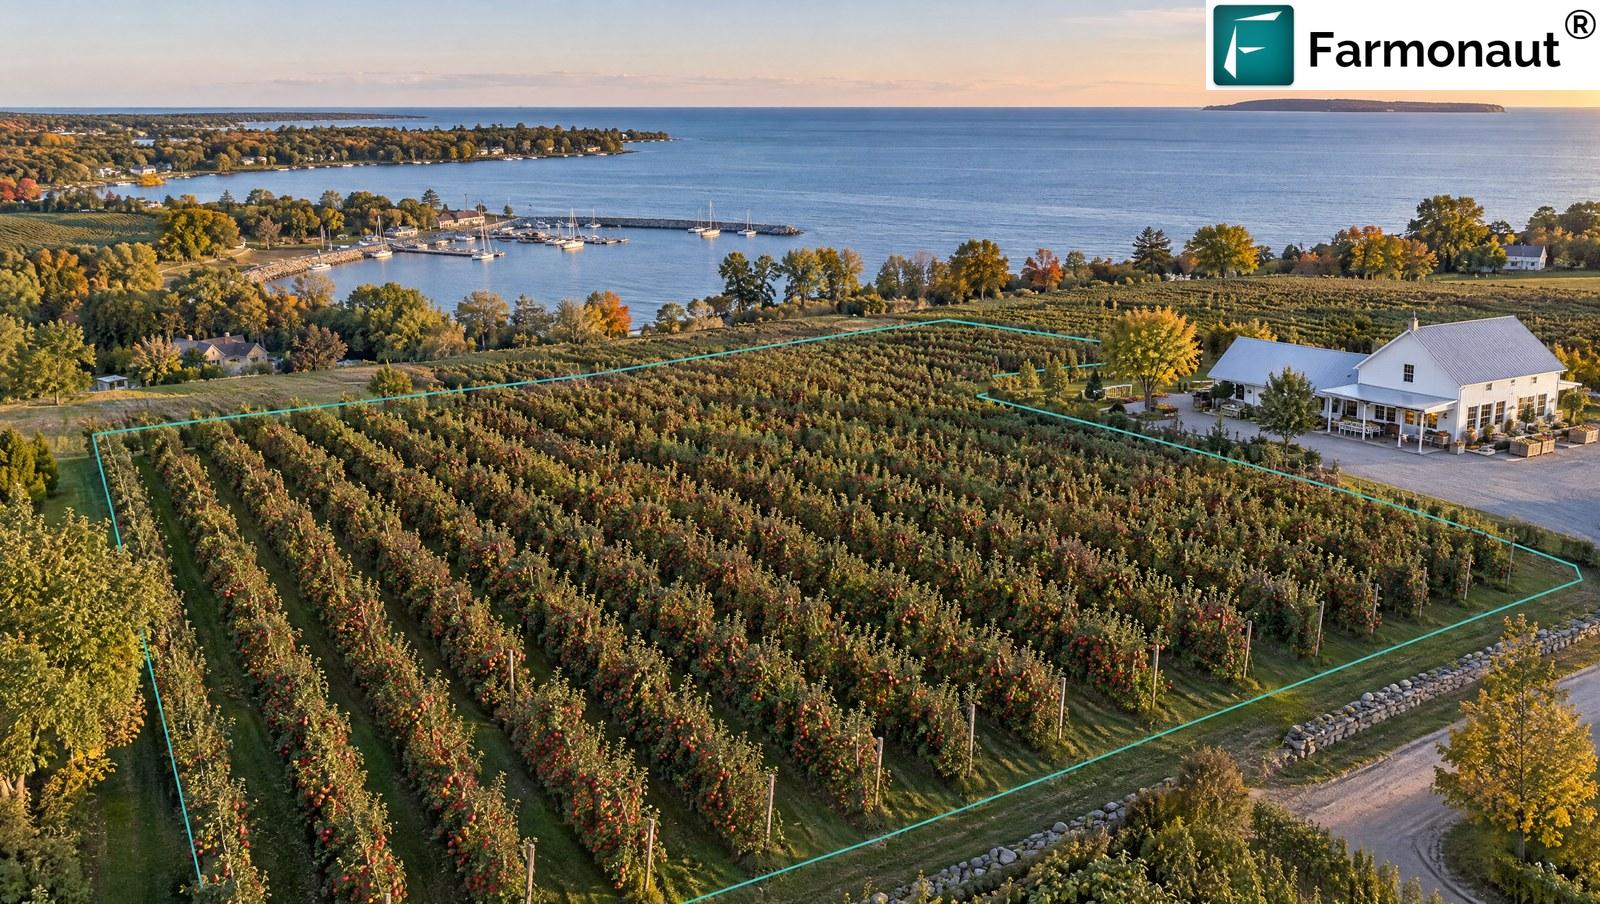
Tree crops are a natural fit for satellite monitoring. A canopy that is thinning or stressed in one block shows up weeks before the fruit does, and an orchard’s value sits in a small number of high-value trees, so a caught problem pays back quickly.
What an orchard gains from the same tools
- ✔ Canopy vigour by block. NDVI and EVI show which parts of the orchard are growing hardest and which are lagging.
- 📊 Moisture stress. Orchards on lighter soils feel dry spells first, and the moisture index flags them early.
- ✔ Season-to-season comparison. Each year’s canopy curve becomes a baseline for the next.
- 📊 Frost and heat context. Daily weather records sit next to the imagery, so a stress signal can be read against the night that caused it.
For an apple grower this long view is especially valuable, because a tree is a multi-year asset. The record that began in October 2026 will still be useful in ten years.
Why affiliate partners make growth like this possible
The Illinois account is a clear example of what an affiliate partner can do. They did not make a hard sell. They matched a grower with a tool that fit, and the tool did the rest. The grower stayed, expanded across two crops and two countries, and kept paying every month because the value kept showing up.
For anyone who already works with farmers, agronomists, co-operatives, input dealers or growers’ groups, the same pattern is open. A partner shares a personal code. Their referrals subscribe to the Farmonaut Satellite + AI Farm Monitoring System. The partner is linked to every account that comes through the code, and the accounts that stay are the ones that turn into long relationships like this one.
- ✔ Real tools, real data. Partners introduce a working product with sixteen-month track records, not a promise.
- 📊 Any crop, any country. The same code works for corn in Illinois, paddy in Tamil Nadu and apples in Ontario.
- ✔ Growers stay. Monitoring that pays for itself every season is monitoring that renews.
The best introductions come from people who already know a grower’s pain: late nitrogen, surprise stress, uneven fields. If that sounds like your network, talk to our team about becoming a Farmonaut affiliate partner.
Running this on your own farm
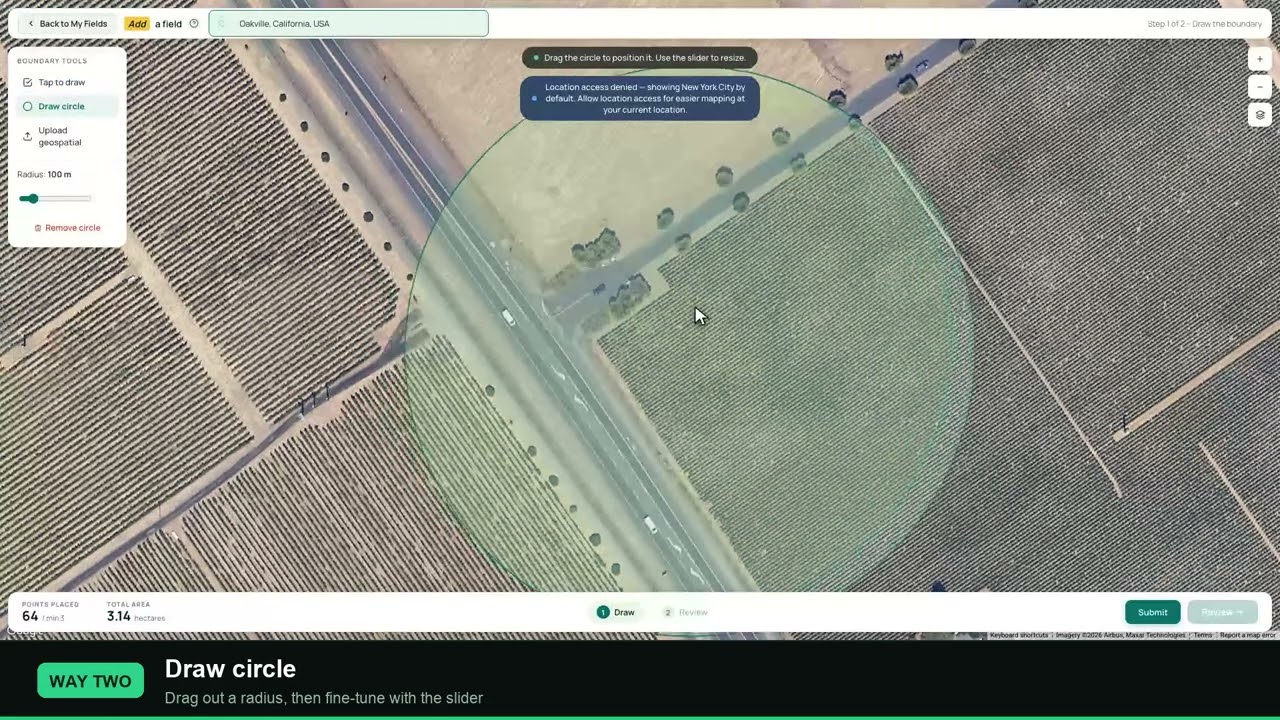
Getting started takes minutes. Open the web app, draw or upload your field boundary, set the crop and sowing date, and the first satellite reading arrives with the next pass. From there the system keeps watching, whatever the weather, and you read the result when it suits you.
- Map your fields. Draw each boundary on the map, or import one you already have.
- Set the crop. Corn, soybean, apple or a wide range of other crops, each with its own growth stages.
- Read the dashboard. Vegetation, moisture and soil indices update with every clear look, radar fills the gaps.
- Act where it matters. Scout the flagged corner, time the top-dress, check the dry block first.
Run the corn yield calculator, then put your fields under satellite watch
Map each field, set its crop and get vegetation, moisture and soil readings from your own ground, every few days, in every kind of weather.
More affiliate success stories
- ✔ Blueberry farming with satellite monitoring in Romania
- ✔ Mango farming with satellite monitoring in East Java
- ✔ Small scale farming with satellites: five Indian farms
Frequently asked questions
How do you estimate corn yield before harvest?
Count the harvestable ears in 1/1000 of an acre, multiply by the average kernel rows per ear and kernels per row, then divide by about 90. The corn yield calculator in this article does the arithmetic. Repeat it in several places and average the results.
What is satellite crop monitoring and how does it help corn growers?
Satellite crop monitoring uses images from orbit to measure how healthy, how thirsty and how well fed a crop is, field by field. For corn growers it shows weak patches, nitrogen-hungry areas and early drought stress, so scouting and top-dressing go where they are needed instead of across the whole farm.
How often is a field looked at?
On the Illinois fields in this story, each corn field has been recorded about 110 times by optical satellite and 181 times by radar between June 2025 and October 2026. Optical looks depend on cloud, radar fills the gaps, so the record stays continuous.
Can one account cover more than one crop or country?
Yes. This account holds corn fields in Illinois and an apple orchard in Ontario under a single login. Each field has its own crop, its own boundary and its own record.
What improvements do other growers report?
Growers across our published case studies report improving irrigation and fertiliser decisions by 30 to 50 percent, and in some cases 50 to 70 percent. These are the growers’ own estimates from the in-app feedback form, not metered volumes.
How does the corn yield calculator work, and what is a small gain worth on a corn farm?
On 122 acres of corn at the 2025 Illinois average of roughly 214 bushels per acre, each one percent of yield is about 260 bushels. The table in this article shows one, two and three percent as illustrative scenarios, not results.
How does the affiliate programme work?
A partner receives a personal promo code. Growers who subscribe using that code are linked to the partner. To join, contact our team through the link on this page.
Is Farmonaut Satellite + AI free?
No. Farmonaut Satellite + AI Farm Monitoring System is a paid subscription. Plan details are on the platform.
Glossary
- NDVI
- Normalised Difference Vegetation Index. A satellite measure of how green and vigorous the crop canopy is.
- NDRE
- Normalised Difference Red Edge. Reads chlorophyll in dense canopy and is used as a guide to nitrogen status.
- NDMI
- Normalised Difference Moisture Index. A satellite measure of how much water the canopy is holding.
- SAR (radar)
- Synthetic aperture radar. A satellite signal that works through cloud and in darkness, used to keep the record continuous.
- Top-dress
- A fertiliser application made to a growing crop, in corn usually nitrogen, timed to the stage of growth.
Corn yield calculator note: the ear-count estimator uses the standard kernel-count rule of thumb (about 90,000 kernels per bushel) published by university extension services and is an estimate, not a measurement. Case-study basis: the Farmonaut platform records for a single account, covering the period 3 June 2025 to 11 October 2026, including field boundaries, crop settings, satellite and radar acquisition dates, weather records and subscription renewals. Crops, region, field count, area and monitoring dates are reported from the account’s own records. The grower is not named and precise field locations are withheld. The yield scenario is an illustrative calculation, not a measured result: it multiplies the three corn fields’ area (about 122 acres) by the 2025 Illinois average yield of roughly 214 bushels per acre reported by the University of Illinois farmdoc daily from USDA NASS county data. The improvements shown for other growers are those growers’ own estimates from the in-app feedback form, as published in the corresponding Farmonaut customer case studies, and are not metered or independently audited. Individual results vary with crop, weather, soil and management. Satellite indices describe crop condition and do not on their own diagnose a cause; scouting and agronomic judgement remain part of every decision. Photographs and scene images in this article are AI-generated illustrations, labelled as such in their captions; they do not depict the grower, their family, their fields or their orchard. The Farmonaut Satellite + AI Farm Monitoring System is a paid product.
Discussion
Questions, corrections or field experience? Share them below. First-time comments are reviewed before they appear, and your email is never published.
No comments yet. Be the first to add a question or your experience.

 Misteo
 Tres Valles
 LACOS Geoinformation
 Pulsar Supernova
 Magrifly
 LatConnect 60
 WebsEdge
 Blickwinkel
 Agricultural Credit Policy Council
 MCSOD
MCSOD Marei Nursery
 eKGIS
eKGIS Mostas Tech
 Andex
Andex FCF India
 Unifrutti Gulf
 Deluxe Conseil
