

Reviewed September 2026 against USDA NASS Census of Agriculture and USDA ERS cover crop data.
Try it: Run your own numbers →
An agriculture model project is a small-scale, physical demonstration — a raised bed, a terraced cardboard slope, a compost bin, or a tabletop soil profile — built to show how one sustainable farming principle actually works. The seven ideas below cover soil health, water conservation, waste cycling, pest management, and crop diversity, each with a materials list, a time estimate, and a cost range in US dollars. What follows also answers the harder question judges and teachers actually ask: how does the small model connect to what real US farms are doing right now, at what scale, and with what numbers?
That connection is the part an AI summary can’t hand you, because it depends on current USDA figures, not general definitions. So before the project ideas, here is the actual state of the practices these models represent — cover crop adoption, organic acreage, and yield data — all sourced to USDA NASS and USDA ERS, with the exact dataset to check for a fresher number next year.
Table of Contents
- What Counts as an Agriculture Model Project
- Comparison Table: 7 Project Ideas, Materials, Cost, Time
- The Real Numbers Behind These Models: USDA Data
- Project Objective and Scope
- Site Selection and Layout Guide
- Soil Health and Media in Agriculture Models
- Crop Selection and Planting Plans
- Water Management in Farm Model Projects
- Pest Management and Biodiversity
- Waste Management and Composting
- Soil Amendment & Water Calculator for Your Model
- Monitoring, Data Collection, and Reporting
- Ethics, Safety, and Sustainability Principles
- Presentation, Demonstration, and Outreach
- All 7 Ideas — Detailed Build Notes
- How Farmonaut Supports These Projects
- FAQ
- Try it: Run your own numbers
Agriculture Model Project Ideas for School
Every one of the seven models below demonstrates a real, measurable practice used on US farms today — not an abstract “sustainability” theme. That distinction matters for a school project because a judge or teacher can ask “how many real farms actually do this, and how much of the country’s cropland does it cover?” and you should be able to answer with a cited number, not a guess. This guide gives you that number for each practice, plus the build steps, so the project holds up under a follow-up question.
US farmers planted cover crops on 18.0 million acres in 2022 — 4.7% of total cropland — up from 4.0% in 2017 and 2.7% in 2012, per the USDA NASS Census of Agriculture. That steady rise is the real-world version of the “soil health model” idea below, and it’s a fact you can cite on your project poster.
Whether you’re a teacher assembling a farm model for school project unit or a student choosing among agriculture project ideas for a science fair, the structure here is the same: pick one practice, build a model that isolates it, measure something over 1–4 weeks, and report the result against the national baseline.
Comparison Table: 7 Agriculture Model Project Ideas
| Project Name | Core Focus | Required Materials | Estimated Time | Educational Outcome | Estimated Cost (USD) |
|---|---|---|---|---|---|
| Sustainable Soil Health Model | Soil Organic Matter, Biodiversity | Potting soil (20 lb), compost (3 lb), seeds, mulch (2 lb), watering can | 3–4 weeks | Soil biology, crop selection, sustainable farming | $12–$22 |
| Terrace / Step Farming Model | Water Conservation, Erosion Control | Cardboard (2 sheets), soil (10 lb), seedlings (6–8), gravel (2 lb) | 2–3 weeks | Contour farming, moisture retention | $8–$15 |
| Composting and Mulching Model | Organic Waste Recycling | Compost bin, greens/browns (4 lb), mulch, small spade | 1–2 weeks | Waste management, soil enrichment | $10–$18 |
| Drip Irrigation and Rain Barrel Model | Water Use Efficiency | Drip kit, rain barrel, tubing (6 ft), connectors | 2 weeks | Efficient irrigation principles | $18–$30 |
| Polyculture Companion Planting Bed | Crop Diversity, Pest Control | Raised bed (DIY), mixed seeds, compost (2 lb), plant markers | 3 weeks | Companion relationships, pest deterrence | $15–$25 |
| Soil Profile and Health Monitoring Kit | Soil Analysis, Data Monitoring | Soil test kit, sampling tubes, data sheets | 1–2 weeks | pH, fertility, moisture analysis | $12–$24 |
| Beneficial Insect and Pest Management Display | Biodiversity, Non-chemical Control | Charts, 3D models, plant cuttings, insect photos | 2 weeks | Pest ID, ecosystem balance | $8–$14 |
Pick crops and seeds sold locally at your region’s extension office or garden center — varieties bred for your USDA hardiness zone establish faster and give you cleaner data inside a 2–4 week school-project window.
The Real Numbers Behind These Models: USDA Data
This is the section most agriculture model project guides skip, and it’s the one that makes a project defensible in front of a judge. Below are the figures for the two practices most often modeled — cover cropping and organic production — straight from USDA NASS, with the survey cadence so you know when a newer number will exist.
Cover Crops: Adoption by the Numbers
- 2012: 2.7% of US cropland under cover crops (USDA NASS).
- 2017: 4.0% of US cropland under cover crops (USDA NASS).
- 2022: 4.7% of US cropland — 18.0 million acres — under cover crops (USDA NASS Census of Agriculture).
- Maryland, 2024: 27.3% of cropland (381,594 acres) under cover crops — roughly six times the national rate, driven by the state’s cost-share program (USDA-NASS).
- Owner-operated fields outside the Heartland region, 2021: about 30% adoption, versus far lower rates inside the core Corn Belt (USDA ERS Chart of Note).
That gap between a 4.7% national average and a 27.3% state figure is itself a good school-project data point: it shows adoption is policy-driven, not just climate-driven, since Maryland’s number is tied to a specific state cost-share incentive rather than better soil or weather.
Organic Farming: Scale and Growth
- $9.6 billion in certified or exempt organic product sales, US, 2022 (USDA NASS Census of Agriculture).
- 17,445 certified organic farm operations nationwide, 2021 (USDA NASS).
- 3.6 million acres of certified organic cropland, 2021, plus 1.3 million acres of certified organic pastureland/rangeland (USDA NASS).
- 79% growth in certified organic cropland acreage between 2011 and 2021 (USDA NASS).
- 61% of organic farmers report farming as their primary occupation; average age 52.7 years (USDA NASS, 2021).
Full detail, including state-by-state breakdowns, is in the USDA NASS 2022 Census Organic Highlights report. The Census of Agriculture runs every five years — the 2022 census is the current dataset, and the next full census is 2027; NASS publishes interim annual survey estimates in the years between.
Yield Baseline for Comparison
If your model includes a grain crop analog or you want a national yield to compare a classroom trial against, USDA NASS reported 61.3 bushels per acre for US wheat grain yield in 2024 (USDA NASS Crop Production 2024 Summary). USDA NASS releases this Crop Production annual summary every January covering the prior year, plus monthly Crop Progress reports during the growing season — check nass.usda.gov Quick Stats for the current year’s figure by the time you read this.
One caveat worth stating plainly: USDA NASS tracks major commodities — corn, soy, wheat — at the national and state level. It does not publish yield data for the crops most school models actually grow (beans, radishes, lettuce, basil). For those, your own weekly measurements ARE the dataset — track height, leaf count, and harvest weight yourself, since no federal number exists to compare against at that scale.
Project Objective and Scope: Why Model Projects Matter
The core aim of any agriculture model project is to illustrate the principles of sustainable and natural farming — improving soil fertility, promoting biodiversity, conserving water — at a scale a classroom can build and measure in a few weeks. Done well, the model does five things:
- ✔ Demonstrates the integration of farm components: beds, irrigation, compost, mulch, companion crops, beneficial organisms.
- ✔ Grounds the demonstration in a real national or state figure, not just a general claim about sustainability.
- ✔ Provides practical experience in soil analysis, crop selection, pest management, and yield estimation.
- ✔ Scales from a small classroom tabletop display to an outdoor plot, depending on space and budget.
- ✔ Prepares students to reproduce the practice in a school garden or home plot after the project ends.
Choosing a topic — like “sustainable agriculture” broadly — without picking ONE measurable practice to model. Judges reward a project that isolates one variable (cover crop vs. bare soil, drip vs. hand-watering) and reports a number, not a project that tries to illustrate everything at once.
Key Principles a Farm Model Project Should Demonstrate:
- 🌱 Soil organic matter enrichment (compost/mulch), benchmarked against the 4.7% national cover-crop rate above.
- 💧 Water conservation and management (drip irrigation/mulching).
- 🐞 Biodiversity and beneficial organisms (companion plants, insect habitats).
- 🌾 Crop rotation and selection (legumes for nitrogen, mixed beds for pest control).
- 🗂️ Data-driven monitoring (charts, growth records, a stated comparison baseline).

Site Selection and Layout Guide
A well-chosen site and layout are the first real decisions in a sustainable agriculture model project. Whether it’s a tabletop classroom display or an outdoor plot, start with a sunlit area with good drainage, then follow this sequence:
- Map Your Layout: Draw and label the design. Include:
- 🌱 Crop beds (raised, in-ground, or stepped for a terrace model).
- 🧺 Compost and mulch zone (sheltered, accessible for turning).
- 💧 Water source (barrel, basin, or drip line).
- 👁️ Observation zones for soil moisture, temperature, and pest activity checks.
- Bed Arrangement: Rows, guilds, or step patterns for a terrace/step model.
- Drainage Channels: Mark with string or paint; explain how they prevent waterlogging.
- Mulch and Compost Area: A corner or side zone for decomposition.
- Diagrams: 2D or 3D layout showing crop spacing and companion planting.
Site mapping and layout planning are the same skills used in precision agriculture and geospatial land-use planning on real farms — early exposure in a school project is directly transferable to agronomy and GIS coursework later.
Soil Health and Media: The Foundation
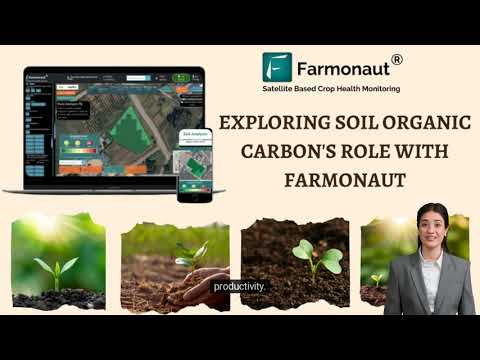
Healthy soil is the foundation of any agriculture model for school project. Start by testing your local soil or blending your own mix to demonstrate the core principles behind that 18.0-million-acre cover crop figure cited above — cover crops work because they build the same organic matter you’re about to add by hand.
- Test Soil pH and Texture: Inexpensive kid-friendly test kits are available at most garden centers.
- Incorporate Organic Matter: Mix in compost or leaf mold to boost fertility and show structure improvement.
- Layered Soil Profile: Build a visible model — mulch on top, roots in the middle, subsoil at the base.
- Soil Biota and Structure: Highlight earthworms and microbes, and their role in moisture retention.
- 🔬 Test for pH, nutrient levels, and moisture.
- 🌱 Add compost and organic mulch for richer soil.
- 📊 Track water retention and its effect on plant growth over 2–4 weeks.
- 🐛 Show beneficial organisms like earthworms and fungi at work.
Crop Selection and Planting Plans
For a natural farming model project, choose resilient, locally adapted varieties that demonstrate biodiversity, pest control, and soil health together:
- 🌱 Legumes (beans, peas) for nitrogen fixation.
- 🌾 Root crops (radish, carrot) for deep soil penetration.
- 🥗 Leafy greens (lettuce, spinach) for quick harvests inside a 2–3 week window.
- 🌿 Aromatic herbs (basil, marigold) for natural pest deterrence.
Companion Planting and Guilds
Companion planting grows plants together that benefit each other, as in the “three sisters” method (corn, beans, squash) used historically across North American farming systems. These guilds reduce pest pressure, improve yields, and raise plot-level biodiversity.
Creating a Planting Timeline
- Draw a seed-to-harvest storyboard for each crop.
- Label companion pairs and crop-family rotations across the project period.
- Document growth stages: germination, leaf growth, flowering, harvest.
Tracking growth data in an agriculture model project is where the science-fair value actually sits — a project with three weeks of measured leaf counts and harvest weights outperforms one with only a finished photo, because it has a comparison to defend.
Water Management in Farm Model Projects
Efficient water use is a pillar of every sustainable agriculture project idea on this list. In your model:
- 💧 Install a simple drip line or watering-can setup to demonstrate slow, controlled moisture delivery.
- ☔ Rainwater harvesting: collect and store water in a barrel, then use it for irrigation.
- 🌿 Mulch the surface to cut evaporation and regulate soil temperature.
- 🔍 Add a moisture check — a simple probe or the classic soil-feel test — to decide when to irrigate.
Want to extend the model with remote monitoring?
Farmonaut’s Agro-Admin Platform provides large-scale farm management, soil moisture, and crop health analytics — a way to show a class how the same drip-irrigation principle scales to a real commercial field.
Pest Management and Biodiversity
Demonstrate non-chemical pest control and biodiversity in your model:
- 🪲 Beneficial Insects: ladybugs, lacewings, and spiders control aphids and caterpillars naturally.
- 🌼 Trap Crops: marigold planted nearby draws pests away from vegetables.
- 🌾 Polycultures & Rotation: mixing crop families breaks pest and disease cycles.
- 🌻 Habitat Features: brush piles or flower strips support helpful insects.
- ✋ Manual Removal: students observe and remove pests during regular monitoring.

See how traceability solutions from Farmonaut support transparent pest and resource records at commercial scale — the same record-keeping habit a school project’s pest log is teaching in miniature.
Have students build a photo guide of local pests and beneficial insects found on-site. It deepens observation skills and turns the display into an interactive ecosystem lesson rather than a static poster.
Waste Management and Composting Integration
Composting and mulching turn kitchen and garden waste into organic matter for your model. Steps:
- Collect green materials (vegetable peels, fresh clippings) and brown materials (dry leaves, cardboard).
- Add to a bin or pile in the dedicated zone; keep it moist, not soggy.
- Turn the pile weekly to supply oxygen for decomposition.
- Once dark and crumbly, use it as organic fertilizer or mulch on the beds.

- 🌱 Mulching reduces weeds, conserves moisture, and maintains soil structure naturally.
- ✅ Compost keeps nutrients cycling on-site and reduces waste sent to landfill.
For a step beyond the classroom, Farmonaut’s Carbon Footprinting Service shows how composting and soil-carbon practices are measured and reported at the farm level.
Skipping the “turning” step in composting leads to slow decomposition and bad odors. Build a weekly turning day into the project schedule from day one.
Soil Amendment & Water Calculator for Your Model
Use this calculator to size compost, mulch, and water for your own bed dimensions instead of guessing at the ranges in the comparison table above.
Interactive
Run your own numbers
Assumes a 25% compost-to-soil mix by volume, 2 lb of mulch per square foot of bed surface, and a rough 0.62 gallons of water per square foot per watering — figures drawn from common raised-bed gardening guidance, not a controlled US field trial. It excludes rainfall, wind evaporation, and container material (fabric beds dry faster than wood or plastic). Adjust the depth and dimensions to match your actual bed and re-check soil moisture by hand before trusting the schedule.
Monitoring, Data Collection, and Reporting
Observation and data collection are the parts of an agriculture model project that turn it from a craft display into a science project, As students compile observations and prepare project reports, using a grammar checker can help improve clarity, correct writing mistakes, and present research findings in a more professional and readable format:
- 📏 Record plant heights, leaf counts, and health indicators weekly.
- 💦 Measure soil moisture and temperature with a probe or thermometer.
- 🐛 Log pest sightings and the natural control action taken.
- 🌾 Track harvest dates and yields — count or weight of produce.
- 📉 Analyze trends: did mulch reduce watering frequency? Did companion planting raise yield versus a single-crop control bed?
Summarize this as charts, tables, and a short report for the display. For a digital-forward class, use Farmonaut's API (API Link) to introduce real-time crop monitoring concepts, with developer documentation at API Docs.
Ethics, Safety, and Sustainability Principles
- ⚠ Follow local school biosafety guidelines — use only sanctioned fertilizers and amendments.
- ⚒ Minimize chemical inputs; rely on organic, natural farming methods for safety and comparability.
- 💧 Promote water conservation and responsible use at every step.
- 🌿 Discuss the social angle: food security, waste reduction, and community resilience.
- 📗 Connect the model back to the national figures above — ask students what a 79% jump in organic cropland acreage (2011–2021) means for future food systems.
Presentation, Demonstration, and Outreach
Effective presentation turns a farm project idea for school into a real educational showcase:
- 🎤 Host a short session explaining the model's flow, components, and sustainability lessons.
- 🌾 Demonstrate mulching, seedling planting, compost turning, and soil testing live.
- 📋 Prepare visual boards, labeled diagrams, and a photo journal.
- 👨👩👧 Invite community members or school visitors for hands-on activities.
- 🌓 Share results in a written report with clear, data-backed conclusions and named sources.
- 📢 Posters and simple charts make complex ideas scannable at a glance.
- 🌱 Sample crops and a soil-layer display can be handled and discussed interactively.
- 🤝 An outreach day brings in family and community engagement beyond the classroom.



All 7 Ideas — Detailed Build Notes
-
Sustainable Soil Health Model
- Foundation: soil health, organic matter, biodiversity, minimal inputs.
- Key Activities: raised bed, compost and mulch zones, companion planting, soil testing, weekly monitoring.
- Educational Value: demonstrates the same organic-matter buildup behind the national move from 2.7% to 4.7% cover-crop adoption between 2012 and 2022.
-
Terrace / Step Farming Model
- Concept: mimics terrace or contour farming on slopes to cut erosion and hold water.
- Execution: cardboard or plank step levels; plant a mix of crops; monitor runoff, moisture, and yield per step.
- Benefits: teaches land management, drainage planning, and slope adaptation.
-
Composting and Mulching Model
- Core Focus: organic waste decomposition and soil enrichment.
- Student Activities: compost bin setup, weekly turning, moisture control, applying finished compost.
- Learning Outcome: waste management and closed-loop farming principles.
-
Drip Irrigation and Rain Barrel Model
- Objective: raise water-use efficiency with precision irrigation methods.
- Project Steps: small drip or micro-sprinkler system, plus a rain barrel for harvested water.
- Impact: reduces water waste and teaches resource management directly.
-
Polyculture Companion Planting Bed
- Principle: multiple compatible crops together for natural pest control and higher land productivity.
- Demonstration: beans-and-corn combos, marigold near tomatoes, basil with lettuce.
- Benefits: higher biodiversity, improved yields, hands-on ecological balance.
-
Soil Profile and Health Monitoring Kit
- Focus: soil testing — pH, organic matter, nutrient levels, moisture.
- Steps: sample soil from different plots, run test kits, track results over 2–3 weeks.
- Skill Development: scientific method, observation, environmental monitoring.
-
Beneficial Insect and Pest Management Display
- Activity: a visual or 3D display of crop pests and their natural enemies, charting biological control.
- Materials: model insects, field-collected samples, photo guides for peer engagement.
- Learning: visualizes ecosystem links and reduces reliance on chemical control.
Students who complete agriculture model projects build real STEM skills — a Nature Scientific Reports study found university extension-linked agriculture education programs improved efficient and sustainable agriculture outcomes by 3.3% (2024), showing the classroom-to-field pipeline is measurable, not just anecdotal.
- ✔ Builds environmental awareness from an early age.
- 📊 Promotes evidence-based learning using growth and yield data.
- 🌿 Fosters teamwork — group work builds collaboration skills.
- 📈 Prepares students for careers in agriculture, environmental science, and STEM.
- 🌱 Benefits local communities through applied school and public garden projects.
How Farmonaut Supports Agriculture Model Projects
Farmonaut's satellite-based tools and apps let schools, students, and communities connect a hands-on model to the same technology used on commercial farms:
- 💡 Monitor soil health, crop growth, and field changes in near real-time using multispectral imagery and dashboards.
- 💧 Enable precision irrigation and moisture management decisions in both model projects and real school gardens.
- 🔗 Access blockchain-based traceability tools for authentic product and resource tracking — a practical skill for future scientists.
- ⚡ Use AI-based advisory to plan crop cycles and cut resource waste, in line with the sustainability trends documented above.
Try the web, Android, or iOS apps to see how field insights and tailored recommendations can enhance any agriculture model for school project. For more advanced classroom or district use, see Crop Loan & Insurance Solutions to learn how agricultural verification works in financial and educational settings.
Managing larger or multiple model plots across a school or district? Fleet Management and Carbon Footprinting services make advanced projects scalable.
Pair your model with satellite imagery, weather forecasting, and AI-based recommendations from Farmonaut's platform to show judges how the small-scale demonstration maps onto real commercial monitoring.
Frequently Asked Questions (FAQ)
Q1: What is an agriculture model project?
It's a scale demonstration — built with soil, seeds, compost, and simple tools — that uses organic matter, crop diversity, and minimal chemical input to teach sustainable farming principles, soil health, water conservation, and beneficial-organism integration.
Q2: What are good agriculture project ideas for a school science fair?
The seven in the comparison table above cover the main measurable practices: soil health, terrace/step farming, composting, drip irrigation, companion planting, soil monitoring, and pest management. Pick one, isolate a single variable (treated bed vs. control bed), and measure it over 1–4 weeks.
Q3: How can schools benefit from agriculture model projects?
Students gain practical science knowledge, critical thinking, teamwork, and hands-on experience in sustainability and data gathering — the same extension-linked programs a 2024 Nature Scientific Reports study associated with a 3.3% improvement in efficient and sustainable agriculture outcomes.
Q4: What is step/terrace farming, and how do I model it?
Step farming (or terrace farming) arranges crop beds on a slope in "steps" to cut erosion and save water. For a model, use cardboard or planks to build step levels, plant in rows, and observe runoff and soil moisture per level.
Q5: How does Farmonaut support education-focused agriculture models?
Real-time crop and soil monitoring, resource tracking, and advisory tools via apps and APIs fit directly into an agriculture model for school project — making farm data accessible and understandable at classroom scale.
Q6: Is it expensive to build a classroom or outdoor agriculture project model?
No. Most projects run $8–$30 using local materials — soil, seeds, compost, recycled containers, and basic measuring tools. See the comparison table above for per-project ranges; sourcing materials locally keeps cost down.
Q7: Where do I find current US cover crop and organic farming statistics for my report?
USDA NASS runs the Census of Agriculture every five years (2022 is the current dataset; next is 2027), with interim annual survey estimates published between censuses. Start at nass.usda.gov and its Quick Stats database for the most current figures on adoption rates, organic acreage, and yields by state.
Q8: Can technology and satellite tools help school projects?
Yes. Satellite imagery and AI-based analytics from Farmonaut add a digital layer to school agriculture model projects — students learn modern tech skills while improving farm management and sustainability outcomes.
An agriculture model project is strongest when it ties a hands-on demonstration to a real, cited USDA figure — 4.7% national cover crop adoption, 79% organic cropland growth, $9.6 billion in organic sales — rather than treating "sustainability" as a slogan.
Conclusion
Building an effective agriculture model for school project brings together science, sustainability, and community engagement. By focusing on soil health, water management, crop diversity, composting, and monitoring — and by anchoring each to a real USDA NASS or USDA ERS figure — students and educators create a working demonstration, not just a display.
With the build steps, cost table, and calculator above, any school or community can put together a practical agriculture model project — from a tabletop simulation to a full outdoor plot. For those ready to add a technology layer, the Farmonaut platform offers affordable, real-time tools to bridge classroom and field.
Ready to start? Download the app or visit the web platform to bring real farm data into your next project.

Discussion
Questions, corrections or field experience? Share them below. First-time comments are reviewed before they appear, and your email is never published.
No comments yet. Be the first to add a question or your experience.

 Rashail Infotech
 Unifrutti Gulf
 Deluxe Conseil
 TVS Electronics
 BW Pipelines
 WICO
 Gen Chayat
 Chimera Innovation
 SkyHarvest
 Polaris Digitech
 Teledarbas
 Wild Oak Farm
 SFX
 Doodlakine
 Exurbia Geospatial

 Licence holder · Niger · Gold










