

Customer case study · Olives
Olive Fruit Fly Monitoring: A Greek Olive Grove Case Study
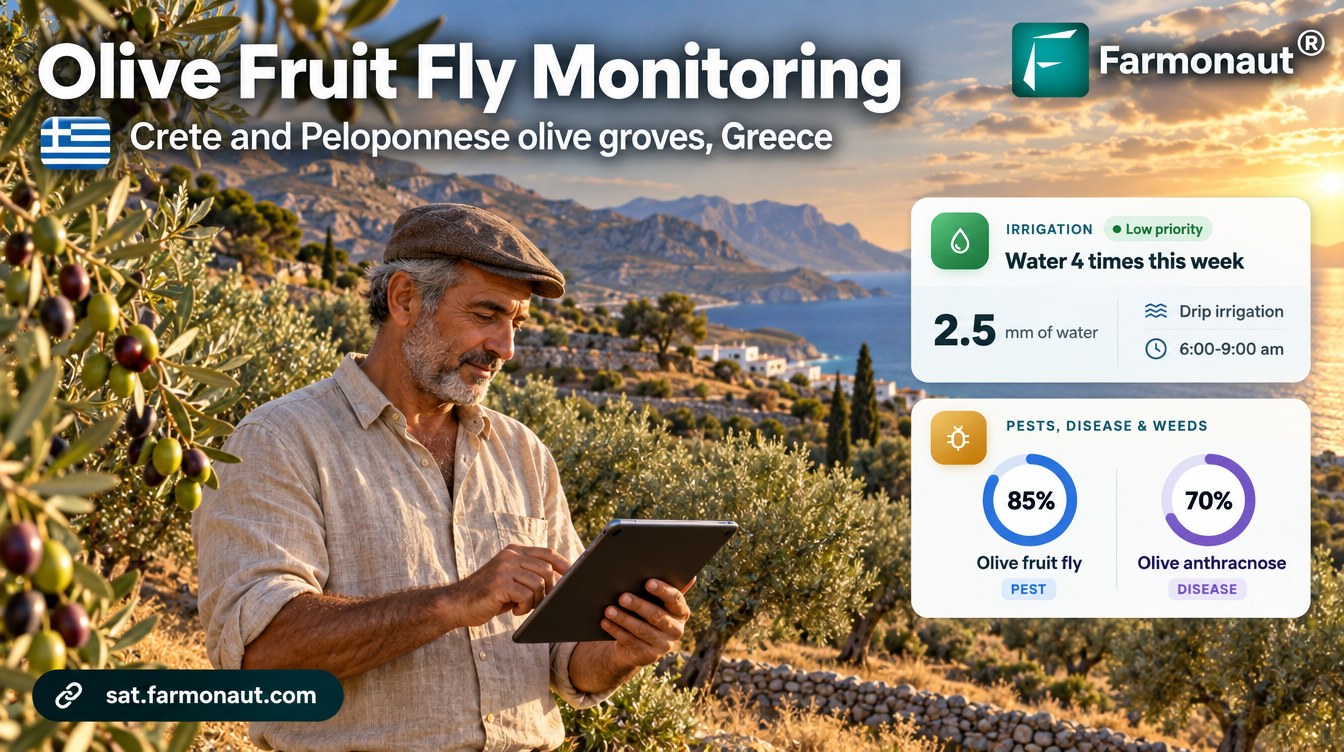
Olive fruit fly monitoring by satellite scored fly risk at 88% during ripening and anthracnose at 76–80% across seven Greek olive groves, and planned no water on 47% of grove-days, about half the water of a same-dose routine.
Key takeaways
- Three growers in Crete, the western Peloponnese and the Ionian Islands received 401 satellite advisories for seven olive groves (about 5.7 ha) from December 2025 to October 2026.
- Olive fruit fly risk averaged 92% at pit hardening in June and 88% during ripening in September and October.
- Olive anthracnose risk rose to 76% in September and 80% in October; peacock spot peaked at 94% in February.
- 795 of 1,677 planned grove-days (47%) had no irrigation, about 47% less water than a same-dose routine.
- All 1,432 nutrient recommendations included an organic source, and most fertilizer was paused at ripening.
In this article
- The olive groves and the brief
- Why Greek olive groves need close watching
- How olive fruit fly monitoring works from space
- A season of advisories, stage by stage
- Olive fruit fly monitoring results: fly, anthracnose and peacock spot
- Water: almost half the days planned dry
- Nutrition, soil and yield
- Olive groves in Western Australia and Tunisia
- What other olive growers can take from it
- FAQ
Olive fruit fly monitoring by satellite gave three olive growers in Greece a fresh pest-risk score, irrigation plan and nutrient plan for each grove every few days. As the fruit ripened in September and October 2026, the modelled olive fruit fly risk averaged 88% across seven groves in Crete, the Peloponnese and the Ionian Islands, and olive anthracnose risk rose to 76% and then 80%. Over the season the advisories also planned no water on 47% of grove-days.
This case study walks through 401 advisories sent to these growers from December 2025 to October 2026. Most of the data comes from four small groves on Crete. It shows what the satellite saw, what each advisory recommended, and how other olive growers can use the same data. All figures come from the growers’ advisory records. Risk scores are modelled probabilities, not confirmed outbreaks or trap counts, and the water figures are planned amounts, not metered use.
The olive groves and the brief
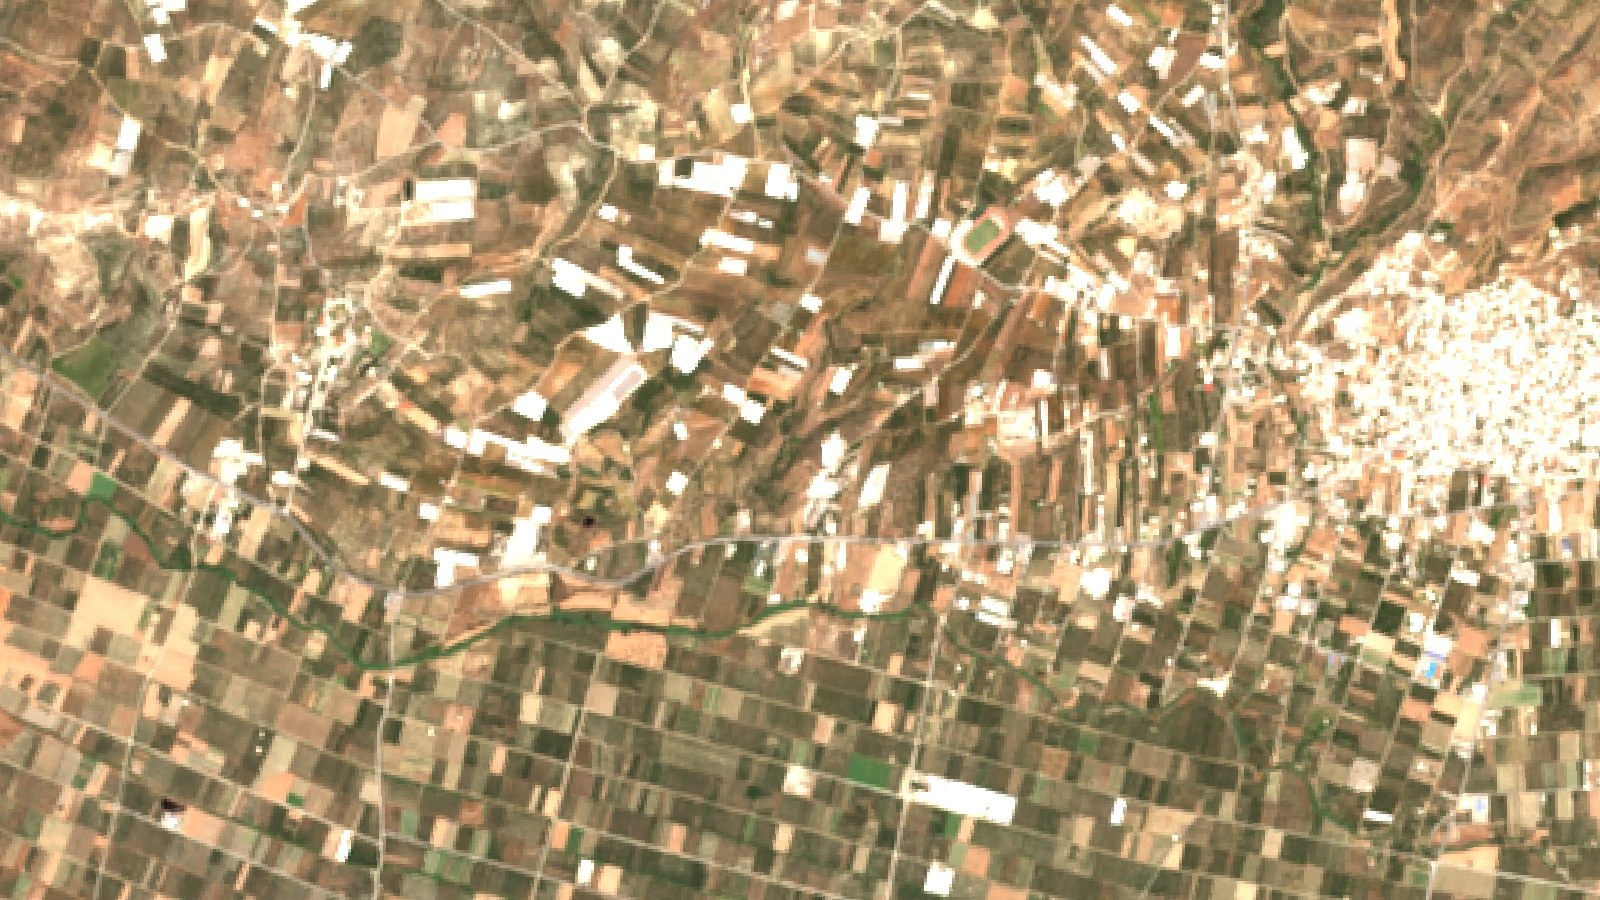
The main grower farms four olive groves on the north side of central Crete. They are small, as many Cretan groves are: from about 0.13 to 2.4 hectares each, and about 3.1 hectares in all. Two more groves of about 2.3 hectares belong to a grower in the western Peloponnese, and a third grower has a small grove of about 0.27 hectares on one of the Ionian Islands. Each grove was drawn once in the Farmonaut app, and advisories have arrived every few days since then.
Where the olive groves are
Crete and the Peloponnese shaded; markers show the approximate area only
Olive growers in Greece face the same jobs every year. The fruit fly must be kept below damaging levels from early summer to harvest. Fungal diseases follow the autumn and winter rains. Water is short in a long, dry summer. The growers wanted one place to see canopy health, irrigation needs and pest and disease risk for every grove, before walking the rows.
| Item | Detail |
|---|---|
| Regions | Crete (main grower), western Peloponnese and the Ionian Islands, Greece |
| Crop | Olives, mostly for oil |
| Groves | 7 groves, about 5.7 ha in total |
| Grove sizes | About 0.13 to 2.4 ha each |
| Irrigation | Drip |
| Monitoring period | December 2025 to October 2026 |
| Advisories | 401 in total (226 for the Crete groves) |
| Soil (modelled) | pH 7.4 to 7.8, low organic carbon, low to moderate salinity |
Why Greek olive groves need close watching
Olives are one of the largest crops in Greece. According to Eurostat crop statistics, Greece harvested about 1.17 million tonnes of olives for oil from about 738,000 hectares in 2025, an average of about 1.6 tonnes per hectare. Output swings from year to year: the same series shows about 776,000 tonnes in 2017 and about 1.35 million tonnes in 2024.
Chart
Greece: olives harvested for oil
Thousand tonnes per year
The olive fruit fly (Bactrocera oleae) is a large part of that risk. The UC IPM program calls it the most damaging pest of olives in southern Europe, North Africa and the Middle East. A member of a Cretan farmers’ cooperative, quoted by the EU CAP Network, puts the fly’s economic losses above 30% in Greece. That is why Greek regions run an area-wide control programme each summer. In 2026 the Region of Crete set out its trap network from 1 June and started bait spraying in the earliest coastal areas of Heraklion on 16 June, weather permitting.
A grower still has to decide what happens in each grove. Area-wide spraying and trap counts cover a district. A grove-level risk score helps a grower decide which groves to check first, and when. For a broader guide to the season’s tasks, see our article on olive grove management.
How olive fruit fly monitoring works from space
A satellite cannot see a fly. It sees the trees and the ground around them. Each advisory starts with fresh images of the grove. The Sentinel-2 mission has a revisit time of five days with its two satellites and 10-metre detail in the visible and near-infrared bands. From these bands the system works out vegetation indices such as NDVI, which compares red and near-infrared light reflected by the land surface to show how much green leaf is present.
Infographic
How each grove advisory is built in 4 steps
- 1Satellite passSentinel-2 images each grove every few days; Sentinel-1 radar covers cloudy dates.
- 2Read the canopyNDVI and moisture indices show vigour and wetness grove by grove.
- 3Add weather and stageThe weather outlook and growth stage set water need and pest and disease risk.
- 4Grove planIrrigation, risk scores with organic options, nutrients and a yield estimate.
When cloud hides a grove, the system switches to radar. Sentinel-1 radar can image the ground by day or night, whatever the weather, so 34 of the Greek advisories in this study used radar data on cloudy dates.
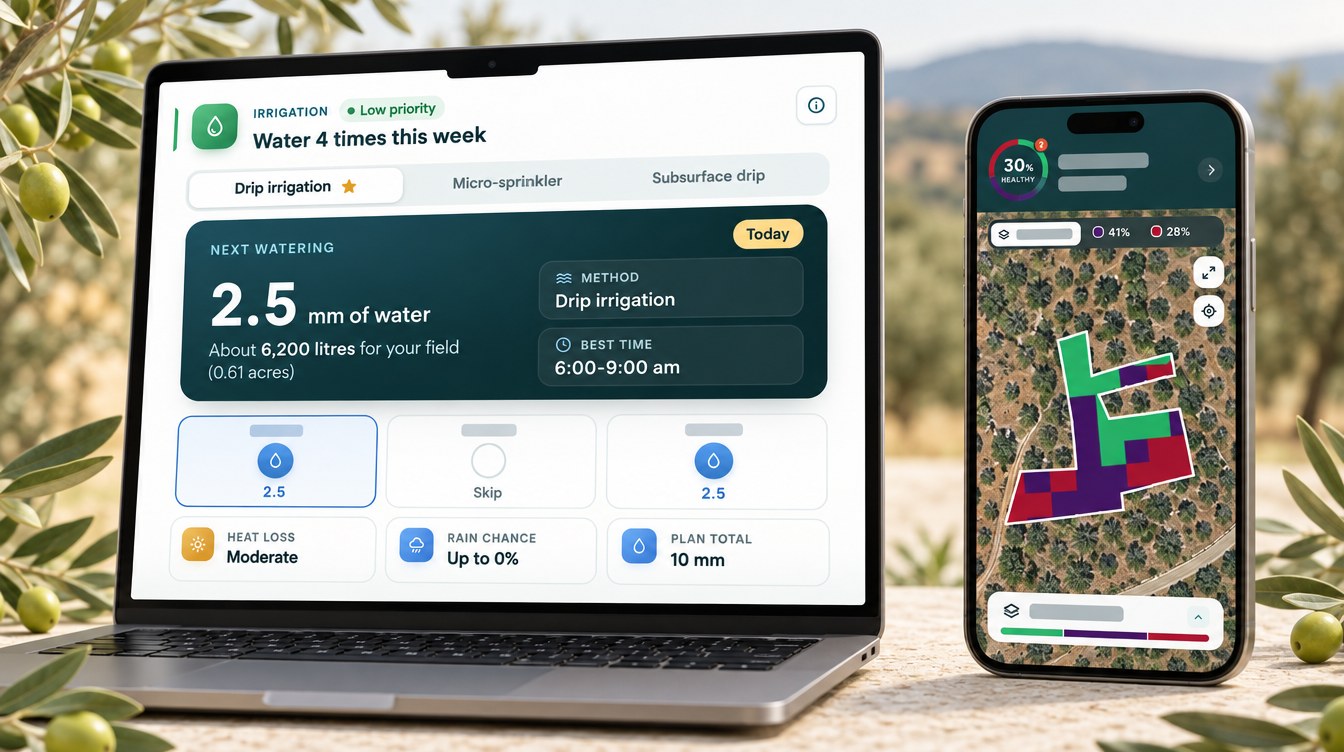
The images are combined with the weather outlook, the grove’s growth stage, and what is known about olive pests and diseases in that region. Ripening fruit, warm autumn days and humid nights raise the fruit fly score. Wet, mild weather raises the scores for fungal diseases. The result is one advisory per grove with five parts: an irrigation plan for the next week, pest and disease risk scores with organic and conventional options, weed risk, a fertilizer plan, and a yield estimate.
A season of advisories, stage by stage
The Crete groves joined in December 2025, and the Peloponnese groves in January 2026, so the data covers one full growing season up to harvest. The growth stage in each advisory followed the trees through the year.
▶ What NDVI values from −1 to +1 mean on a real field · 2:33
| Months | Main stage reported | What the advisories focused on |
|---|---|---|
| Dec to Jan | Winter dormancy | Peacock spot after rain, almost no irrigation |
| Feb to Mar | Bud burst and bud development | Peacock spot, olive knot and olive moth risk |
| Apr to May | Flowering and fruit set | Olive moth, first fruit fly scores, rising water need |
| Jun to Jul | Pit hardening | Fruit fly risk above 90%, highest planned water |
| Aug | Fruit enlargement | Fruit fly, black scale, canopy stress |
| Sep to Oct | Ripening and veraison | Fruit fly and anthracnose, fertilizer paused, harvest timing |
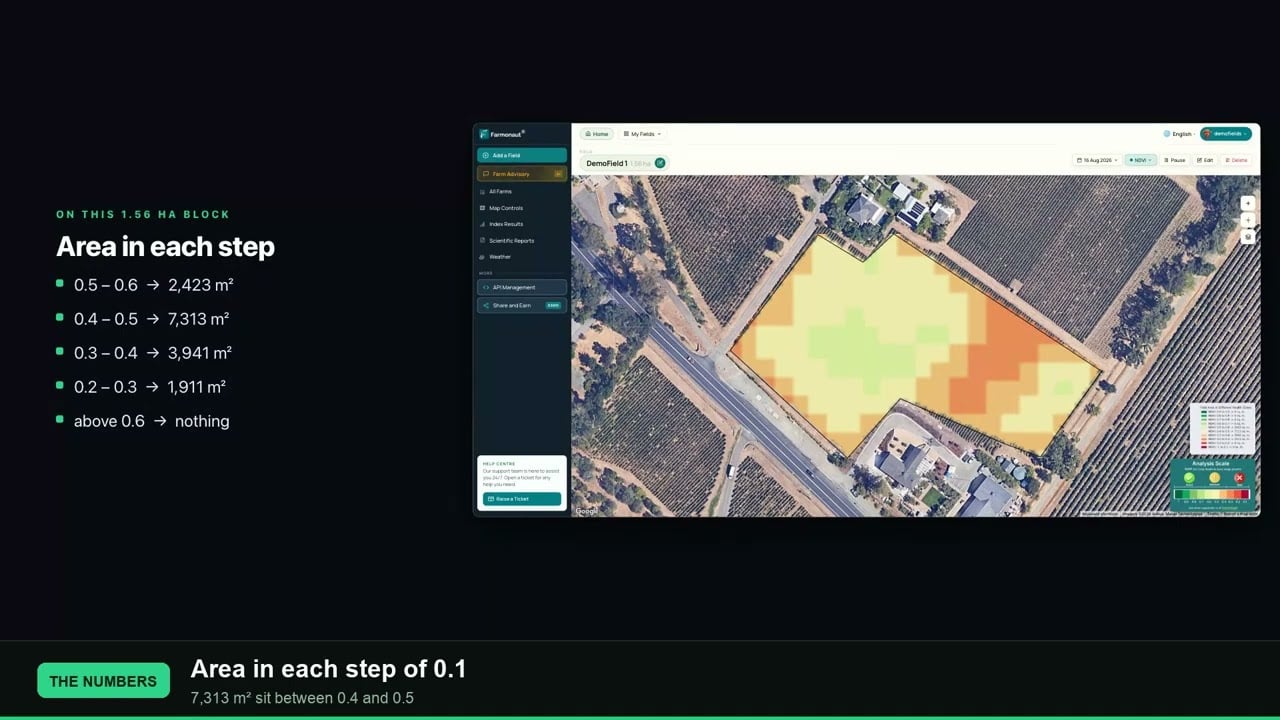
The NDVI readings tell a second story. Over the dry summer, the canopy reading sat below the range the advisories expected for the stage, which was usually given as about 0.45 to 0.60. The Crete groves averaged 0.39 to 0.43 from June to September, and the Peloponnese groves 0.38 to 0.46. In October, as autumn began, the readings rose again. By 18 October two Crete groves read 0.59 and 0.66, partly from green ground cover between the trees. Short dips to about 0.20 on single dates were treated as cloud effects, because the next image recovered.
Chart
Canopy NDVI by month, May to October
Average NDVI per advisory, by region
Olive fruit fly monitoring results: fly, anthracnose and peacock spot
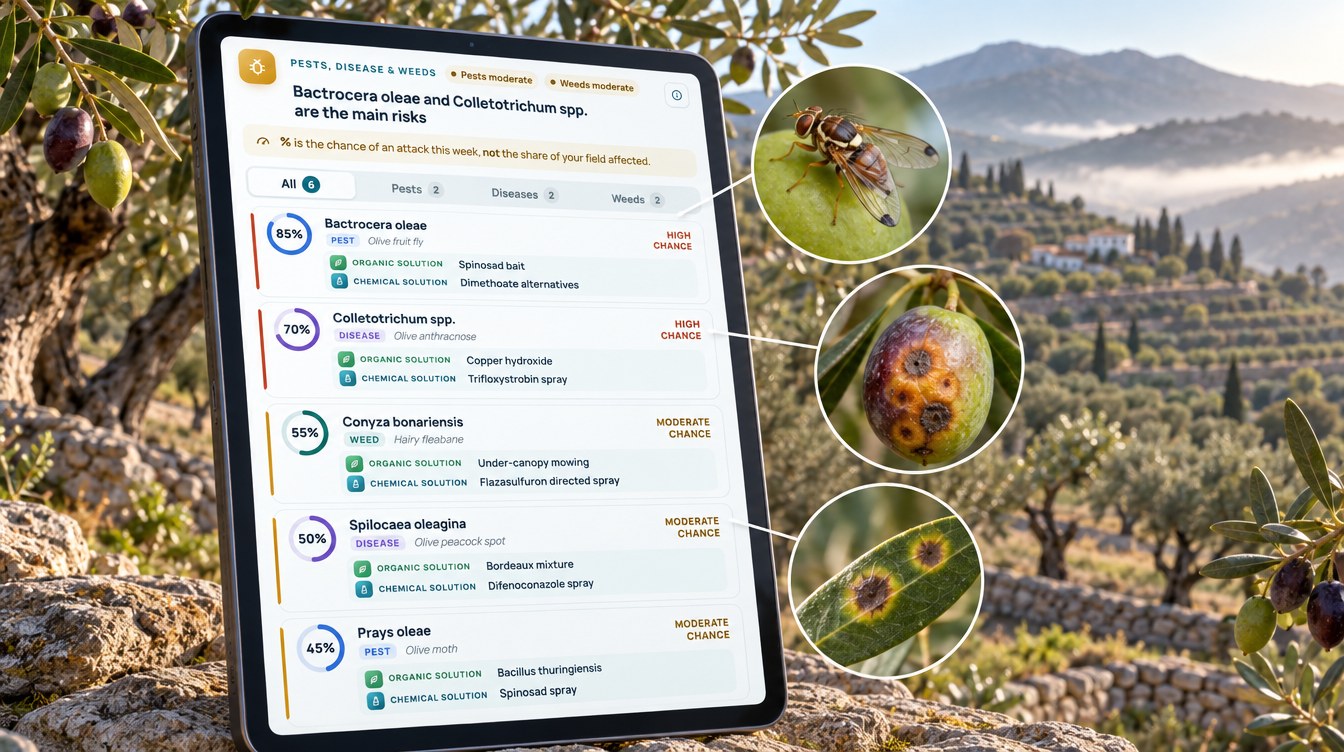
Across the seven Greek groves, the threats the advisories scored most often were peacock spot (339 times), olive fruit fly (274), black scale (249), olive anthracnose (208), olive moth (159) and olive knot (140). Each score is a modelled probability built from the grove’s canopy, moisture and weather data. It tells the grower where and when to look first, and it does not replace traps or a check of the fruit.
The scores moved with the season. Peacock spot led in winter and spring. The fruit fly score climbed in May and stayed high to harvest. Anthracnose rose again as the fruit ripened in autumn.
Olive fruit fly
The fruit fly was rarely scored before May, when the fruit was too small to attack. From May to October it was scored in almost every advisory. Its monthly average was 86% in May, peaked at 92% in June during pit hardening, and stayed at 88% from August to October. The UC IPM guidance explains why the ripening months matter: when the larvae feed, microbes get into the fruit, which then rots and gives lower-quality oil.
For each grove, the advisory offered a spinosad bait as the organic option and a conventional bait spray as the other, with a reminder to use one, not both. The latest Crete advisory also suggested checking traps weekly and planning an early harvest of infested fruit. Always follow the product label and local rules, and check the timing of your regional bait-spray programme.
Olive anthracnose
Anthracnose, caused by Colletotrichum fungi, rots ripening fruit and lowers oil quality. A review in Molecular Plant Pathology explains that infections on the fruit surface remain quiescent until fruit maturity, when the symptoms appear. The scores followed that pattern. The monthly average was 61% to 72% through the summer, then 76% in September and 80% in October, with single readings up to 91%. The advisories linked the October rise to moist canopies after autumn rain and suggested a protective copper treatment before rain as the organic option.
Peacock spot and olive knot
Peacock spot (Spilocaea oleagina) was the threat scored most often. Its score averaged 92% in January and 94% in February, then fell to 52% to 62% in the hot summer months. That fits UC IPM’s description of the disease: new infections come mostly with rain in fall and winter, and the disease is inactive during warm, dry summers. UC IPM suggests a preventive treatment in late October, before winter rains begin, where leaf symptoms have been seen.
Olive knot was scored 140 times, mostly from December to April, with monthly averages of 64% to 78%. UC IPM explains that the bacteria need openings such as leaf scars, pruning wounds or bark cracks made by freezing, and it lists the Koroneiki oil variety among the most susceptible. It suggests pruning in the dry season, so winter scores are a reminder to time pruning with care. Our guide to organic and chemical control of olive knot disease covers the options.
Chart
Modelled risk by month, May to October
Average risk score across seven Greek groves, %
Water: almost half the days planned dry
The irrigation part of each advisory plans a drip amount for each of the next several days. When advisories overlapped, we kept the newest plan for each grove and day. That left 1,677 grove-days of planned irrigation across the seven groves. On 795 of them, or 47%, the advisory planned no water at all.
Chart
Rainfall vs planned drip by month, Crete
mm per month; long-term mean rainfall vs advisory plan per grove
The plan follows the trees’ water use and the rain. The FAO irrigation guide gives olive groves with 40% to 60% ground cover a crop coefficient of 0.65 at the start of the season and 0.70 in mid-season and at the end, so olives use water at a fairly steady rate compared with their reference crop. Most of the swing in the plan comes from the weather. The Hellenic National Meteorological Service describes a cool, rainy season from mid-October to the end of March and a warm, dry season from April to October. At the Heraklion Airport station, mean rainfall is about 95 mm in January but under 3 mm a month from June to August (1991–2020 normals).
The advisories followed that pattern. In the Crete groves the planned daily amount averaged 0.1 to 0.6 mm in winter, rose to 2.3 mm in May, and peaked at 3.6 mm in June. Across all seven groves, 95% of grove-days in January were planned dry, against only 16% in June.
Planned water compared with a daily routine
To compare, we worked out what each grove would have received if it had been given its own average watering dose on every planned day. Against that same-dose routine, the advisory plan used 43% to 53% less water per grove, and about 47% less across all seven groves. In the units Greek growers use, the four Crete groves were planned about 3,840 to 4,660 m³ per hectare from mid-December to late October, against about 8,070 to 8,250 m³/ha with a same-dose routine. The two Peloponnese groves were planned about 5,320 to 5,830 m³/ha. This is a comparison of plans, not a metered saving, but it shows how much of the season’s water depends on timing.
Chart
Season water per grove: plan vs same-dose routine
Planned m³ per hectare, Dec 2025/Jan 2026 to Oct 2026
Nutrition, soil and yield
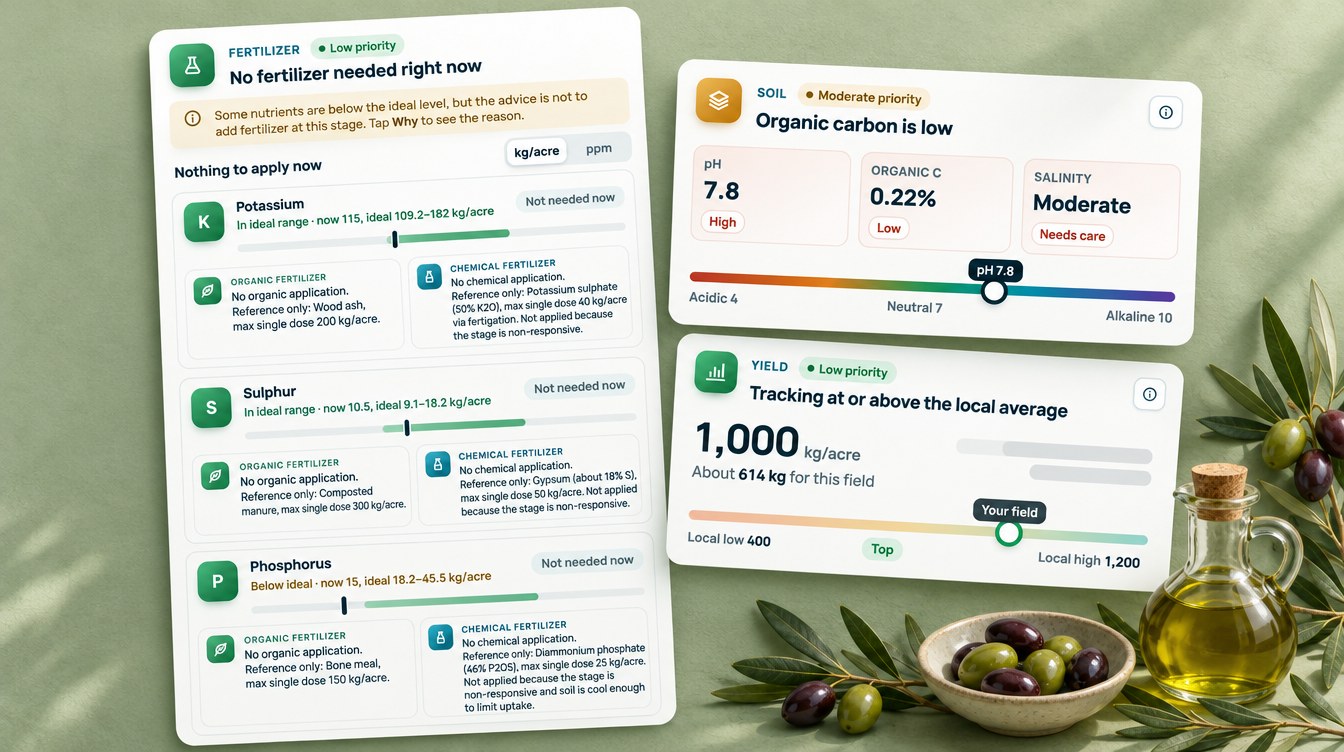
The fertilizer part of each advisory compares the grove’s modelled nutrient levels with the ideal range for the current stage, then gives a rate for each nutrient that is short. Across the season the advisories gave 1,432 nutrient recommendations with a rate above zero, and every one of them came with an organic source as well as a conventional fertilizer. The organic sources included bone meal, wood ash, composted manure, seaweed extract and olive pomace compost.

▶ How a Farmonaut satellite farm advisory is read, section by section · 9:13
The advisories also knew when to stop. In October, with the fruit ripening, only 42 of 165 nutrient lines asked for any fertilizer. The latest Crete advisory gave the reason: extra nitrogen at this stage would push late shoot growth, delay ripening and lower oil quality.
The soil section rated all seven groves low in organic carbon, at 0.13% to 0.24%, with pH 7.4 to 7.8, which is typical of calcareous Mediterranean soils. That is why compost-based options came up often: they feed the trees and build soil at the same time. The yield card put the latest modelled estimates at about 1,060 to 2,600 kg of fruit per hectare, with the four Crete groves at the top of that range, at about 2,200 to 2,600 kg/ha. Harvest was expected from November. These are modelled estimates, not forecasts.
Olive groves in Western Australia and Tunisia
The same system watches olive groves in other Mediterranean-type climates. Two of them show how the risks shift with place and season.
In the south-west of Western Australia, a grower has two olive groves of about 5.4 hectares in total. In October 2026, spring in the southern hemisphere, the advisories reported flowering and fruit set. Here the main threats were different from Greece: peacock spot at 65%, black scale at 61% and olive lace bug at 58% in October, with almost no fruit fly scores. The International Olive Council’s World Olive Catalogue describes Australia as the only olive-growing zone free of the olive fruit fly. The advisories planned no water on 43% of grove-days for these two groves.
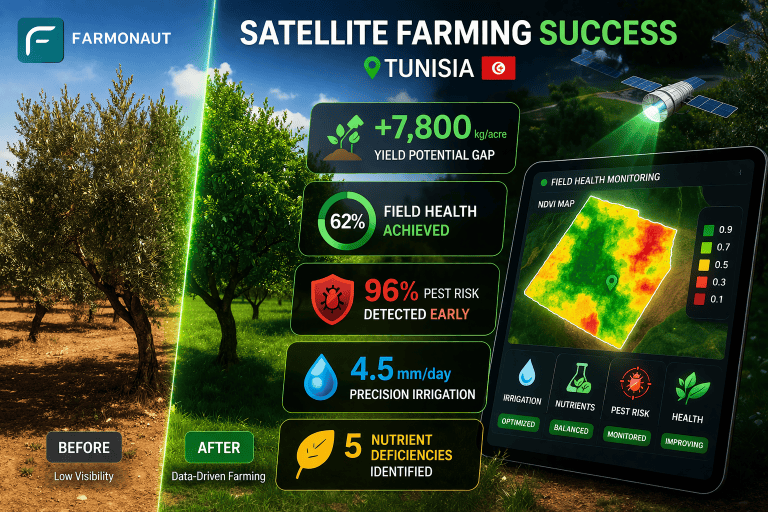
In Tunisia, a grower monitors two olive groves of about 10.9 hectares, as well as pistachio, almond and lemon. In October 2026 the olive fruit fly score there averaged 84%, close to the Greek figures, and peacock spot 62%. With a drier climate, only 33% of grove-days were planned dry. We first wrote about this grower’s farm in our Tunisia satellite advisory case study.

▶ Managing olive lace bug and other leaf-feeding insects · 23:24
What other olive growers can take from it
Four lessons stand out from these groves’ first season of data.
Chart
Share of grove-days planned with no irrigation
All seven Greek groves, by month, %
- Watch risk by stage, not by calendar. Peacock spot scores peaked in winter, fruit fly scores from pit hardening to harvest, and anthracnose scores at ripening. A grove that runs ahead needs attention sooner.
- Use the score to rank your checks. A high fruit fly score is a reason to look at traps and fruit in that grove first. It does not replace them.
- Plan water around the rain. The plan left 47% of grove-days dry, almost all of them in the rainy months.
- Know when not to feed. The advisories paused most fertilizer at ripening and paired every recommendation with an organic source.
If you run your own olive grove, the calculator below estimates how many cubic metres planned dry days could save on your groves, what that water is worth at your own price, and how much oil your fruit could yield at your own extraction rate. You can then try the Farmonaut Satellite + AI Farm Monitoring System on your own groves.
Try the numbers for your own farm below.
Calculator
How much water could planned dry days save in your olive grove?
Enter your own grove size, drip dose, season length, dry-day share, water price, fruit yield and oil rate.
- Water with a same-dose daily routine: 14,000 m³
- Water with planned dry days: 9,800 m³
- Saving per hectare: 2,100 m³/ha
- Value of water not applied: 1,260 EUR
- Olive oil from your fruit: 720 kg oil
Example values only, not a benchmark or forecast. Enter your own water price, fruit yield and oil extraction rate. 1 mm of water over 1 hectare is 10 cubic metres (fixed in the formula).
FAQ
Can a satellite detect the olive fruit fly?
No. A satellite sees changes in the canopy and soil moisture, not the insect. Olive fruit fly monitoring by satellite combines those readings with the weather and the growth stage to score the risk for each grove. The grower then confirms it with traps and a check of the fruit.
When is olive fruit fly risk highest in Greece?
In this case study the fly was scored above 85% from May to October, with the peak at 92% in June during pit hardening and 88% during ripening in September and October. Local trap counts and your regional bait-spray programme give the exact timing for your area.
How often does an olive grove get a new advisory?
In this case study each grove received an advisory about every five days, in line with the Sentinel-2 revisit time. Radar images filled the gaps on cloudy dates.
Does it work on small olive groves?
Yes. The smallest grove in this case study is about 0.13 hectares, and it received its own advisories through the whole season.
How much water can an olive grove save with an irrigation plan?
It depends on the site and season. In this case study the advisory plan was about 47% lower than giving each grove the same dose on every planned day, but that is a planned figure, not a metered one. Use the calculator above with your own numbers.
Farmonaut olive grove monitoring
Get a grove-by-grove plan for your olives
Draw your groves once, and Farmonaut sends a satellite-based irrigation, nutrient and pest-risk plan for each one every few days on web, Android or iOS.




Keep reading

Sources
- Farmonaut advisory records for olive groves in Greece, Western Australia and Tunisia (2025–2026): sat.farmonaut.com
- ESA, Sentinel-2 facts and figures: esa.int
- Copernicus SentiWiki, Sentinel-1 mission: sentiwiki.copernicus.eu
- NASA Earth Observatory, Measuring vegetation (NDVI and EVI): science.nasa.gov
- Eurostat, Crop production in EU standard humidity (apro_cpsh1), Greece, olives for oil: ec.europa.eu
- UC IPM, Olive fruit fly (Olive pest management guidelines): ipm.ucanr.edu
- UC IPM, Peacock spot (Olive pest management guidelines): ipm.ucanr.edu
- UC IPM, Olive knot (Olive pest management guidelines): ipm.ucanr.edu
- EU CAP Network, Smart spraying for sustainable farming (DacoTech, Crete), 2025: eu-cap-network.ec.europa.eu
- Region of Crete, Heraklion rural development directorate: start of 2026 olive fruit fly bait spraying (press release, 15 June 2026): crete.gov.gr
- Talhinhas, Loureiro and Oliveira, Olive anthracnose, Molecular Plant Pathology (2018): pmc.ncbi.nlm.nih.gov
- International Olive Council, World Olive Catalogue: The olive fruit fly Bactrocera oleae: worldolivecatalogue.internationaloliveoil.org
- FAO, Irrigation and Drainage Paper 56, Chapter 6 crop coefficients (1998): fao.org
- Hellenic National Meteorological Service (HNMS), The climate of Greece: emy.gr
- Meteostat, Heraklion Airport (WMO 16754), climate normals 1991–2020: meteostat.net
Discussion
Questions, corrections or field experience? Share them below. First-time comments are reviewed before they appear, and your email is never published.
No comments yet. Be the first to add a question or your experience.

 Sayaji Group
 eKGIS
 Mostas Tech
 Native Seeds
 Andex
 FCF India
 Unifrutti Gulf
 Deluxe Conseil
 TVS Electronics
 BW Pipelines
 WICO
 Chimera Innovation
 SkyHarvest
 Polaris Digitech

 Licence holder · Niger · Gold










