

Customer case study · Almond and pistachio
Almond Orchard Irrigation: An 824 mm Plan in Dry Tunisia
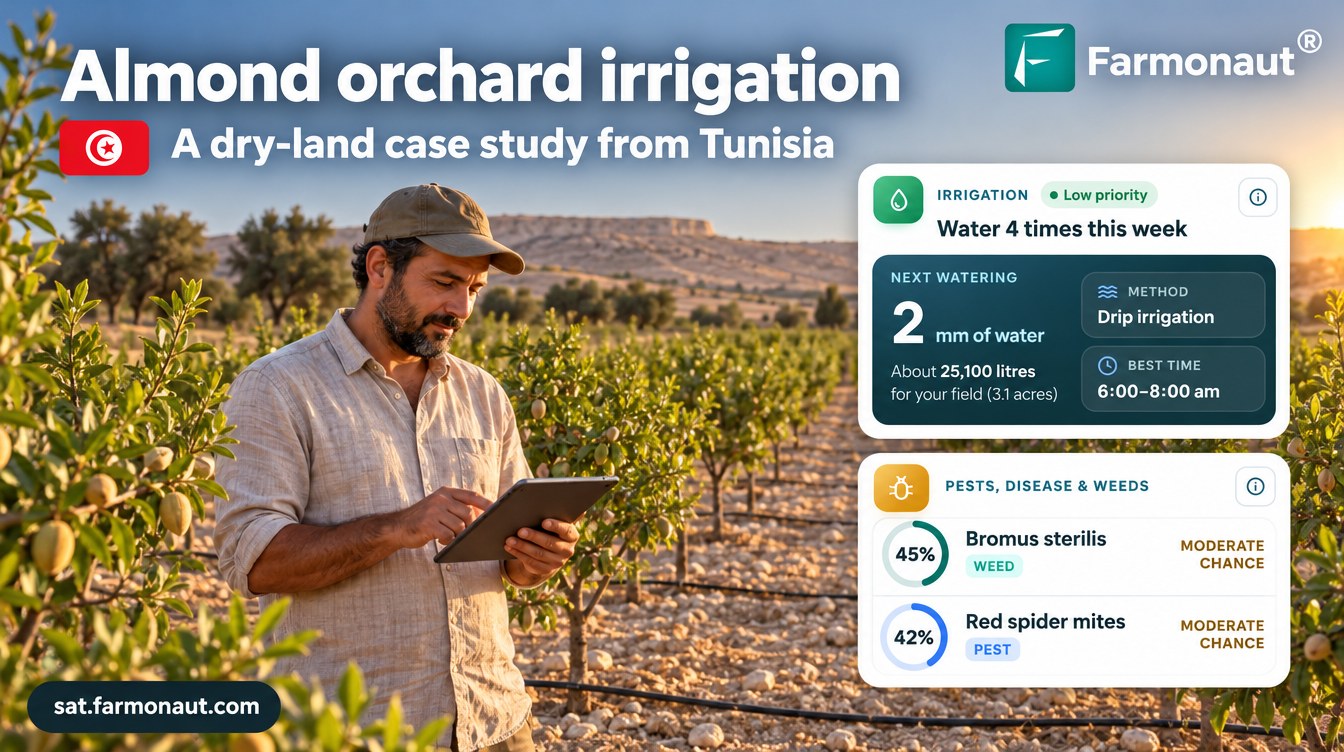
Satellite advisories planned 824 mm of drip water (8,240 m³/ha) for a young almond block in Tunisia’s Gafsa governorate over 12 months, with 35% of days left dry. From March to September that was about 64% of FAO-56 full-canopy demand. Two pistachio blocks on the same farm were planned 748 to 811 mm.
Key takeaways
- A grower in arid central Tunisia received 515 satellite advisories for one almond and two pistachio blocks from May 2025 to October 2026.
- The almond block was planned 824 mm of water from October 2025 to September 2026, or 8,240 m³ per hectare, with 123 of 356 days (34.6%) left dry.
- From March to September the almond plan was 618 mm, about 64% of the 967 mm FAO-56 gives for a full-canopy almond orchard at Gafsa.
- The pistachio blocks were planned 748 mm and 811 mm, with less water in spring and more in June and July.
- Gafsa averages about 151 mm of rain a year (1991–2020 normals), so almost all orchard water comes from irrigation.
In this article
- The orchard and the brief
- Why water decides almond orchard irrigation in Gafsa
- How satellite advisories plan almond orchard irrigation
- The orchard year, stage by stage
- How much water the almond block was planned to get
- Pistachio vs almond water use on the same farm
- Pest and disease risk by stage
- Nutrition and soil
- What other almond and pistachio growers can take from it
- FAQ
How much water does an almond orchard need on dry land? For one young, drip-irrigated almond block in Tunisia’s Gafsa governorate, satellite advisories planned 824 mm of water over 12 months, or 8,240 m³ per hectare, and left 35% of days dry. In the March to September growing season the plan came to 618 mm, about 64% of what the FAO-56 method gives for a mature almond orchard with a full canopy in the same climate. This is almond orchard irrigation measured from the plan, day by day.
We first wrote about this grower in April 2026, in our Tunisia multi-crop case study. This follow-up looks only at water. It uses 515 advisories sent from May 2025 to October 2026 for one almond block and two pistachio blocks on the same farm, and compares them with pistachio orchards on Crete in Greece and in Mendoza, Argentina. All figures come from the advisory records. Water figures are planned amounts, not metered use, and risk scores are modelled probabilities.
The orchard and the brief
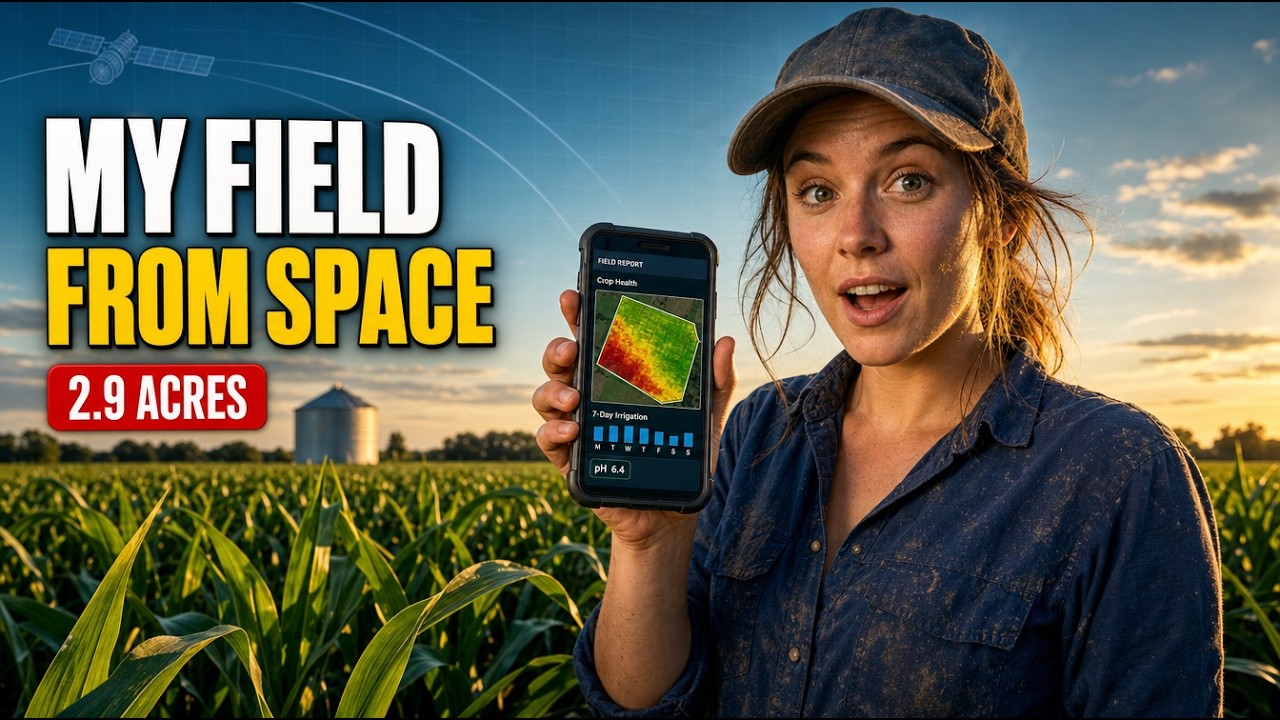
The farm sits on dry, stony land in Gafsa governorate in central Tunisia, near the Gafsa weather station at 313 m above sea level. The grower drew each block once in the Farmonaut app. Since June 2025 an advisory has arrived for every block about twice a week.
Where the orchard is
Gafsa governorate shaded; marker shows the approximate area only
Three blocks are in this study. The almond block covers about 1.25 hectares and was planted in 2022. A small pistachio block of about 1.9 hectares was planted in 2020. A larger, younger pistachio block covers about 8.9 hectares. The grower drew the larger pistachio block twice, so it has two advisory streams. Both gave almost the same water plan, and we report the longer one.
The grower’s question was simple: how much water do these trees need, and on which days? Water is the limit on this farm, so every cubic metre saved on a cool week can go to the trees in July.
| Item | Detail |
|---|---|
| Region | Gafsa governorate, central Tunisia (arid) |
| Crops | Almond (1 block), pistachio (2 blocks) |
| Area | About 1.25 ha almond and 10.8 ha pistachio |
| Irrigation | Drip |
| Monitoring period | May 2025 to October 2026 |
| Advisories | 515, including 38 from radar on cloudy dates |
| Water year studied | October 2025 to September 2026 |
| Soil (modelled) | pH 7.0 to 7.9, moderate salinity, low organic carbon |
| Comparison orchards | Pistachio on Crete (Greece) and in Mendoza (Argentina) |
Why water decides almond orchard irrigation in Gafsa
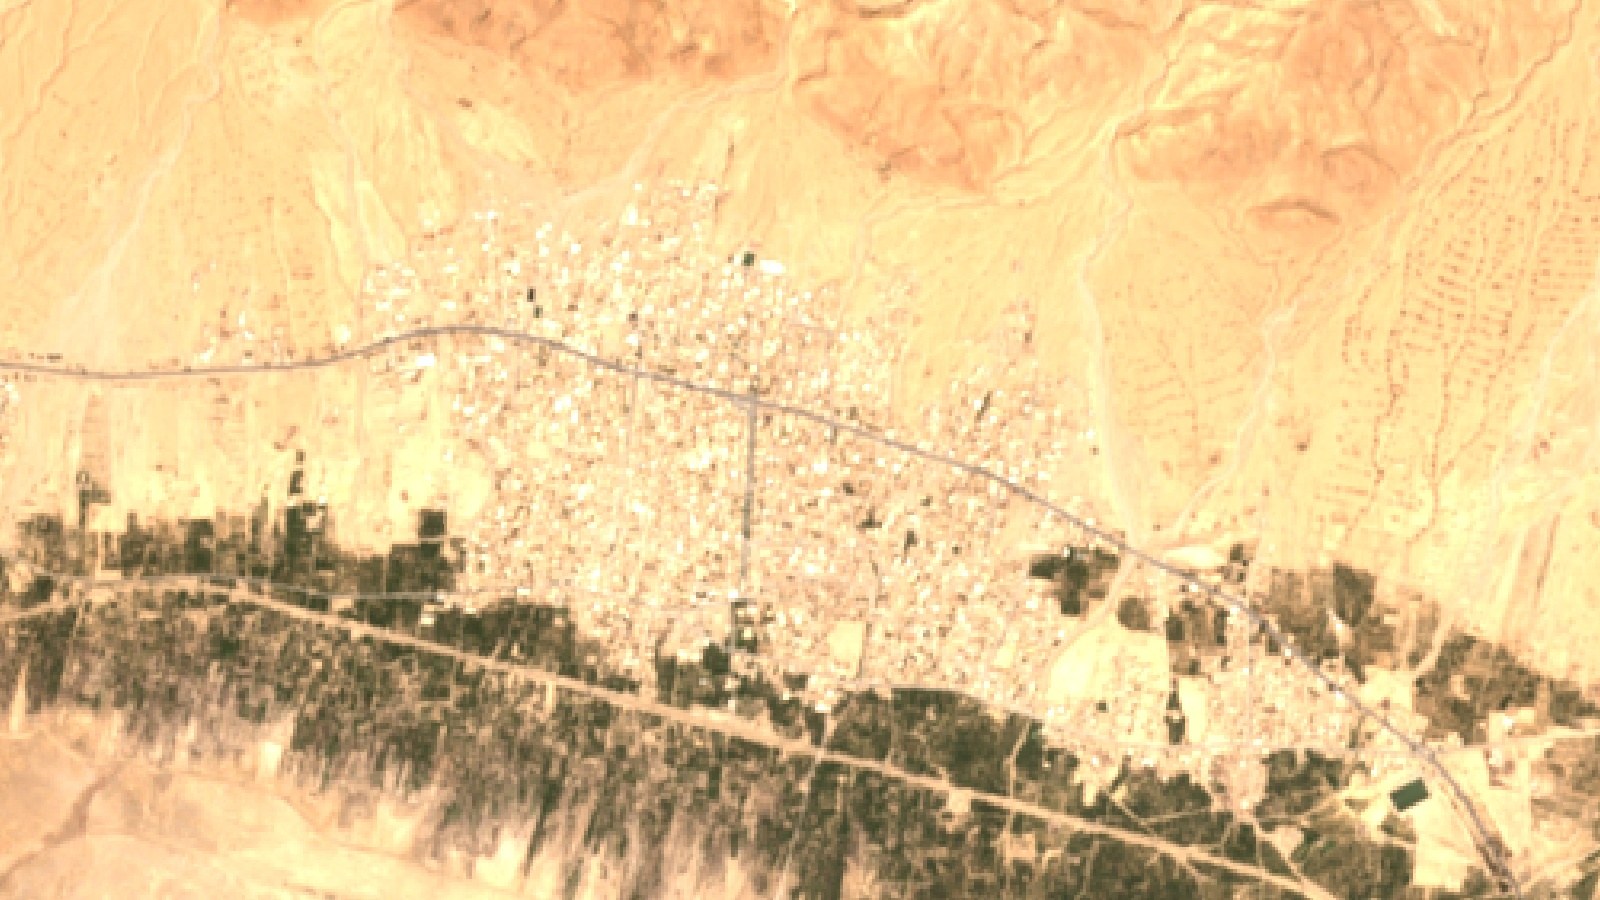
Gafsa is one of the driest farming areas in Tunisia. At the Gafsa weather station, the 1991–2020 normals average about 151 mm of rain a year. The wettest months, September and October, get only about 20 mm each, and June to August get 3 to 4 mm. Using the same normals, the Hargreaves equation in the FAO irrigation guide gives a reference evapotranspiration of about 1,525 mm a year, ten times the rainfall. Almost all the water an orchard uses here has to come from irrigation.
Irrigation water is under pressure across the country. Tunisia’s national water sector report for 2023 says the agricultural sector is the most important user of water, accounting for almost 75% of total consumption, most of it from groundwater. The same report puts the groundwater exploitation rate at 119%, which means more is pumped than is recharged.
Almonds are a large crop in Tunisia, but most trees are rain-fed. FAOSTAT records an official almond harvest of 61,000 to 75,000 tonnes in shell each year from 2016 to 2022, from about 180,000 to 220,000 hectares. That is an estimated yield of about 320 to 350 kg per hectare. FAOSTAT puts pistachio at about 27,000 hectares nationally. A drip-irrigated block like this one is a small part of the national picture, which is why planning each cubic metre matters.
Chart
Tunisia almond production
Thousand tonnes in shell, official figures
How satellite advisories plan almond orchard irrigation
Each advisory starts with fresh satellite images of the block. The Sentinel-2 satellites carry a camera with a revisit time of five days from the two-satellite constellation and 10-metre detail in the visible and near-infrared bands. From these bands the system works out vegetation indices such as NDVI, which compares red and near-infrared light reflected by the land surface to show how much green leaf is present.
Infographic
How each orchard advisory is built in 4 steps
- 1Satellite passSentinel-2 images each block every few days; Sentinel-1 radar covers cloudy dates.
- 2Read the canopyNDVI and moisture indices show canopy cover and stress block by block.
- 3Weather and stageReference evapotranspiration and the tree’s stage set the FAO-56 water need.
- 4Block planDaily drip amounts, risk scores, nutrients with organic options, and a yield estimate.
When cloud hides a block, the system switches to radar. Sentinel-1 radar can image the ground day and night, regardless of the weather, and 38 of the Tunisian advisories used it.
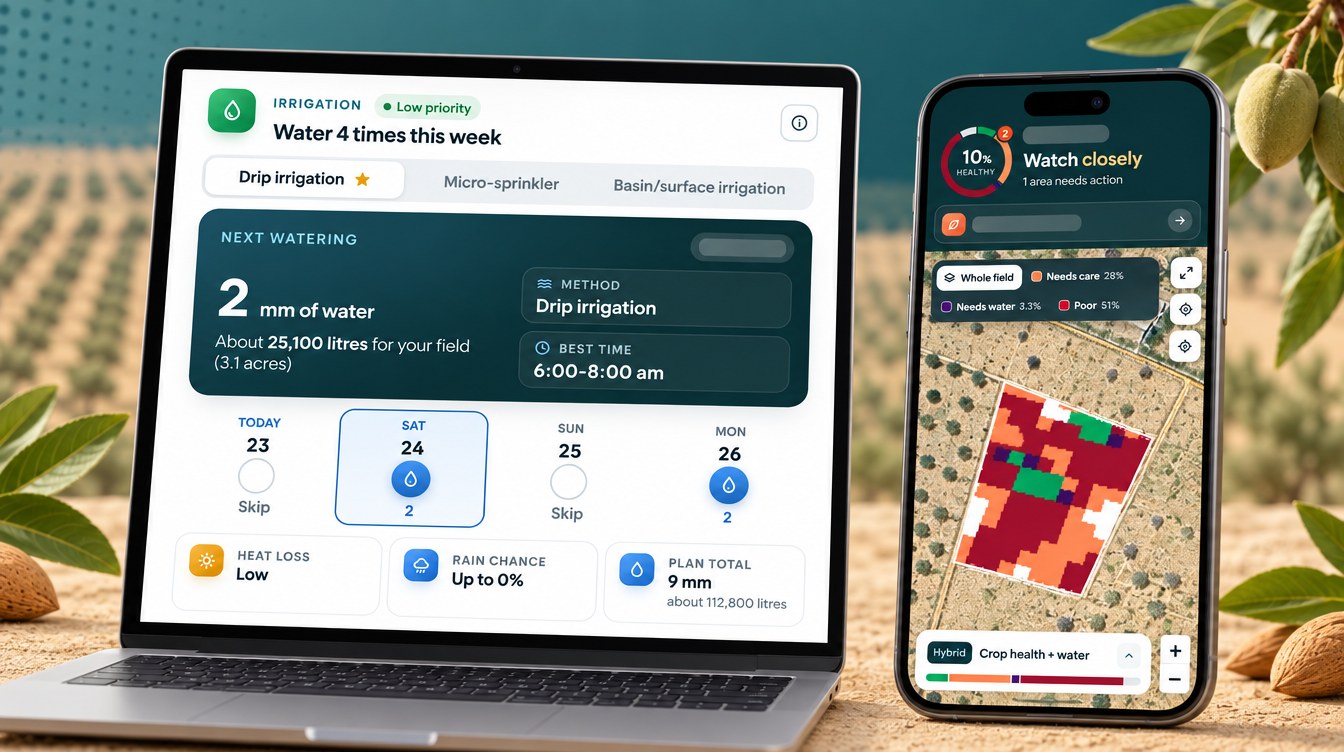
The irrigation plan follows the FAO-56 method that each advisory cites. The system estimates the day’s reference evapotranspiration, multiplies it by a crop coefficient for the tree’s growth stage, and then adjusts for heat, wind and rain in the outlook. The result is a daily amount in millimetres for the next week, with the best time to water. The same advisory also scores pest, disease and weed risk, gives a nutrient plan with organic options, and adds a yield estimate.
The orchard year, stage by stage
The growth stage in each advisory followed the trees through the 2025–26 season. Almond woke first, in February. Pistachio broke bud about a month later, in March.
| Months | Almond stage | Pistachio stage |
|---|---|---|
| Nov to Jan | Dormancy | Dormancy |
| Feb | Bud burst, first flowers | Dormancy |
| Mar | Flowering | Bud break, flowering |
| Apr | Fruit set | Flowering, fruit set |
| May to Jun | Nut development | Shell growth, kernel fill |
| Jul | Hull split, early harvest | Kernel fill |
| Aug | Harvest | Kernel fill, first harvest |
| Sep to Oct | Post-harvest, leaf fall | Harvest, post-harvest |
The stage labels matter for water. A tree that is filling its kernels needs full water. A tree after harvest, or a nut in the hull-split window, can take a planned cut. The plans followed those stages closely, as the next section shows.
▶ Soil moisture probe or satellite: what each tells an irrigator · 2:11
How much water the almond block was planned to get
The irrigation part of each advisory plans a drip amount for each of the next several days. When advisories overlapped, we kept the newest plan for each block and day. That left 356 planned days for the almond block in the water year from October 2025 to September 2026. On 123 of them, or 34.6%, the advisory planned no water at all.
Chart
Rainfall, planned drip and FAO-56 demand by month
Almond block, mm per month, Oct 2025 to Sep 2026
The plan added up to 824 mm for the year. That is 8,240 m³ per hectare, or about 10,300 m³ for the 1.25-hectare block. For US readers, 824 mm is about 32 inches, or roughly 880,000 US gallons per acre (about 2.7 acre-feet).
Month by month, the plan tracked the trees and the weather. It was lowest in January (21 mm), during dormancy. It rose steeply after fruit set and peaked in May (136 mm) and June (121 mm), while the nuts were growing. It then fell to 49 mm in August and 36 mm in September, at harvest and after.
Planned water against FAO-56 demand
To check the plan, we built a simple FAO-56 demand curve for a mature almond orchard at Gafsa. We took monthly reference evapotranspiration from the Hargreaves equation and the station normals. We then used the FAO crop coefficients for almonds with no ground cover: 0.40 at the start of the season, 0.90 in mid-season and 0.65 at the end, with the stage lengths FAO gives for deciduous orchards in California (30, 50, 130 and 30 days from March). After leaf drop, FAO puts the coefficient at about 0.20 for bare, dry soil.
On that basis a full-canopy almond orchard at Gafsa would use about 967 mm from March to September. Rain in those months is only about 77 mm in a normal year. The advisory plan for the same months was 618 mm, about 64% of full-canopy demand. From October to April the plan sat above this simple curve. The curve assumes bare, dry ground after leaf fall, while the plans kept the root zone moist through winter and spring.
The gap makes sense for a block planted in 2022. Young trees shade less ground and use less water than a mature orchard, and FAO-56 points to separate equations for estimating Kc for immature stands. The gap was largest in August, when the plan gave 49 mm against a full-canopy demand of about 181 mm. That is the hull-split and harvest window, when UC Cooperative Extension guidance for almonds aims for moderate tree stress rather than full water.
The plan did not stop after harvest. It kept 36 mm in September and 77 mm in October 2025. UC Cooperative Extension notes that delaying irrigation after harvest can negatively affect the following season’s crop, because flower buds for next year form in late summer.
Dry days and the same-dose comparison
Dry days were not spread evenly. In April only one planned day in thirty was dry, at fruit set. In February 57% were dry, and in August and September about half were. The plan watered when the trees needed it and paused when they did not.
To compare, we worked out what each block would have received if it had been given its own average watering dose every day of the year. The almond block’s average dose on watering days was 3.5 mm. Given every day, that would have added up to 1,259 mm. The advisory plan was 35% lower. The two pistachio blocks were planned 41% and 42% below their own same-dose routines. This is a comparison of plans, not a metered saving, but it shows how much of a season’s water depends on timing.
Chart
Water per block: plan vs daily routine
Planned mm of water per year, Oct 2025 to Sep 2026
Pistachio vs almond water use on the same farm
The two pistachio blocks were planned 811 mm and 748 mm in the same water year, close to the almond block’s 824 mm. The shape of the year was different, though. Pistachio got less water in spring and more in high summer. The small pistachio block was planned 145 mm in July, when the almond block was planned 106 mm.

▶ How satellites and AI help plan farm water use · 7:57
That timing matches the crop. In UC trials at Kettleman City in California, cutting all water in stage 3, from July to mid-September, dropped split-nut yield to 1,064 lb per acre, against 2,848 lb for fully watered trees. Trees given half their water in stage 2, from mid-May to June, with less water after harvest, yielded 2,880 lb. Stress in stage 3 gives lighter nuts and more blanks. The Gafsa plans kept the most water for June and July, when the advisories reported kernel fill.
Against FAO-56, pistachio at Gafsa has a higher mid-season crop coefficient (1.10) than almond (0.90), so a full-canopy pistachio orchard would use about 1,162 mm from March to September. That is close to the normal seasonal ETc of 44.1 inches (about 1,120 mm) in the same UC pistachio table. The two young pistachio blocks were planned 625 mm and 557 mm, about half of that.
Greek and Argentine pistachios
Two other Farmonaut users grow pistachio in very different places. A young pistachio block of about 0.4 hectares on Crete, Greece, received 58 advisories from December 2025 to October 2026. A pistachio orchard of about 2.3 hectares in Mendoza province, Argentina, received 57 advisories from late January to October 2026.
From May to September, the Crete block was planned 470 mm, close to the 440 to 489 mm planned for the Gafsa pistachio blocks. Half of all its planned days were dry, mostly in a wet winter. Mendoza is in the southern hemisphere, so its year runs the other way. Its plan averaged 5.1 mm a day in February during kernel fill and harvest, almost nothing in July during winter dormancy, and climbed back to 2.5 mm a day by October as the trees flowered and set fruit.
Chart
Planned water from May to September
mm per block, selected orchards, 2026
Pest and disease risk by stage
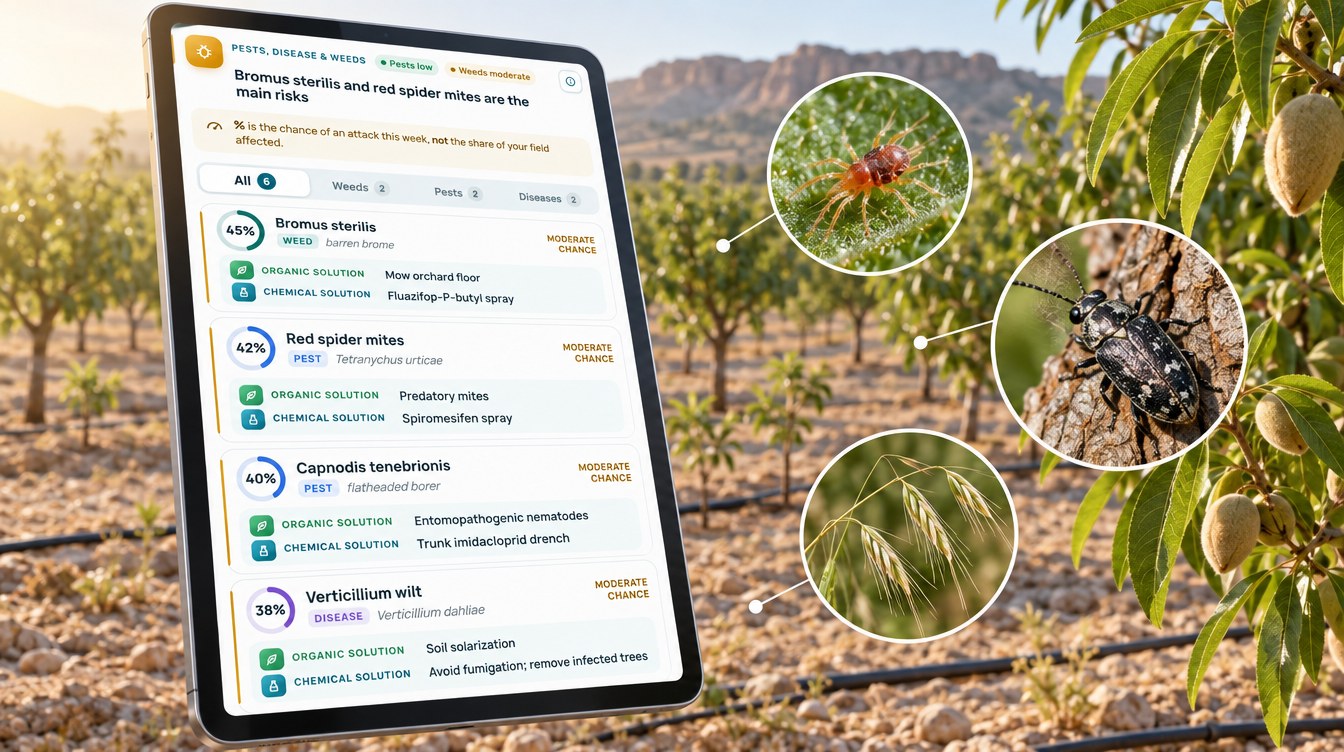
Each advisory scores the threats that fit the crop, the stage and the weather. The scores are modelled probabilities, not confirmed outbreaks. They tell the grower where and when to look first.
Chart
Modelled almond risk by month
Average risk score, almond block, %
Almond
On the almond block, shot hole was the threat scored most often in the water year (59 advisories), followed by brown rot (54), almond seed wasp (46), the peach capnodis beetle (39) and red leaf blotch (38). Shot hole scores peaked at 93% in January and February. Brown rot peaked at 92% in March, during bloom. That fits UC IPM guidance that brown rot infection is favored by rainy weather with temperatures in the mid-70s during bloom. Red leaf blotch, a leaf disease of almond, peaked at 93% in May.
The capnodis score reached 93% in February and again in May. The EPPO database lists Capnodis tenebrionis under the common name peach capnodis; the advisory’s organic option for it was entomopathogenic nematodes. The advisory gave an organic and a chemical option for each threat. Always follow the product label and local rules.
Pistachio
On the two pistachio blocks, the pistachio psyllid was scored most often, at 85% to 92% from March to June. The pistachio twig borer peaked at 88% in March, at bud break. Septoria leaf spot ran at 70% to 76% from March to May. On Crete and in Mendoza, Botryosphaeria blight led the list instead. UC IPM notes that its spores are spread in water from spring and summer rains, via water from sprinkler irrigation. Drip lines that keep the canopy dry are one reason it was rarely scored at Gafsa.
Nutrition and soil
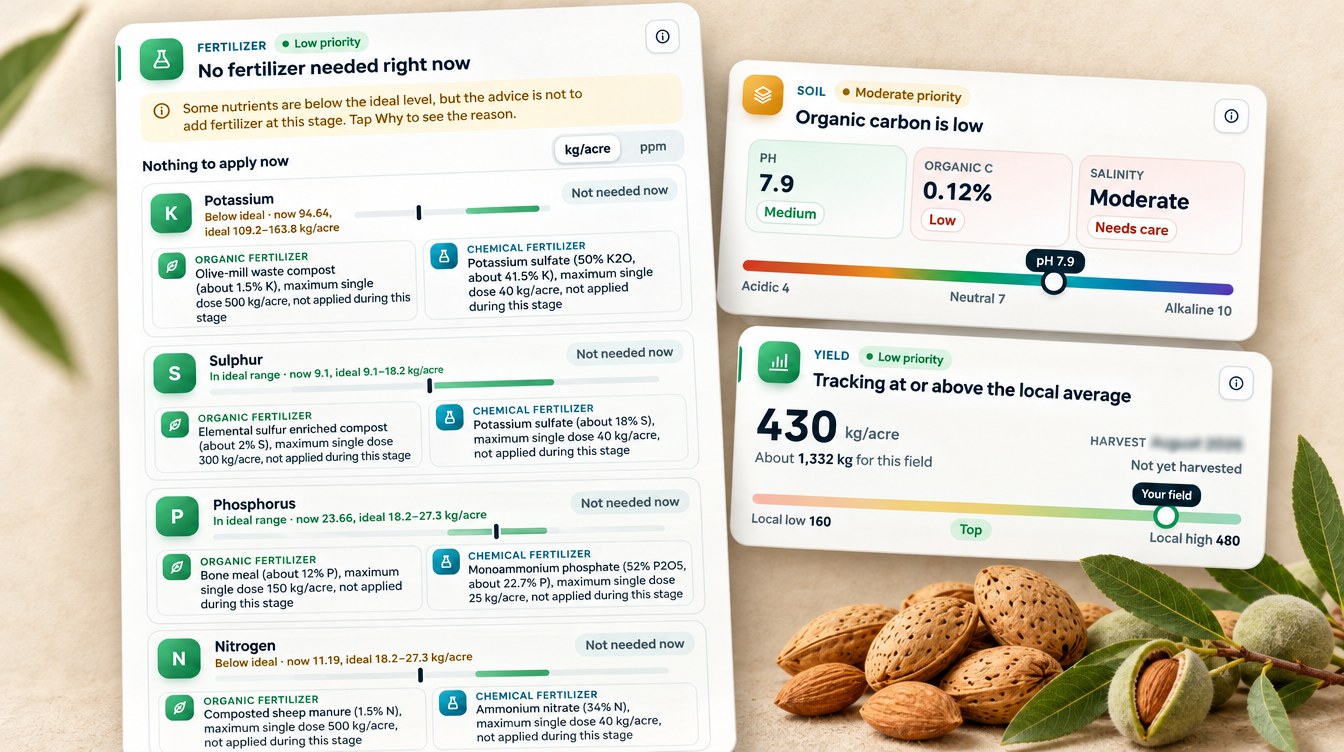
The fertilizer part of each advisory compares the block’s modelled nutrient levels with the ideal range for the current stage, then gives a rate for each nutrient that is short. In the water year the almond block received 640 nutrient recommendations, and 635 of them (99%) came with an organic source as well as a conventional fertilizer. All 685 recommendations for each pistachio block did. Potassium, zinc and sulfur were the nutrients most often flagged for almond. Phosphorus, sulfur and zinc led for pistachio.
▶ How a Farmonaut satellite farm advisory is read, section by section · 9:13
The soil card rated the blocks at pH 7.0 to 7.9, with moderate salinity and low organic carbon of about 0.12%. That is typical of calcareous soil in a dry climate. Low organic carbon is the reason the advisories leaned on compost options such as olive-mill waste compost and composted sheep manure, which feed the trees and build soil at the same time. The yield card gives a modelled estimate for each block. We do not quote it here, because the national yields in FAOSTAT come mostly from rain-fed trees and are not a fair comparison.
What other almond and pistachio growers can take from it
Four lessons stand out from this farm’s water year.
- Plan by stage, not by calendar. The almond plan peaked during nut growth in May and June. The pistachio plan peaked during kernel fill in June and July.
- Use FAO-56 as the ceiling, not the target, for young trees. The plans came to about half to two thirds of full-canopy demand, which fits trees that do not yet shade the whole row.
- Expect a third or more of days to be dry. The plans left 35% to 42% of days without water, mostly in winter and around harvest.
- Keep some water after harvest. The plans never cut post-harvest water to zero, which protects next year’s flower buds.
If you run your own orchard, the calculator below estimates your season’s water, its cost in Tunisian dinars and US dollars, and how much planned dry days could save. For the bigger picture on water use in California, see our guide to the amount of water it takes to produce almonds, and for practical ways to cut it, our list of ways to reduce almond tree water consumption. You can also try the Farmonaut Satellite + AI Farm Monitoring System on your own blocks.
Try the numbers for your own farm below.
Calculator
How much water will your orchard plan use this season?
Enter your block size, usual drip dose, season length, share of dry days and your water price.
- Water with a same-dose daily routine: 48,000 m³
- Water with planned dry days: 33,600 m³
- Season depth with dry days: 672 mm
- Same depth in inches: 26.5 in
- Water cost with dry days: 6,720 TND
- Value of water not applied: 2,880 TND
- Value of water not applied in US dollars: $864
Example values only, not a benchmark or forecast. Enter your own water price and today’s exchange rate. 1 mm of water over 1 hectare is 10 cubic metres and 25.4 mm is 1 inch (fixed in the formula).
FAQ
How much water does an almond tree need?
It depends on tree age, canopy and climate. In this case study a young drip-irrigated almond block in arid central Tunisia was planned 824 mm a year, or 8,240 m³ per hectare. At an example spacing of 6 by 6 metres (about 278 trees per hectare), that is roughly 30 m³ of water per tree per year. A mature orchard with a full canopy in the same climate would need more.
Does pistachio use less water than almond?
Not on this farm. Over the year, the two pistachio blocks were planned 748 mm and 811 mm, against 824 mm for almond. Pistachio received less in spring and more in mid-summer, when its kernels fill. In UC trials, pistachio handled a water cut from mid-May to June, but not from July to mid-September.
Can a satellite measure how much water my orchard uses?
Not directly. A satellite sees canopy cover, vigour and moisture signals. Farmonaut combines those with the weather outlook and the FAO-56 crop-coefficient method to plan how much to irrigate each day. The figures in this case study are planned amounts, not metered use.
How often does an orchard get a new irrigation plan?
In this case study each block received an advisory about twice a week, and each one planned water for the next several days. Radar images filled the gaps on 38 cloudy dates.
What is 824 mm of irrigation in inches and gallons?
824 mm is about 32 inches of water. Over one acre that is roughly 880,000 US gallons, or about 2.7 acre-feet. Over one hectare it is 8,240 cubic metres.
Farmonaut orchard monitoring
Get a block-by-block water plan for your orchard
Draw your blocks once, and Farmonaut sends a satellite-based irrigation, nutrient and pest-risk plan for each one every few days on web, Android or iOS.




Keep reading
Sources
- Farmonaut advisory records for an almond and pistachio farm in Gafsa governorate (2025–2026), plus pistachio orchards on Crete and in Mendoza: sat.farmonaut.com
- ESA, Sentinel-2 facts and figures: esa.int
- Copernicus SentiWiki, Sentinel-1 mission: sentiwiki.copernicus.eu
- NASA Earth Observatory, Measuring vegetation (NDVI and EVI): science.nasa.gov
- Meteostat, Gafsa weather station (WMO 60745), climate normals 1991–2020: meteostat.net
- FAO, Irrigation and Drainage Paper 56, Chapter 3 (Hargreaves ET₀ equation, 1998): fao.org
- FAO, Irrigation and Drainage Paper 56, Chapter 6 crop coefficients (1998): fao.org
- ONAGRI (Tunisian Ministry of Agriculture), Annual Report on Water Sector 2023, executive summary: onagri.nat.tn
- FAOSTAT, Crops and livestock products (QCL), Tunisia almonds and pistachios: fao.org
- UC Cooperative Extension, Almond irrigation management from hull split through postharvest (newsletter, August 2026): ucanr.edu
- UC ANR, Pistachio water use, irrigation scheduling and regulated deficit irrigation (presentation): ucanr.edu
- UC IPM, Brown rot blossom blight of almond: ipm.ucanr.edu
- UC IPM, Botryosphaeria panicle and shoot blight of pistachio: ipm.ucanr.edu
- EPPO Global Database, Capnodis tenebrionis: gd.eppo.int
Discussion
Questions, corrections or field experience? Share them below. First-time comments are reviewed before they appear, and your email is never published.
No comments yet. Be the first to add a question or your experience.

 AgroGreen Dynamics
 Leher
 AgroRisk
 Oath Inc
 Reddane Farming
 Esri North East Africa
 Cresol
 Atur Kuliner
 MDCV UK
 Zerella Group
 Etech Consulting Madagascar
 Vestlandsforsking
 Agritein
 Delicio
 WB Dev
 Sama Premium
 Prochecker
 Tres Valles
 LACOS Geoinformation
 Magrifly
 LatConnect 60
 Blickwinkel
 Agricultural Credit Policy Council

 Exploration consultancy · South Africa · Gold
 Licence holder · Niger · Gold










