

DRC minerals · Belt-by-belt map guide
DRC Minerals Map: Where Each Mineral Is Found, by Belt
The DRC has four mineral belts: copper-cobalt in Lualaba and Haut-Katanga, tin-tantalum-tungsten in the Kibaran belt, gold in the north-east and Kasai diamonds, plus Manono lithium. Output data and the CAMI cadastre.
Key takeaways
- The DRC mined an estimated 230,000 t of cobalt in 2025, about 74% of world output, mostly in Lualaba and Haut-Katanga (USGS, 2026).
- Kibali Gold made 98.8% of the 25.9 t of recorded industrial gold; the ministry recorded 28.2 t of gold in total in 2025.
- The ministry recorded 47,788 t of cassiterite in 2025; Haut-Lomami gave 48% of artisanal tin and Bisie 93% of industrial tin.
- Kasai Oriental gave 6.49 of 6.91 million carats of recorded artisanal diamonds in 2025.
- The CAMI cadastre lists who holds each right; its active register is dated 30 September 2026.
In this article
- DRC minerals map at a glance: which belt holds which mineral
- Central African Copperbelt: copper and cobalt in Lualaba and Haut-Katanga
- Kibaran belt: tin, tantalum and tungsten in the Kivus, Maniema and Tanganyika
- Gold in Ituri, Haut-Uélé, Kivu and Maniema
- Diamonds in the Kasaï provinces
- Lithium at Manono, Tanganyika
- How to read the CAMI mining cadastre map
- Security and export rules that change the map
- Frequently asked questions
The Democratic Republic of the Congo (DRC) has four mineral belts that matter for a map. The Central African Copperbelt in Lualaba and Haut-Katanga holds copper and cobalt. The Kibaran belt, running from Katanga north into Maniema and the Kivus, holds tin, tantalum (coltan) and tungsten. Gold sits in the north-east (Ituri, Haut-Uélé, Bas-Uélé) and along the Kivu and Maniema gold belt. Diamonds come from the Kasaï provinces, and the Manono pegmatites in Tanganyika carry one of the largest hard-rock lithium deposits known. This guide shows where each one is, how much it produces, and how to check who holds the licence on the ground.
All production numbers below are dated and tied to a named source: the USGS Mineral Commodity Summaries for world context, and the DRC Ministry of Mines statistics for 2025 for what the country itself records. Where the two differ in basis, the text says so. Copper mines themselves, ranked by output, are covered in our separate guide to copper mining in the DRC, so this page focuses on the geography.
DRC minerals map at a glance: which belt holds which mineral
Start with the table, then read the section for the mineral you care about. “Recorded” means the figure appears in the Ministry of Mines statistical report for 2025, which counts what industrial and artisanal producers declared. It does not capture unrecorded or smuggled output.
Chart
DRC share of world mine output, 2025 estimate
Percent of world total by mineral (contained metal; industrial diamond in carats)
| Belt or district | Provinces | Main minerals | Anchor fact |
|---|---|---|---|
| Central African Copperbelt | Lualaba, Haut-Katanga | Copper, cobalt, with zinc and germanium | USGS puts DRC at 3.2 million tonnes of copper (2025 estimate) |
| Kibaran belt, Katanga side | Haut-Lomami, Tanganyika, Haut-Katanga | Cassiterite (tin ore), coltan, wolframite | Haut-Lomami gave 48% of recorded artisanal cassiterite in 2025 |
| Kibaran belt, Kivu side | Maniema, Nord-Kivu, Sud-Kivu | Cassiterite, coltan, wolframite | Bisie tin mine in Nord-Kivu is the largest recorded producer |
| North-east gold belts | Haut-Uélé, Bas-Uélé, Ituri | Gold | Kibali Gold made 98.8% of recorded industrial gold |
| Kivu and Maniema gold | Maniema, Sud-Kivu, Tanganyika, Tshopo | Gold (mostly artisanal) | Maniema led recorded artisanal gold in 2025 |
| Kasaï diamond fields | Kasaï Oriental, Kasaï Central, Kasaï | Diamonds | Kasaï Oriental gave 94% of recorded artisanal diamonds |
| Manono pegmatites | Tanganyika | Lithium (spodumene), tin, tantalum | First lithium concentrate exports reported in 2026 |
The DRC is the world’s largest cobalt producer by a wide margin. USGS estimates 230,000 tonnes of cobalt from mines in 2025 out of a world total of 310,000 tonnes, and 6 million tonnes of the world’s 12 million tonnes of reserves. The next chart puts the DRC share of world mine output for five minerals side by side.
Central African Copperbelt: copper and cobalt in Lualaba and Haut-Katanga
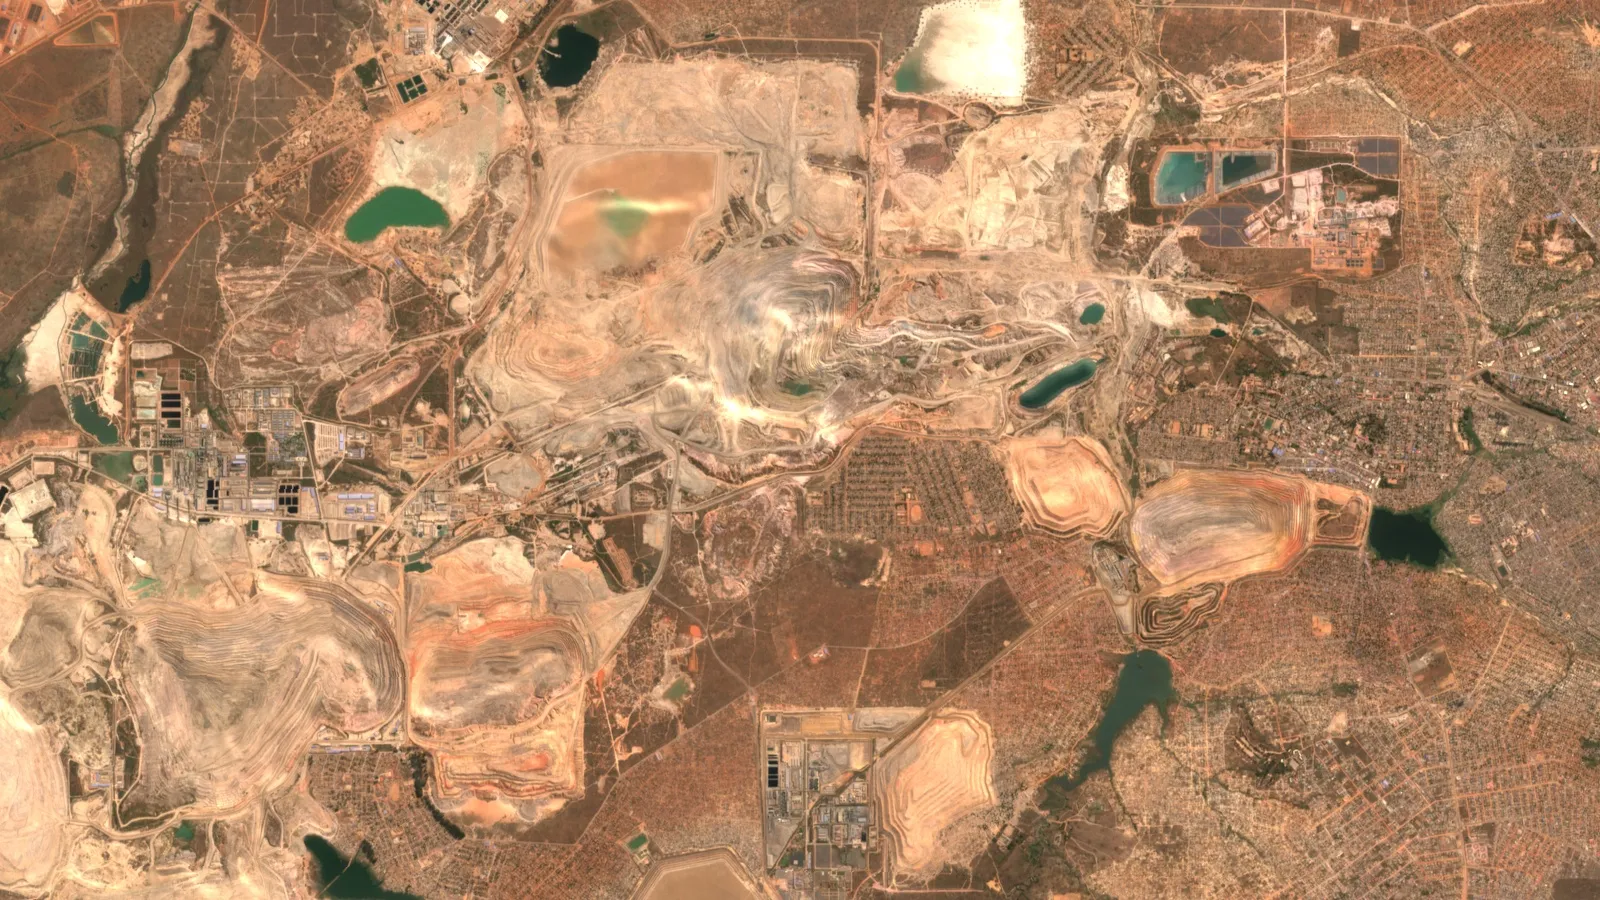
The Copperbelt is the reason the DRC appears in every critical-minerals discussion. It is a curved band of metal-bearing sedimentary rock that runs from the Lubumbashi area in Haut-Katanga north-west through Kolwezi in Lualaba, and continues across the border into Zambia. The USGS model for this deposit type, called sediment-hosted stratabound copper, notes that these deposits are the economic base of the DRC, Poland and Zambia, and that they rank first among all deposit types in world cobalt production. The same report gives average grades inside the Central African Copperbelt of 2.59% copper for reduced-facies deposits and 2.20% for sandstone deposits, well above the 1.08% to 1.38% averages for the same deposit types elsewhere (USGS, Scientific Investigations Report 2010-5070-M). A sediment-hosted stratabound copper model is the standard reference for how these orebodies form.
For scale, USGS estimates DRC copper mine output at 3.2 million tonnes in 2025 (2.99 million in 2024), against a world total of 23 million tonnes, and DRC copper reserves at 80 million tonnes of a world 980 million (USGS Mineral Commodity Summaries, copper). On cobalt, USGS says most of the world’s identified terrestrial cobalt resources, about 25 million tonnes in total, are in sediment-hosted copper deposits in the DRC and Zambia.
The ministry and USGS count different things, so both are given with their basis. USGS estimates mine output: 3.2 million tonnes of copper and 230,000 tonnes of cobalt in 2025. The ministry’s statistics (table 13) add up what each licence holder declared as produced: 3.49 million tonnes of copper and 100,015 tonnes of cobalt. The cobalt gap follows the export suspension of February 2025: the Cobalt Institute reports that mining continued while the ban and then quotas held material back, and that cobalt built up in stockpiles inside the DRC (Cobalt Institute, Cobalt Market Report 2025), and its figure puts the DRC at 73% of about 270,000 tonnes of world mined cobalt. Use USGS for share of world supply and the ministry for what producers declared inside the country. The ministry’s 2025 report adds by-products. Recorded zinc production was 209,142 tonnes, germanium hydroxide 1,068 kilograms and manganese concentrate 1,521 tonnes (DRC Ministry of Mines, CTCPM statistics for 2025). The report also shows how fast policy moves the numbers: monthly cobalt output fell from 15,851 tonnes in March to 6,725 tonnes in April after the government suspended cobalt exports in February, a point the report itself ties to that decision.
What the Copperbelt looks like on a map
- Lualaba (Kolwezi area): the densest cluster of large open pits and processing plants, plus a lot of artisanal digging on licence boundaries.
- Haut-Katanga (Lubumbashi to Kipushi): older mines, smelters and tailings, with zinc and copper in the south.
- Operator names: ownership changes often, so check the current licence holder in the cadastre (see the cadastre section) instead of trusting an old map label.
Two practical notes. First, oxide copper and cobalt near surface are visible from space as pits, tailings and waste dumps, which is why satellite screening is useful here for tracking footprint changes. Second, the grade of the surface is not the grade at depth; the Copperbelt orebodies dip and are stacked, so a surface map shows where mining has started, not how much remains.
Kibaran belt: tin, tantalum and tungsten in the Kivus, Maniema and Tanganyika
Tin, tantalum (sold as coltan) and tungsten come from a different geology: the Kibaran belt, a band of folded sedimentary rock of Mesoproterozoic age (more than a billion years old), cut by granites. A peer-reviewed study of the Katanga part of the belt describes four main rock groups and granites dated at 1.38 billion years (Kokonyangi and others, Journal of African Earth Sciences, 2006; see the Kibaride belt paper). The practical rule for prospectors is simple: start at the contact with those tin granites, since they are the belt’s natural source of tin, and follow the drainage downstream from it.
Chart
Recorded artisanal cassiterite by province, 2025
Tonnes of concentrate; Lualaba (54 t) not shown
Tin: where the tonnes are
USGS puts DRC tin mine output at 27,000 tonnes of contained tin in 2025 (26,000 in 2024) out of a world 290,000 tonnes, with reserves of 91,000 tonnes (USGS Mineral Commodity Summaries, tin). The ministry counts concentrate, which is heavier than the tin inside it, so its totals are larger: 47,788 tonnes of cassiterite in 2025, of which 33,044 tonnes (69%) came from industrial operations and 14,743 tonnes (31%) from artisanal and semi-industrial ones. Alphamin’s Bisie mine in Nord-Kivu supplied 93.3% of the industrial cassiterite. Alphamin reported 18,576 tonnes of tin for 2025, up 7% on the prior year (Alphamin Resources, 19 January 2026), after operations were suspended for a time in March 2025 for security reasons (Bankable, 26 January 2026).
The artisanal picture has moved south. Haut-Lomami provided 48% of recorded artisanal cassiterite in 2025, followed by Maniema and Tanganyika. Nord-Kivu and Sud-Kivu, long the best-known tin provinces, gave only 1.7% and 1.0% of the artisanal volume in the ministry’s records. The tin story across other producing countries is in our guide to cassiterite and tin ore trends.
Coltan and tungsten
USGS estimates DRC tantalum mine output at 1,300 tonnes of contained tantalum in 2025, about half of the world’s 2,500 tonnes (USGS Mineral Commodity Summaries, tantalum). The ministry recorded 1,434 tonnes of coltan concentrate in 2025, 88% of it artisanal. By province, recorded artisanal coltan came from Tanganyika (601 tonnes), Maniema (446), Haut-Lomami (178) and Sud-Kivu (38). Nord-Kivu shows just 0.42 tonnes, which says more about access and security than about geology: the Rubaya coltan field in Nord-Kivu is one of the best known in the country, and a 2026 flood and tunnel collapse there killed more than 200 artisanal miners, according to the metals consultancy MMTA, which also reported tantalum prices rising from a little over US$100 per pound of Ta2O5 at the end of 2025 to over US$120 right after the disaster and, by late March 2026, to about US$280 per pound FOB Kigali (a figure MMTA attributes to ONG research) (MMTA, Rubaya and the tantalum market).
Wolframite, the main tungsten ore, is small. The ministry recorded 213 tonnes of artisanal wolframite in 2025: 87 tonnes from Maniema, 87 from Haut-Lomami, 38 from Sud-Kivu and 1 from Nord-Kivu.
Gold in Ituri, Haut-Uélé, Kivu and Maniema
The DRC’s gold sits in two settings: the old greenstone belts of the north-east (Haut-Uélé, Bas-Uélé, Ituri), and the Twangiza-Namoya belt of folded sedimentary rock in South Kivu and Maniema, which belongs to the Kibaran belt (Heliyon review of the Twangiza-Namoya gold belt, 2024). The ministry recorded 28.2 tonnes of gold in 2025: 25.9 tonnes (92%) industrial and 2.3 tonnes (8%) artisanal. That is below the 31.4 tonnes recorded in 2021 and 31.9 tonnes in 2023, and a little above 2024’s 27.0 tonnes.
Chart
Recorded artisanal gold by province, 2025
Kilograms declared; the seven largest of 13 provinces
Chart
Recorded DRC gold production, 2021 to 2025
Tonnes per year, industrial plus artisanal
One mine dominates the industrial figure. Kibali Gold, in Haut-Uélé and owned 45% by Barrick (the operator), 45% by AngloGold Ashanti and 10% by the state miner SOKIMO (AngloGold Ashanti, Kibali technical report summary, 31 December 2025), produced 25,581 kilograms in 2025, or 98.8% of recorded industrial gold. The rest came from three small operators. Other industrial mines in the east have been idle: Ecofin reported in December 2025 that Twangiza (South Kivu) and Namoya (Maniema) were out of the industrial data because of insecurity, and that artisanal gold exports fell 66% in 2024 (Ecofin Agency, 8 December 2025).
For a map reader, the recorded artisanal split by province is the useful part, because it shows where small-scale gold is actually declared. Maniema led in 2025, followed by Tanganyika, Bas-Uélé and Ituri. Sud-Kivu appears only in January, which reflects the security situation rather than a lack of gold. Treat these as a floor for activity, not a total.
We do not rank gold deposits worldwide here; for that, see the world gold mines map.
Calculator
What is a batch of DRC gold worth?
The ministry reports gold in kilograms. Enter your own kilograms, price and royalty.
- Gross value at your price (US$): $96,452,168
- Royalty at your rate (US$): $3,375,826
Example values only, not a forecast. One troy ounce is 31.1035 g. The gold price and royalty rate are examples: use today’s price and the rate in your own licence. Result excludes costs and other taxes.
Diamonds in the Kasaï provinces
Diamonds come from kimberlite pipes around Mbuji-Mayi in Kasaï Oriental and from the gravels of rivers draining them across Kasaï Oriental, Kasaï Central and Kasaï. The ministry recorded 8.13 million carats in 2025: 6.91 million (85%) artisanal, 1.21 million industrial and about 11,000 carats semi-industrial. Kasaï Oriental alone gave 6.49 million carats of the artisanal total, Kasaï Central 0.31 million and Kasaï 0.09 million. Industrial output was led by SACIM (1.10 million carats), with MIBA, once the national diamond company, at 75,556 carats.
Chart
Recorded DRC diamond production, 2021 to 2025
Million carats per year
The long-run trend is down. The ministry’s series falls from 12.97 million carats in 2021 to 7.37 million in 2024 before a rise to 8.13 million in 2025. The Belgian research group IPIS notes the country holds about 9% of known diamond reserves, 18% of world industrial-diamond production and 3% of gem-quality production, with roughly 450,000 artisanal miners supplying 60% to 80% of export volume (IPIS, Diamonds in the DRC, April 2025). USGS agrees on scale: 7 million of the world’s 38 million carats of industrial diamond in 2025.
Lithium at Manono, Tanganyika
The Manono-Kitotolo pegmatites in Tanganyika are a former tin and coltan district that also holds hard-rock lithium in spodumene. USGS lists DRC lithium resources at 3 million tonnes of contained lithium, among the larger national totals (USGS Mineral Commodity Summaries, lithium). Bankable, citing a Reuters interview in February 2026, reports that the north-eastern section developed by the Manono Lithium joint venture with Zijin Mining holds an estimated 6.47 million tonnes of lithium carbonate equivalent at an average 1.5% lithium oxide, and that the plan is to process 5 million tonnes of ore a year (Bankable, February 2026).
Reuters reported on 16 July 2026 that Zijin had begun exporting lithium concentrate from Manono, Congo’s first lithium exports; one source said shipments started in June. The venture is 54.9% owned by Zijin, with Cominière at 35.1% and the Congolese government at 10%. The project sits at the centre of a dispute after Congo revoked the permit of the Australian company AVZ Minerals and reassigned part of the deposit, and the US-backed KoBold Metals, which holds the adjoining licence, has said it will not proceed until the legal disputes are settled (Reuters report carried by Voice of Nigeria). For a map user this means one thing: Manono has several overlapping claims to ground, so confirm the holder of any block in the cadastre before using it.
How to read the CAMI mining cadastre map
The Cadastre Minier (CAMI) is the state register of mining and quarry rights. Its statutes were set by Decree 17/005 of 3 April 2017, and the CAMI website has sections for its map, legislation, procedures and annual reports. The site says rights to mine or quarry can only be obtained through the procedures of the revised Mining Code and its implementing regulation. Use it as the first check on any block you read about, in six steps.
- Locate the ground. Open the map section and find the province and territory. Note the nearest town and river, since old maps use names that no longer match.
- Read the right type. A research (exploration) right and an exploitation right carry different obligations. Do not assume a block shown on the map is open for application.
- Download the register. CAMI publishes a register of active mining and quarry rights. The latest on the home page is dated 30 September 2026 and was posted on 6 October 2026.
- Check forfeiture lists. CAMI posts lists of ministerial orders that strip rights (déchéance). Lists dated 25 August and 11 September 2026 were on the site. CAMI publishes these lists under article 289, paragraph 2, of the Mining Code; they cover ministerial forfeiture orders received and notified in 2026.
- Check the application window. CAMI communiqué N°CAMI/DG/024/2026 says it resumed receiving new research-right applications from Tuesday 4 August 2026, after cleaning up the cadastral file, and that applicants can view the cadastral map before filing (CAMI notice).
- Compare with a satellite view. Overlay the licence outline on recent imagery to see which parts already have pits, tailings, roads or artisanal digging, and which are untouched.
The map is a registry, not a geological map. It says who holds the right, not what is under it. Pair it with the geology of the belts above and the national geological survey’s maps. Satellite screening of alteration, iron staining and vegetation stress before fieldwork can narrow a licence to a few targets; Farmonaut’s mining service takes a licence boundary and returns such a screen, as an exploration target, not a resource estimate.
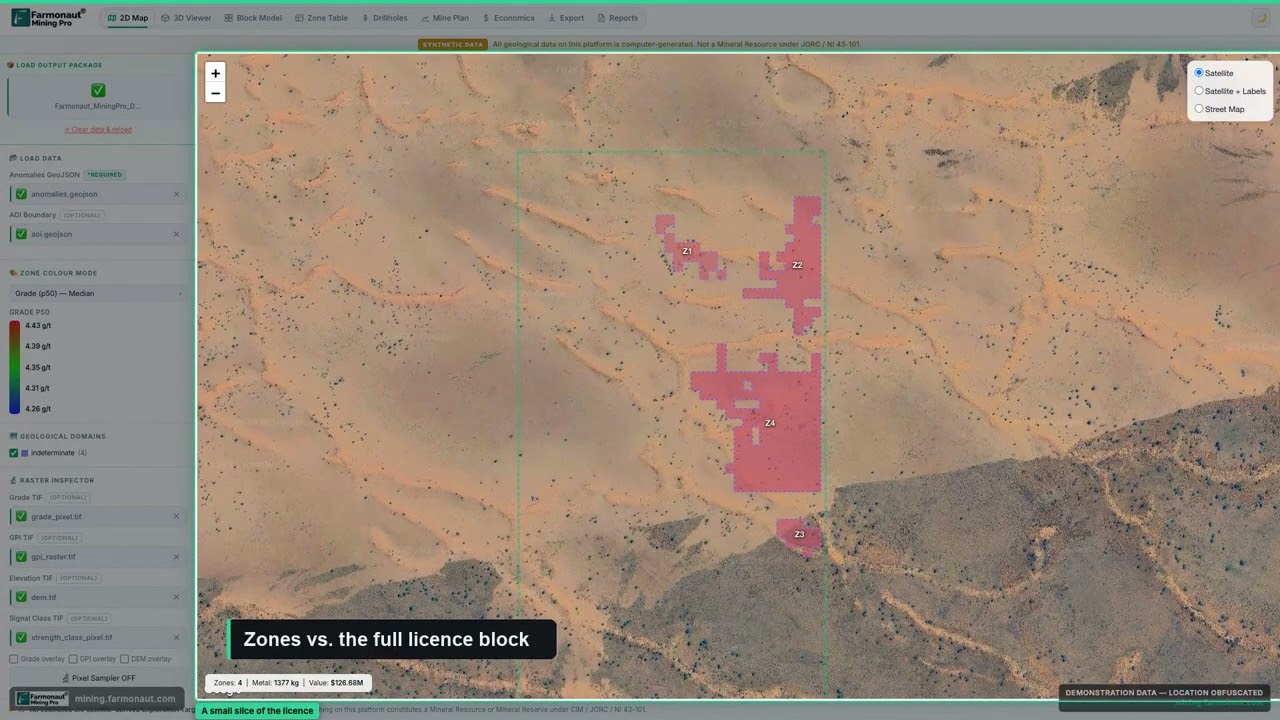
▶ Farmonaut tour of reading a mining GIS map: licence boundaries, anomaly zones and live stats. · 5:38
Security and export rules that change the map
Three things shift quickly and can make a printed map wrong within months.
- Cobalt export quotas. The Authority for Regulation and Control of Strategic Mineral Substances Markets (ARECOMS) replaced the export suspension with quotas from 16 October 2025. For 2026 and 2027 it set a base quota of 87,000 tonnes a year (7,250 tonnes a month), roughly half of 2024 monthly export volumes according to market participants, plus a strategic quota of up to 9,600 tonnes for 2026 allocated at ARECOMS’s discretion; ARECOMS can adjust volumes each quarter (Fastmarkets, 22 September 2025). On 30 June 2026 ARECOMS ordered producers to forfeit export quota left unshipped from the first half of the year (Investing News Network, citing Bloomberg, 30 June 2026).
- Conflict in the east. Mines in the Kivus and Ituri have closed, reopened or changed hands because of insecurity. The Ecofin report cited above lists Twangiza and Namoya as idle, and Alphamin suspended Bisie temporarily in March 2025 for security reasons.
- Licence disputes. Manono shows that a permit can be revoked and reassigned. Always check the latest registry entry and any court or arbitration news.
Which rights a foreign company may hold is set by the Mining Code and the CAMI procedures, so get local legal advice before spending money.

▶ Farmonaut explainer on small-scale mining licences for foreigners in Africa. · 5:16
For a neighbouring Indian Ocean producer of nickel, cobalt and graphite, see the Madagascar mining industry.
Frequently asked questions
What are the main mineral belts in the DRC?
The Central African Copperbelt (copper and cobalt, Lualaba and Haut-Katanga), the Kibaran belt (tin, tantalum, tungsten, from Katanga to the Kivus and Maniema), the north-eastern gold belts (Haut-Uélé, Bas-Uélé, Ituri) with Kivu and Maniema gold, the Kasaï diamond fields, and the Manono lithium pegmatites in Tanganyika.
Where is cobalt found in the DRC?
Almost all of it is mined with copper in Lualaba and Haut-Katanga. USGS estimates DRC mines produced 230,000 tonnes of cobalt in 2025 out of 310,000 tonnes worldwide, about 74%.
Where is tin found in the DRC?
In the Kibaran belt. The biggest single operation is the Bisie mine in Nord-Kivu, which produced 18,576 tonnes of tin in concentrate in 2025. Recorded artisanal cassiterite now comes mostly from Haut-Lomami, Maniema and Tanganyika.
Where is coltan found in the DRC?
In the same belt: Tanganyika, Maniema, Haut-Lomami and the Kivus, including the Rubaya field in Nord-Kivu. The ministry recorded 1,434 tonnes in 2025, 88% artisanal.
Where is gold found in the DRC?
In the north-east (Haut-Uélé, Bas-Uélé, Ituri) and along Maniema, Sud-Kivu and Tanganyika. The ministry recorded 28.2 tonnes in 2025, with the Kibali mine in Haut-Uélé giving 98.8% of the industrial total.
Where are diamonds found in the DRC?
In Kasaï Oriental, Kasaï Central and Kasaï. Kasaï Oriental provided 6.49 million of the 6.91 million carats of recorded artisanal output in 2025.
Where is lithium in the DRC?
Mainly at Manono-Kitotolo in Tanganyika. Zijin’s Manono Lithium joint venture has started exporting concentrate, while ownership of parts of the deposit is disputed.
Is there an official DRC mining map?
Yes. The Cadastre Minier (CAMI) publishes a map and a register of active mining and quarry rights. It shows who holds a right, not the geology.
How much of the world’s cobalt, tantalum and industrial diamond comes from the DRC?
Using USGS 2025 estimates: about 74% of cobalt, 52% of tantalum, 18% of industrial diamond, 14% of copper and 9% of tin.
Which DRC mineral is hardest to map from official data?
Artisanal gold, coltan and diamonds. Output is declared at trading houses and exports, so official figures miss unrecorded production and reflect access and security as much as geology.
This page is for information only. It is not investment advice or legal advice. Licence status, quotas and ownership change; confirm them with CAMI, ARECOMS and a Congolese mining lawyer. Satellite results are exploration targets that sit ahead of a resource estimate. Prospecting needs the permission of the licence holder and the regulator, and mercury must never be used.
Farmonaut mining
Screen your DRC licence from space
Request a quote to screen a licence boundary with satellite data and get ranked exploration targets, ahead of a resource estimate.

Mining Pro sample view, synthetic data
Keep reading
Sources
- USGS, Mineral Commodity Summaries 2026: Cobalt: pubs.usgs.gov
- USGS, Mineral Commodity Summaries 2026: Copper: pubs.usgs.gov
- USGS, Mineral Commodity Summaries 2026: Tin: pubs.usgs.gov
- USGS, Mineral Commodity Summaries 2026: Tantalum: pubs.usgs.gov
- USGS, Mineral Commodity Summaries 2026: Industrial diamond: pubs.usgs.gov
- USGS, Mineral Commodity Summaries 2026: Lithium: pubs.usgs.gov
- USGS, Sediment-Hosted Stratabound Copper Deposit Model (SIR 2010-5070-M): pubs.usgs.gov
- DRC Ministry of Mines, CTCPM, Statistiques minieres exercice 2025: wpstorage7ceb827ed5.blob.core.windows.net
- Cadastre Minier de la RDC (CAMI): cami.cd
- Kokonyangi and others, The Mesoproterozoic Kibaride belt (Katanga, SE D.R. Congo), Journal of African Earth Sciences: researchportalplus.anu.edu.au
- Bankable, Alphamin says Bisie revenue up in 2025 (26 January 2026): bankable.africa
- MMTA, Rubaya and the tantalum market: mmta.co.uk
- Ecofin Agency, Kibali delivers strong results amid Congo’s gold sector disruptions (8 December 2025): ecofinagency.com
- Bankable, Higher gold prices lifted Kibali royalties (2026): bankable.africa
- IPIS, Diamonds in the DRC: a sector struggling to shine again (April 2025): ipisresearch.be
- Bankable, Zijin’s Manono lithium investment (February 2026): bankable.africa
- Reuters via Voice of Nigeria, Zijin begins Congo lithium concentrate exports (2026): von.gov.ng
- Fastmarkets, Cobalt export quotas: DRC sets limits (22 September 2025): fastmarkets.com
- Cobalt Institute, Cobalt Market Report 2025 (May 2026): cobaltinstitute.org
- CAMI, Communique CAMI/DG/024/2026: cami.cd
- AngloGold Ashanti, Kibali technical report summary, 31 December 2025: sec.gov
- Peer-reviewed study cited for Kibaran-belt geology (PubMed Central): ncbi.nlm.nih.gov
- Alphamin Resources, record FY2025 tin production (19 January 2026): alphaminresources.com
- Investing News Network, DRC to reclaim unused export quotas from cobalt miners (30 June 2026): investingnews.com
Discussion
Questions, corrections or field experience? Share them below. First-time comments are reviewed before they appear, and your email is never published.
No comments yet. Be the first to add a question or your experience.

 Denkyira Nkoranza Concession
 Mwerezi Minerals Company Limited
 Congo Mining Solutions
 Mining SARL
 SenGold Invest SAS
 Sania Corporation
 Sean Mining Limited
 NTS Group (Pty) Ltd
 Mine4Africa
 Lithspo Minerals Limited
 Tintina Mining Group
 Dalgety Minerals Pty Ltd
 Vortex Minerals Pty Ltd
 Faith At Work (Pty) Ltd
 Geotech Mining Solutions plc
 Vulcan International Limited
 Kidepo Associates
 GKY Mining
 Alkimy SARL
 Double A Trading

 Licence holder · Nigeria · Gold + lithium










