

Client case study · Gold · Tanzania
How Joel Mchomvu Narrowed 28 Hectares to 3 Gold Targets in Tanzania
Joel Mchomvu used satellite gold exploration in Tanzania to narrow 28.1 hectares to three target zones covering about 10% of the land. Joel reports saving 1 to 3 months and up to US$25,000, and plans to drill within 1 to 3 months.
Key takeaways
- Joel Mchomvu’s 28.1 hectares in Tanzania narrowed to 3 target zones covering about 10% of the land.
- Joel reports saving 1 to 3 months and up to US$25,000. These are the client’s own estimates.
- The reports give an exploration target of about 44 to 71 kg of gold, at estimated depths of 35 to 77 m.
- The first drill plan covers 6 holes and about 560 m, with a direction and angle for each target.
- Drilling is planned within 1 to 3 months. It is the step that will test these satellite targets.
In this article
- Who Joel Mchomvu is and what the project set out to answer
- Why small gold parcels need a clear starting point
- How satellite gold exploration in Tanzania worked on this project
- What the reports found across the 28.1 hectares
- How to read the gold grade and value ranges
- The drill plan: six holes and about 560 metres
- The results Joel reports: time and cost saved
- What other small gold projects can learn from this case
- Satellite gold exploration Tanzania: frequently asked questions
Who Joel Mchomvu is and what the project set out to answer
Joel Mchomvu is a Farmonaut mining client in Tanzania. Joel came to us with parcel coordinates and gold as the target mineral. Behind any project like this sits one practical question: which part of the ground deserves the first drill hole? This case study shows how satellite gold exploration in Tanzania helped answer it, and what Joel says the work changed.
Joel sent us coordinates for five small gold parcels. We drew the boundaries and found that two of them, Parcels 2 and 5, sit side by side. That meant they could be studied as one connected piece of ground rather than two separate jobs.
Joel then chose where to begin: Parcels 2 and 5 together, plus Parcel 3. That gave a project of 28.1 hectares, or about 69 acres, studied in two reports. Starting with part of the ground is a sensible way to work. The first results can guide what happens on the remaining parcels.
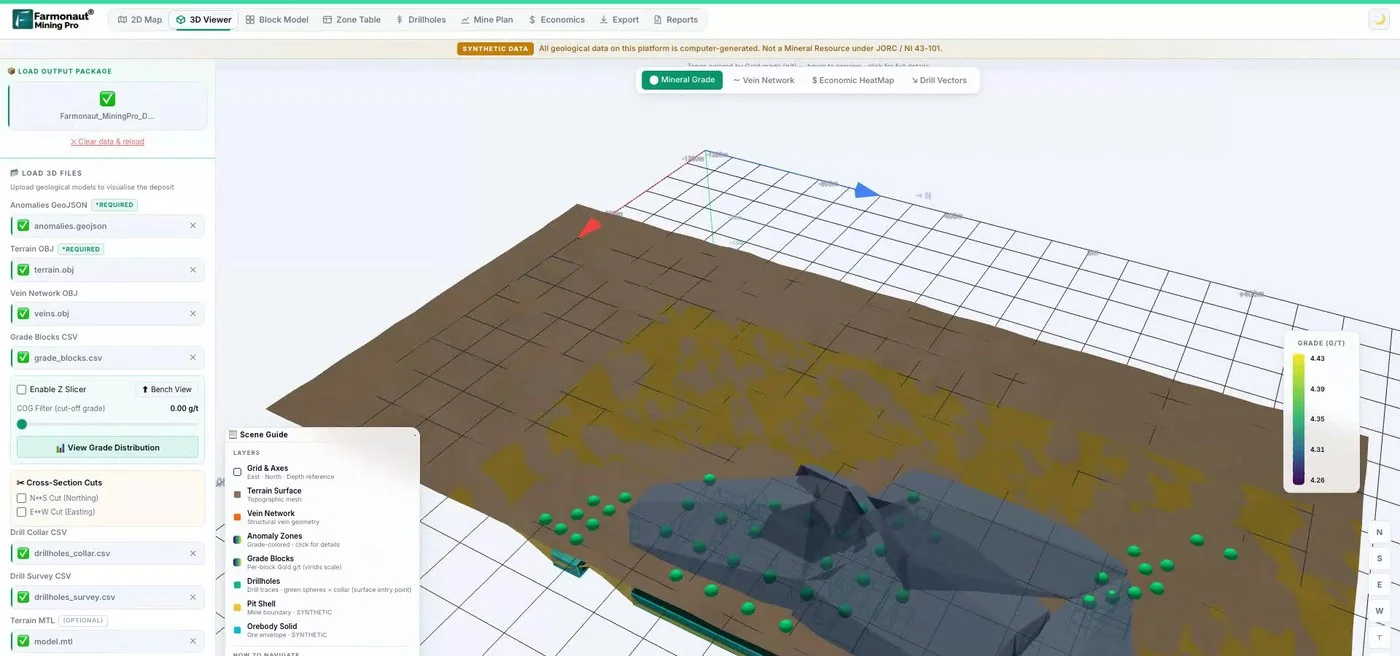
The project used our satellite-based mineral detection service at the Premium+ level. That level includes target zones, depth estimates, a quantity estimate, a commercial conclusion, drilling-angle guidance and a 3D view of each target.
Joel gave us that statement on our client feedback form, along with permission to publish it. On the same form, Joel confirmed that the analysis helped narrow down locations, reduced time and reduced cost. We return to those answers, and their exact bands, later in this article.
Why small gold parcels need a clear starting point
Tanzania has a large and growing small-scale gold sector. The US Geological Survey reports that sales of gold from small-scale mines rose to 4,660 kg in 2019 from 337 kg in 2016, and links the rise to new government mineral trading centres. On a small title, every exploration decision has to count.
On a small parcel, the budget for a first programme can run out quickly. A few drill holes in the wrong place can use up the money set aside for finding out whether the ground holds gold at all. So the first decision matters more than it would on a large exploration licence, where a company may have room for many rounds of work.
The usual options each take time and money before any hole is drilled:
- Walking the ground: geological mapping shows what is exposed at the surface, but soil and vegetation can hide much of it.
- Soil and rock sampling: this gives real chemical results, but a sampling grid across a whole parcel needs people, transport and laboratory fees.
- Ground geophysics: magnetic and electrical surveys can see below the surface, but they need crews and equipment on site.
- Drilling on instinct: this is the fastest way to get an answer and also the most expensive way to get a wrong one.
Satellite analysis sits before all of these. It does not replace them. Its job is to tell you which small part of the ground to look at first, so the mapping crew, the sampling team and the drill rig all start in the same place.
That was the role of this work. The reports gave the 28.1 hectares an order of priority based on satellite data, with depths and drill directions attached to each target.
How satellite gold exploration in Tanzania worked on this project
The client’s part was simple. Joel sent parcel coordinates and named gold as the target mineral. No one needed to visit the site, and no ground was disturbed during this stage. Payment was confirmed on 2 June, and both reports were delivered on 8 June, the date we had promised.
Infographic
How the project moved from coordinates to a drill plan
- 1Send the boundariesJoel sent parcel coordinates. Parcels 2 and 5 touch, so they were studied as one area.
- 2Analyse from spaceMany satellite and terrain layers were combined into one gold potential map.
- 3Rank the targetsTwo reports showed 3 target zones with depths and validation tiers.
- 4Plan the drillingEach zone received a suggested direction, angle and hole length.
- 5Drill and assayThis is the planned next step, and it will test the targets.
Each report combines many layers of data from space into one map of gold potential, called the Gold Potential Index. The map has a ground resolution of 10 metres. Each data source looks for something different, and a zone is more interesting when several of them agree.
- Sentinel-2 optical imagery: this European mission gives 10 m images used for vegetation and for colour signs of altered rock and iron oxides.
- ASTER shortwave infrared: this NASA instrument helps map clay and other minerals that form when hot fluids alter rock.
- Sentinel-1 radar: radar from this mission helps trace long straight features that can mark faults and fractures.
- PALSAR-2 L-band radar: this Japanese radar adds information on rock exposure and surface structure.
- MODIS thermal data: this NASA sensor supplies day and night temperature patterns over the area.
- EMAG2 magnetic grid: this global grid gives regional context on the rocks underneath.
- Copernicus elevation model: this 30 m terrain model gives slope, drainage and landform.
Both reports classify the zones as gossan-style targets. A gossan is rust-coloured oxide material that can cap an ore deposit, formed when sulfide minerals weather at the surface. Geologists have long treated gossans as a clue to what may lie below. Here, that label is a satellite interpretation, and a geologist on the ground would be the one to confirm it.
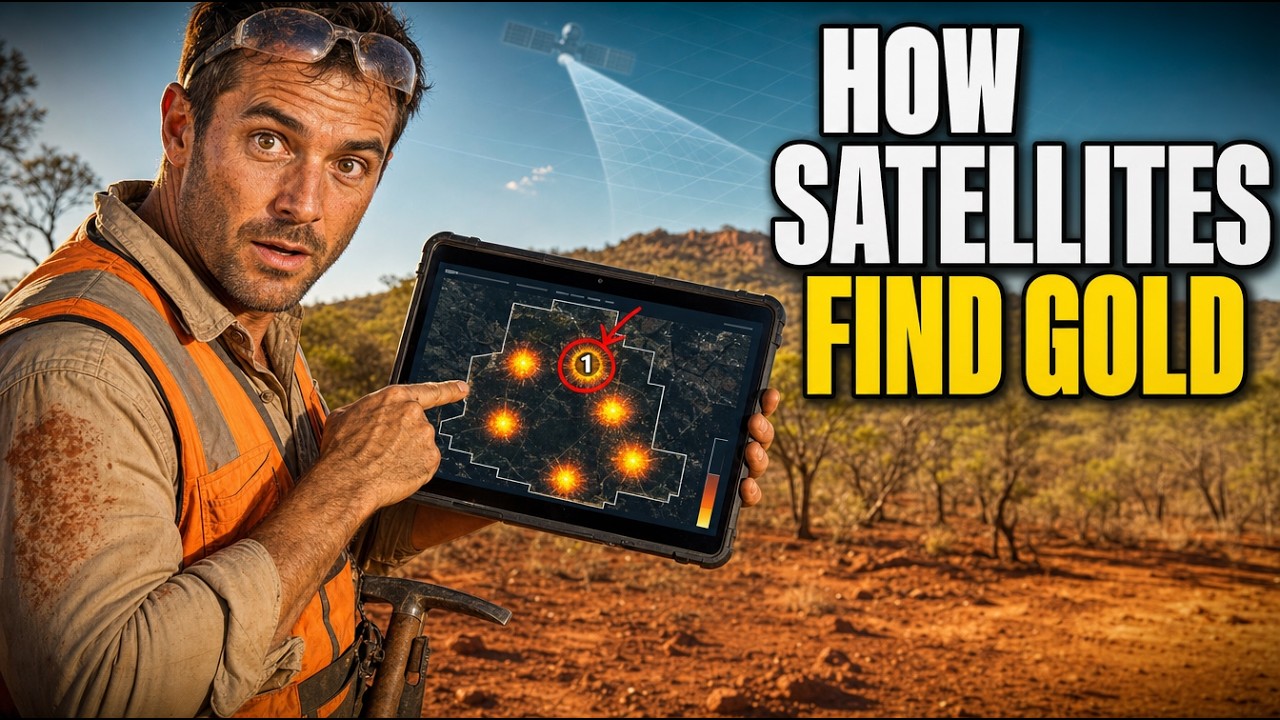
▶ How satellites look for signs of gold, explained through a real report. · 18:54
What the reports found across the 28.1 hectares
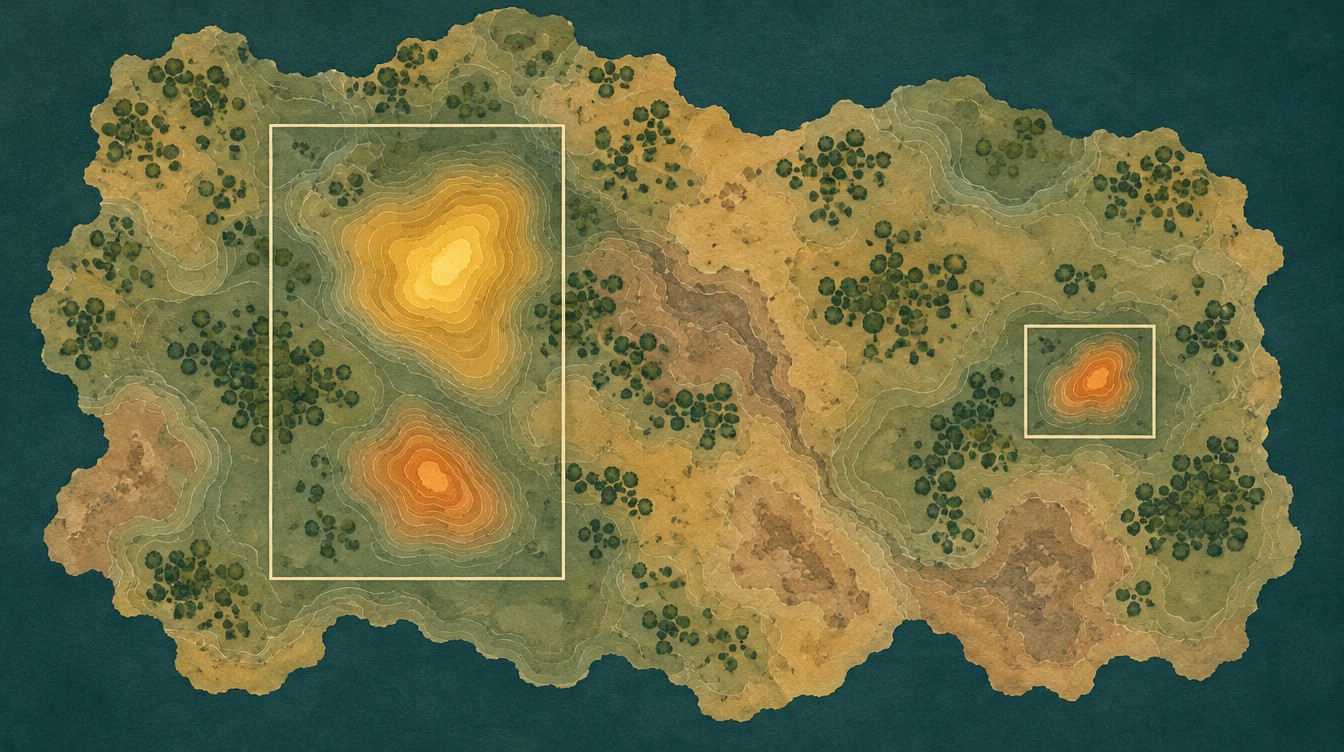
The analysis found three target zones: two on Parcels 2 and 5, and one on Parcel 3. Together they cover 2.86 hectares, which is about 10% of the land checked. For planning purposes, that means the first field work can focus on roughly one hectare in every ten.
Chart
Target zones cover about 10% of the land checked
Hectares, across Parcels 2, 3 and 5
Here is how the three zones compare. To keep things simple, we name them by position rather than by the numbers used inside the reports.
| Target zone | Footprint | Estimated depth | Gold estimate (P10–P90) | Validation tier in the report |
|---|---|---|---|---|
| North zone, Parcels 2 and 5 | 1.70 ha | 42–77 m | 29–44 kg | Medium |
| South zone, Parcels 2 and 5 | 0.80 ha | 35–70 m | 13–23 kg | Low |
| Parcel 3 zone | 0.36 ha | 38–73 m | 2–4 kg | Low |
| All three zones | 2.86 ha | 35–77 m | About 44–71 kg (about 1,410–2,280 oz) | Field checks on all three |
Source: Farmonaut detection reports dated 8 June 2026. Gold figures are satellite-based exploration target estimates, not measured resources. The tier sets the order of field checks.
The North zone stands out. It has the largest footprint and the largest share of the estimated gold, and it holds the highest validation tier of the three. If only one place could be tested first, the report data points here.
The South zone is smaller but sits at the shallowest depth, with the top of the target estimated at about 35 metres. The Parcel 3 zone is much smaller. Finding it is still useful, because it tells the project that Parcel 3 has one specific place to check rather than 9.5 hectares of open questions.
The reports also rate all three zones as having easy terrain access, with average slopes of about 8 to 9 degrees. That is helpful for planning how a rig and a field crew would reach each site.
What Joel received goes beyond the PDF reports. The pack also included GeoTIFF map layers, GeoJSON outlines of each zone and an elevation model for 3D work. A geologist can open these in standard mapping software and lay them over field notes, old workings or licence boundaries. That matters on a small project, where the person planning the work may need to share the same files with a consultant, a contractor and an investor.
The reports estimate about 42,000 tonnes of mineralised rock across the three zones as a central figure. The estimated strip ratio is about 1.0 to 1.2 tonnes of waste rock for each tonne of target rock, which gives an early idea of how much material surface mining might need to move. These are planning figures that drilling would need to test.
How to read the gold grade and value ranges
Gold grade is usually given in grams per tonne, written g/t. It tells you how many grams of gold are estimated in each tonne of rock. Each report looks at the grade pixel by pixel across a zone, and the chart below shows the middle 80% of those pixel values.
Chart
Estimated gold grade across each zone
Pixel grade in g/t, P10 to P90
P10 means that 10% of the pixels in a zone sit below that value. P90 means that 90% sit below it. So the bar shows the spread across each zone, without the extremes at either end.
The reports also give a head grade for each zone: 1.82 g/t for the North zone, 1.65 g/t for the South zone and 0.90 g/t for Parcel 3. The head grade is an average. A small number of high pixels can pull an average upward, which is why the North zone’s average of 1.82 g/t sits above its P90 of 1.71 g/t, while its median is 1.38 g/t. All three zones sit above the 0.25 g/t cut-off grade used in the reports.
To get a gold range for each zone, we multiplied its estimated tonnage by the P10 and P90 grades. That gives the band of about 44 to 71 kg across all three zones. The reports’ own central estimate, built on those average grades, is about 71 kg, so it sits at the top of that band.
At the reports’ reference price of US$4,440 per troy ounce on 8 June 2026, that band equals a gross in-situ value of roughly US$6.3 million to US$10.1 million. Gross in-situ value is simply the gold estimate multiplied by the price. It does not subtract mining, processing or any other costs, and it is not a forecast of profit.
Chart
Gross in-situ value band at different gold prices
US$ million at gold prices in US$ per oz; all 3 zones, low uses P10 grades, high uses P90
The gold price is one of the few numbers here that changes every day, so check a current source such as the LBMA or Kitco before you use any value figure. You can test the same arithmetic on your own target with the calculator below.
Calculator
What is a gold target worth on paper?
Enter your own target. All amounts are in US dollars.
- Contained gold (kg): 10.0
- Contained gold (troy oz): 322
- Value after recovery (US$): $1,028,823
Example values only, not a benchmark, and not related to this project. 1 troy ounce is 31.1035 g. The gold price is an example, so check today’s price. Gross value is before mining and processing costs.
The drill plan: six holes and about 560 metres
A map of targets is useful, but a project also needs to know how to test them. This is where the Premium+ report goes further. For each zone it gives a suggested drilling direction, angle and hole length, based on the direction in which the target appears to run.
The idea behind the angle is simple. A hole drilled across a target tests it better than one drilled along it. So each suggested hole points across the estimated trend of its zone, and is angled at 70 degrees below horizontal.
| Target zone | Holes | Direction | Angle | Length per hole | Total metres |
|---|---|---|---|---|---|
| North zone | 2 | 145° | -70° | 98 m | 197 m |
| South zone | 2 | 180° | -70° | 89 m | 179 m |
| Parcel 3 zone | 2 | 180° | -70° | 93 m | 186 m |
| Total | 6 | About 560 m |
Source: Farmonaut detection reports dated 8 June 2026. Totals are rounded. A geologist and drilling contractor would confirm the final plan on site.
Chart
Suggested drilling metres by target zone
Metres, 2 holes per zone
The reports suggest HQ diamond core drilling, which brings up a solid cylinder of rock that a geologist can log and a laboratory can test. They also suggest a composite sample for test work on how well gold could be recovered, along with detailed geological mapping.
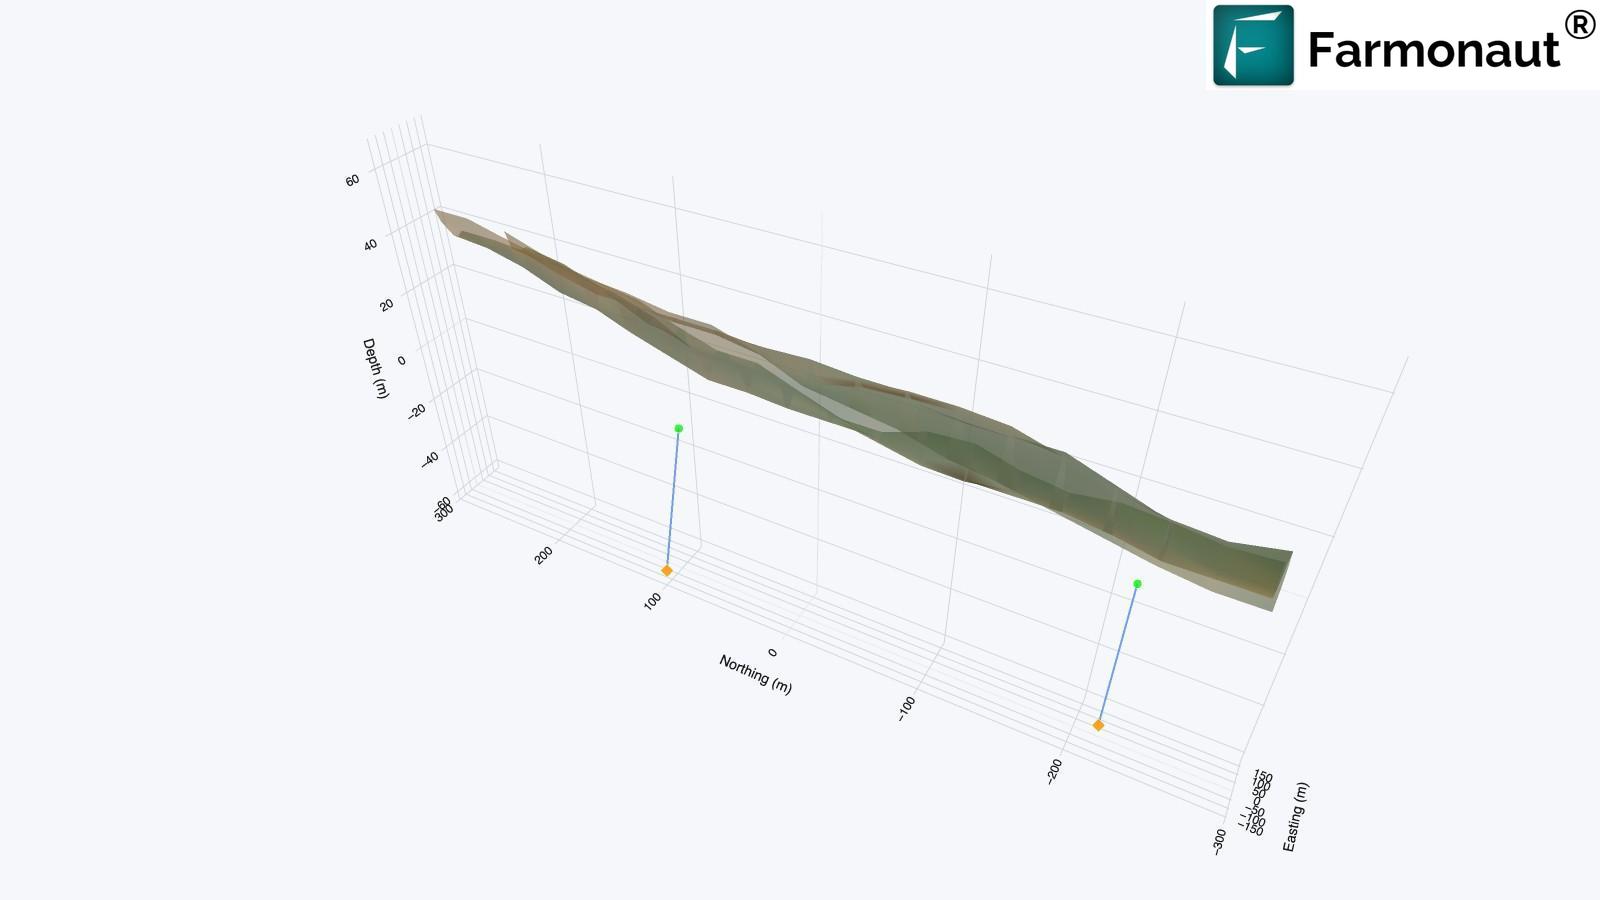
Joel told us the ground has not been drilled yet and that drilling is planned within the next 1 to 3 months. That is the natural next step, because drilling and assays are what turn a satellite target into measured evidence. With this plan, the rig can begin with defined targets, directions and depths.
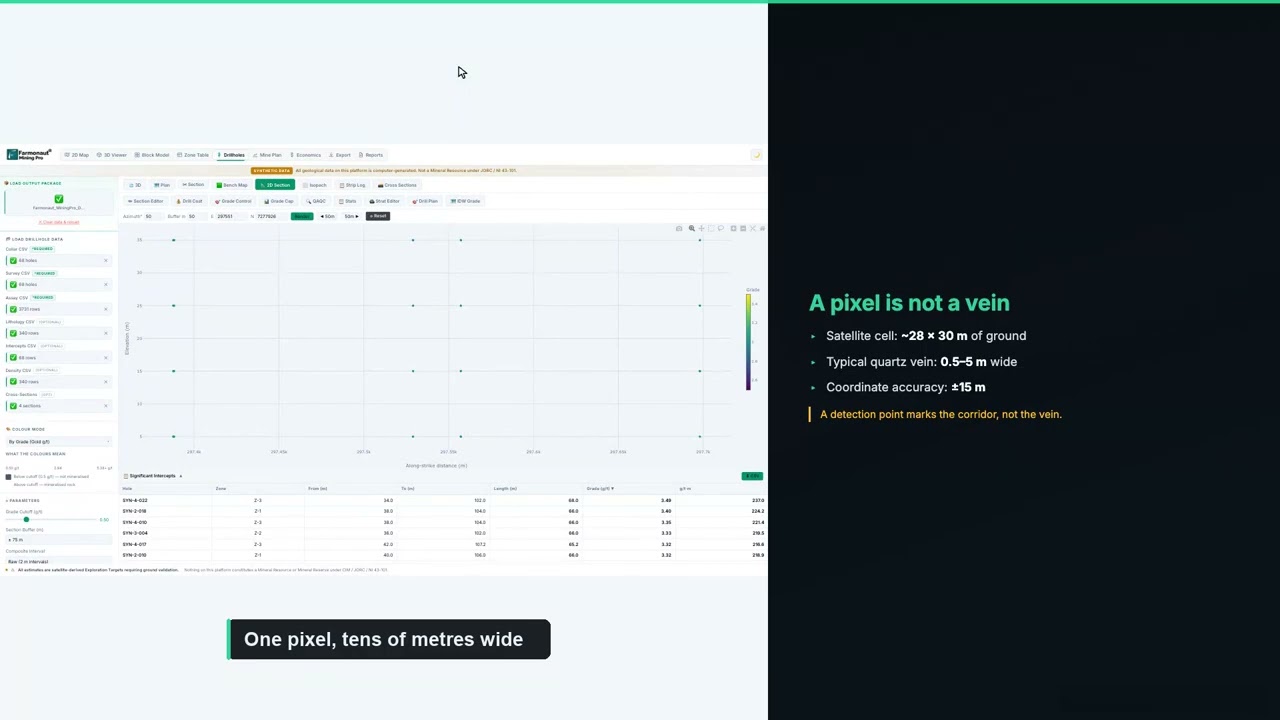
▶ How to plan a drilling programme once you have targets. · 5:49
If you are budgeting a similar programme, enter your own contractor’s rates below. The default values are round examples rather than typical prices, since costs vary widely with location, rock type and rig availability.
Calculator
What would a first drill programme cost?
Enter your contractor’s quote. All amounts are in US dollars.
- Total metres: 540
- Cost per hole (US$): $11,633
Example values only, not typical prices. Costs vary with location, rock type and rig availability, so use real quotes from your contractor and laboratory.
The results Joel reports: time and cost saved
Joel completed our client feedback form on 5 November. Here is what the form records, in Joel’s own selections:
- Narrowed locations: yes. The analysis helped narrow down where to look.
- Time: yes, it reduced time, with savings in the band of 1 to 3 months.
- Cost: yes, it reduced cost, with savings in the band of up to US$25,000.
- Next step: drilling is planned within 1 to 3 months.
- Testimonial: yes, Joel agreed to share a statement with us.
Those answers fit the way this kind of study is meant to work. Time savings come from skipping the slower job of working across every parcel on foot before deciding where to focus. Cost savings come from sending people and equipment to a smaller area, and from avoiding holes that have no clear reason behind them.
For a project of this size, those bands are significant. A saving of even a few weeks can matter when a licence has work obligations or when an investor is waiting for a decision. And money saved at the targeting stage can go toward the drilling and laboratory work that follow.
There is also a planning benefit that is harder to put a number on. A ranked target list gives everyone involved the same starting point. A field geologist knows which zone to walk first, a drilling contractor can price a defined number of holes and metres, and an investor can see how the money would be used. Joel’s remaining parcels can follow the same path whenever the time is right, using what the first drill results show.
The work also fits a lighter way of exploring. Because the study happens from space, nothing was dug, cleared or driven across during this stage. Field disturbance can then be limited to the places that have earned a closer look.
What other small gold projects can learn from this case
Several parts of Joel’s approach would work on other small gold projects, in Tanzania or elsewhere.
- Check boundaries first: our boundary review showed that two of Joel’s parcels touched, which allowed them to be studied as one connected area.
- Start with part of the ground: beginning with three of five parcels gives real results to judge before committing to the rest.
- Ask for depth and drill direction: a target map tells you where to look, while depth and direction tell you how to test it.
- Use tiers to set the order: test the highest-tier zone first, and let those results shape the plan for the others.
- Keep the sequence honest: move from satellite targets to mapping and sampling, then to drilling, assays and a formal resource estimate.

▶ A news-style report on satellite gold exploration and mining in Tanzania. · 5:02
Getting a similar study for your own ground follows the same steps. Send your boundary as coordinates, a KML or KMZ file, or a polygon, and name your target mineral. Delivery usually takes 5 to 20 business days, depending on the size of the area and the mineral. You can map your mining site yourself or get a quote from our team.
Want more background first? Read about gold in Tanzania and the Lake Victoria goldfields, or see how another named client used the same approach in our Niger gold case study.
Satellite gold exploration Tanzania: frequently asked questions
What did satellite gold exploration find on Joel Mchomvu’s project in Tanzania?
It found three target zones across 28.1 hectares, covering 2.86 hectares in total, or about 10% of the land. The reports give an exploration target of about 44 to 71 kg of gold across those zones. Drilling has not happened yet, so these remain targets to test.
How much time and money did the client save?
Joel reported saving 1 to 3 months and up to US$25,000 on our feedback form. These are the client’s own estimates for this project.
Can a satellite detect gold directly?
No. Satellites detect signs that are linked with gold, such as altered rock, iron oxides, structures and landforms. The analysis combines those signs to rank where gold is more likely. Drilling and laboratory assays are what confirm gold and its grade.
Is this a JORC or NI 43-101 resource?
No. It is an exploration target that comes before a resource estimate. A resource under JORC or CIM definition standards needs drilling, assays and a qualified person’s work.
How deep are the gold targets?
The reports estimate the targets at about 35 to 77 metres below the surface. The tops of the three zones are estimated at 42, 35 and 38 metres. Drilling is needed to confirm these depths.
What is a gossan zone?
A gossan is rust-coloured oxide material that can cap an ore deposit. It forms when sulfide minerals weather near the surface, which makes it a useful clue about what may lie below.
What does P10 to P90 mean in a gold report?
It describes the middle 80% of grade values across a zone’s pixels. P10 is the value that 10% of pixels fall below, and P90 is the value that 90% fall below. It shows how much the estimate varies across the zone.
How long does a satellite gold report take?
Delivery usually takes 5 to 20 business days, depending on area and mineral. On this project, both reports were delivered on the promised date, six days after payment was confirmed.
What do I need to send to get a report for my own land?
Send your boundary as coordinates, a KML or KMZ file, or a polygon, along with the country or region and your target mineral. Our team checks the boundary with you before the work starts.
Does satellite exploration replace drilling?
No. It helps you decide where to drill. Mapping, sampling, drilling and assays still follow, but they can start from a much smaller area with a clearer plan.
Published with the client’s consent. All resource figures are satellite-based exploration targets and are not Mineral Resources or Ore Reserves under JORC, NI 43-101 or similar codes. No drilling or assay results are available, and no grade has been confirmed. The reports rate one zone Medium and two Low, with none rated High at this stage, and all three go through field checks. Time and cost savings are client-reported bands. Value figures use the 8 June 2026 reference price and are not investment advice. The exact location is withheld.
Farmonaut mineral detection
Map your mining site from space
Send your claim or licence boundary as KML, KMZ or a polygon. Farmonaut returns ranked satellite exploration targets for it, usually in 5 to 20 business days.
Keep reading
Sources
- US Geological Survey, Minerals Yearbook: Tanzania (2019): pubs.usgs.gov
- Tume ya Madini (Mining Commission of Tanzania), application procedure: tumemadini.go.tz
- JORC, The JORC Code (2012 edition): jorc.org
- CIM, Definition Standards for Mineral Resources and Reserves: cim.org
- Encyclopaedia Britannica, Gossan: britannica.com
- Copernicus SentiWiki, Sentinel-2 mission: sentiwiki.copernicus.eu
- Copernicus SentiWiki, Sentinel-1 mission: sentiwiki.copernicus.eu
- NASA JPL, ASTER: asterweb.jpl.nasa.gov
- JAXA, PALSAR-2 data: eorc.jaxa.jp
- NASA, MODIS instrument on Terra: terra.nasa.gov
- NOAA, EMAG2 Earth Magnetic Anomaly Grid: ngdc.noaa.gov
- Copernicus Data Space, Copernicus DEM: dataspace.copernicus.eu
- Minamata Convention on Mercury: minamataconvention.org
- LBMA, precious metal prices: lbma.org.uk
- Kitco, live gold price chart: kitco.com
Discussion
Questions, corrections or field experience? Share them below. First-time comments are reviewed before they appear, and your email is never published.
No comments yet. Be the first to add a question or your experience.

 SRK Consulting
 Berks Gold Limited
 Mwerezi Minerals Company Limited
 Mining SARL
 SenGold Invest SAS
 Sania Corporation
 Sean Mining Limited
 NTS Group (Pty) Ltd
 Mine4Africa
 Lithspo Minerals Limited
 Tintina Mining Group
 Dalgety Minerals Pty Ltd
 Vortex Minerals Pty Ltd
 Faith At Work (Pty) Ltd
 Geotech Mining Solutions plc
 Vulcan International Limited

 Licence holder · Nigeria · Gold + lithium










