

Reviewed September 2026 against USDA NASS, iMarc Group, and University of Illinois farmdoc daily.
Try it: Run your own numbers →
“Farmonaut’s crop finder locates crop nutrient terminals within specific radii, covering numerous locations across North America, and feeds that data straight into your crop planning workflow.”
A crop planning tool only earns its keep if it connects two things farmers usually manage separately: what to plant and where to buy the inputs to grow it. Farmonaut’s precision farming tools pair a cropper finder for nutrient terminals with satellite-based crop planning, so a search for potash or urea and a search for the best planting window run through the same map instead of two separate apps.
63% of US farmers now use farm management software in some capacity, per Farm Management Software Statistics’ 2025–2026 estimate (scoop.market.us). That is the baseline this article works from. Below: how the crop finder locates terminals, what “best crop planning tool” should actually mean for a US operation, whether a farm record analysis tool belongs in the conversation at all, and a calculator for what a terminal run really costs against fertilizer at current prices.
What “Crop Finder” and “Cropper Finder” Actually Mean Here
Both terms point at the same tool: a location-based search that returns crop nutrient terminals and fertilizer distribution centers within a radius you set. It is not a plant-identification tool and not a crop-variety selector — it is logistics. Type in a location, set a radius, and the tool returns terminals stocking potash, phosphates, urea, UAN, AMS, and specialty nutrients, along with operating hours.
- Extensive Network: Access to a wide network of agronomy product terminals across North America.
- Detailed Information: Operating hours and product offerings per terminal, so you don’t drive to a closed gate.
- Streamlined Search: Radius-based results that cut wasted mileage and time.

What Makes a Crop Planning Tool the Best One for a US Farm
“Best crop planning tool” is a query with a real answer, not a marketing line: it is the tool that ties input sourcing, field data, and yield history into one place, and updates as fast as USDA releases new numbers. Three criteria matter for a US operation:
- Live yield benchmarks. USDA NASS put 2025 US corn yield at 186.5 bu/acre, soybeans at 53 bu/acre, and winter wheat at 54.9 bu/acre (farmdoc daily, University of Illinois, May 2026). A planning tool worth using lets you compare your field against these county-level baselines, not a national average alone.
- Input sourcing built in. Planning a nitrogen program without knowing where the nearest urea terminal is and what it charges is planning half the problem.
- Cloud access from the field. 65% of the global farm software market runs on cloud-based solutions as of the 2025–2026 estimate (scoop.market.us), which is what makes a tool usable from a truck cab or a terminal loading dock instead of only a farm-office desktop.
The US precision farming software market itself is not small money: iMarc Group put 2025 US farm management software revenue at $1,114.1 million, projected to reach $4,381.6 million by 2033 at a 19.3% CAGR for 2026–2033 (iMarc Group). North America specifically accounted for $498.95 million of farm management software revenue in the 2025–2026 window (scoop.market.us). That growth is a signal the category is consolidating around fewer, more capable platforms — worth knowing before committing to one that only does half the job.

Hardware Adoption Context: Why Software Now Has to Catch Up
Crop planning software isn’t arriving into an empty field. USDA NASS data shows 70% of large-scale US crop farms already use yield monitors and auto-steering, and 52% of midsize crop farms run guidance autosteer systems (USDA NASS). That hardware throws off field-level data all season — a crop planning tool that can’t ingest it is working with less information than the equipment already sitting in the cab.
Precision Farm Supplies: Sourcing Fits Inside Planning, Not Beside It
“Precision farm supplies” as a search usually means: where do I buy the specific inputs a precision plan calls for, at the rate a variable-rate map specifies. That is exactly what the cropper finder answers once a plan is set. A crop plan calls for a nitrogen rate; the terminal finder shows which nearby locations carry urea or UAN and what hours they’re open; the two together are what a farmer actually needs, not a plan with no supply chain attached to it.
Navigating the North American Agricultural Terminal Network
The crop finder covers an extensive network of locations across North America. A sample of what’s in range, by region:
Midwest Region
- Hennepin, IL: A major terminal offering a wide range of dry and liquid nutrients.
- Mapleton, IL: Known for its extensive selection of specialty nutrients.
- Prairie du Chien, WI: A key distribution center for potash and phosphates.
Southern Region
- Owensboro, KY: Offers a comprehensive range of crop protection products.
- Lumberton, NC: Specializes in UAN and urea distribution.
- Russellville, KY: Known for its efficient loading operations and wide product range.
Eastern Region
- North Amherst, OH: A key supplier of potash and phosphates.
- East Liverpool, OH: Offers a variety of specialty nutrients and crop protection products.
- Statesville, NC: Known for its extensive selection of dry and liquid fertilizers.
“The tool provides information on terminals offering essential supplies like potash, phosphates, urea, and specialty nutrients for precision farming.”
Crop Nutrient Terminal Comparison
| Terminal Name | Location | Operating Hours | Potash | Phosphates | Urea | Specialty Nutrients |
|---|---|---|---|---|---|---|
| Hennepin Terminal | Hennepin, IL | Mon-Fri: 7am-5pm | ✓ | ✓ | ✓ | ✓ |
| Mapleton Facility | Mapleton, IL | Mon-Sat: 6am-6pm | ✓ | ✓ | ✓ | ✓ |
| Prairie du Chien Center | Prairie du Chien, WI | Mon-Fri: 8am-4pm | ✓ | ✓ | ✓ | |
| Owensboro Hub | Owensboro, KY | 24/7 | ✓ | ✓ | ✓ | ✓ |
| Lumberton Distribution | Lumberton, NC | Mon-Fri: 7am-7pm | ✓ | ✓ | ✓ |
This table is not a static snapshot — pull it up inside the crop finder for current hours and stock before a trip, since terminal hours and product mix change seasonally.
Fertilizer Prices: The Number That Makes Terminal Choice Matter
Urea pricing is the clearest reason terminal comparison isn’t a nice-to-have. University of Illinois farmdoc daily projected US urea at $620/ton for the 2026 crop year (farmdoc daily, August 2025), while AgroLatam tracked a US urea price peak of $847/ton in April 2026 — a swing of $227/ton between a projection and an observed peak within the same crop year. That gap is exactly what makes checking multiple nearby terminals worth the extra ten minutes: at 200 tons of urea, it is the difference between a $124,000 and a $169,400 input bill.
How to get today’s number: USDA’s Agricultural Marketing Service publishes weekly commodity reports at ams.usda.gov — search “urea price” for the current Gulf/NOLA spot figure. fertilizer.org also tracks commodity pricing daily. Neither farmdoc’s projection nor AgroLatam’s April 2026 peak will still be current by the time you read this; check AMS before you buy.
Optimizing Farm Operations with Precision Agriculture Logistics
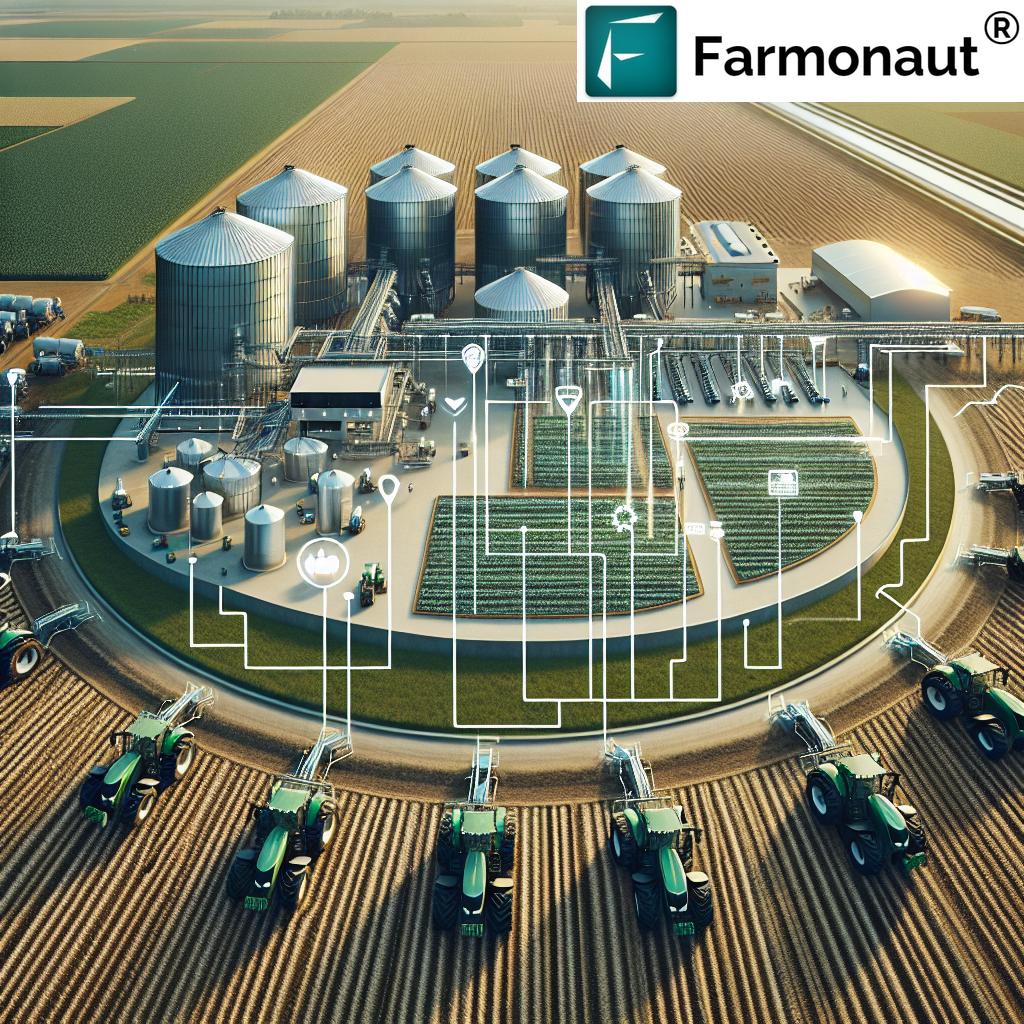
The crop finder is one piece of a larger precision agriculture logistics system. Combined with other precision methods, it becomes a full sourcing-and-planning loop:
- Satellite-Based Crop Monitoring: Assess crop health and nutrient needs from imagery rather than guesswork.
- AI-Powered Recommendations: Determine application rates from data, not a flat per-acre default.
- GPS-Guided Application: Apply nutrients at the rate the plan specifies, not a blanket rate.
- Real-Time Inventory Management: Track nutrient stock and reorder through the terminal finder before you run out mid-season.
Does a Farm Record Analysis Tool Belong Here?
Only at the edge. A crop finder and a crop planning tool answer “where do I buy inputs” and “what should I plant, and how much will it yield” — a farm record analysis tool answers “what did I do last season and does the paperwork hold up,” which is a different job. There is no published USDA or NASS statistic on how many US farms keep digital versus paper-only crop records; the only hard requirement is for FSA program participants under specific climate programs, who must maintain qualifying records with their local FSA office. If recordkeeping compliance is the actual need, that’s a separate tool from planning and sourcing — don’t force one app to do both badly. Financial recordkeeping specifically is the most-adopted software feature among US farm software users: 84% of adopters run a financial management module, per Farm Management Software Statistics (scoop.market.us).

Terminal-Run Cost Calculator
Use current urea price and your own distance and load size to see what a terminal run costs versus the input spend it delivers.
Run your own numbers
Assumptions: hauling cost is a flat per-mile rate you enter yourself and excludes loading time, fuel surcharges, and driver wages beyond that rate. Urea price defaults to farmdoc’s $620/ton 2026 crop-year projection — replace it with the current AMS spot figure before using this for a purchase decision. Does not account for bulk discounts or contract pricing negotiated directly with a terminal.
The Role of Agricultural Cooperative Services
Many terminals in the crop finder network are cooperative-run, which brings benefits beyond the product list:
- Bulk Purchasing Power: Cooperatives can negotiate better prices for inputs.
- Expert Advice: Many cooperatives offer agronomic consulting services.
- Community Support: Cooperatives often reinvest profits into local farming communities.
- Shared Resources: Members can access shared equipment and storage facilities.
Enhancing Sustainability with Precision Nutrient Management
Precision sourcing and precision application work together:
- Reduce Overuse: Apply only the necessary amount of nutrients, cutting runoff.
- Minimize Transportation: Source from nearby terminals to cut transport emissions.
- Improve Soil Health: Balanced nutrient application supports soil health over time.
- Increase Efficiency: Better resource use across the operation.

Integrating the Crop Finder with a Full Planning Workflow
To get full value from a crop finder, tie it to these practices:
- Soil Testing: Determine specific nutrient needs, then source them through the terminal finder.
- Crop Rotation Planning: Plan crop rotations around nutrient availability and terminal locations.
- Precision Application: Use variable-rate technology tied to field maps and terminal proximity.
- Record Keeping: Log nutrient applications and sources for next season’s plan.
A Durable Method: How to Evaluate Any Crop Planning Tool, Year After Year
Numbers in this article — yields, prices, market size — will be out of date within a year. This checklist won’t be. When comparing crop planning tools, score each one against these four questions:
- Does it pull current USDA NASS county yield data, or only a static national average you have to update by hand?
- Does it connect directly to an input-sourcing search (terminal locations, hours, stock), or does planning stop at a recommendation with no path to buy?
- Does it separate planning data from compliance recordkeeping, or does it force one interface to do both jobs poorly?
- Can you check its numbers against a public source in under two minutes? If a tool won’t tell you where a yield or price figure came from, don’t trust the recommendation built on it.
Run any candidate tool through these four checks before adoption, and re-run them annually — a tool that passed last year can silently stop pulling fresh USDA data without an obvious warning.
The Economic Case for Streamlined Sourcing
- Reduced Transportation Costs: Nearby terminals cut travel distance and fuel spend.
- Improved Cash Flow: Efficient sourcing supports better inventory timing.
- Increased Productivity: Less time sourcing means more time on other field tasks.
- Better Pricing: Comparing multiple terminals — as the $620 to $847/ton urea swing above shows — can be worth hundreds of dollars per ton.
Leveraging Farmonaut’s Tools for Comprehensive Farm Management
The crop finder is one part of Farmonaut’s suite of precision farming solutions:
- Satellite-Based Crop Health Monitoring: Real-time imagery to catch issues before they spread.
- AI-Powered Advisory System: Recommendations built from data analysis, not a generic calendar.
- Weather Forecasting: Localized forecasts to time nutrient applications.
- Farm Mapping: Detailed field maps for nutrient application and rotation planning.
Explore Farmonaut’s solutions:



The Role of Data in Modern Agricultural Logistics
- Predictive Analytics: Historical data to forecast nutrient needs and time orders.
- Real-Time Inventory Management: Live feeds to track availability across terminals.
- Route Optimization: Data-driven routing for nutrient transport.
- Demand Forecasting: Aggregated data helping terminals anticipate farmer demand.

Conclusion
A crop planning tool earns the name only when it connects three things: current yield benchmarks (186.5 bu/acre corn, 53 bu/acre soybeans, 54.9 bu/acre winter wheat, USDA NASS 2025 via farmdoc daily), current input pricing (urea projected at $620/ton for the 2026 crop year per farmdoc, observed as high as $847/ton in April 2026 per AgroLatam), and a working crop finder to source those inputs without guesswork. Check the checklist above against any tool before you adopt it, and check AMS for this week’s urea price before you buy — neither this article’s numbers nor any other snapshot will hold for long, and that’s exactly why the method matters more than the figures.
For developers interested in integrating our precision agriculture data into their own applications, check out our API and API Developer Docs.
FAQ Section
Q: How does the crop finder / cropper finder work?
A: It uses location data to return crop nutrient terminals within a radius you set, with terminal locations, operating hours, and available products.
Q: What types of nutrients can I find using this tool?
A: Terminals offering potash, phosphates, urea, UAN, AMS, and specialty nutrients.
Q: Is the crop finder available nationwide?
A: It covers numerous locations across North America, with dense coverage in the Midwest, Southern, and Eastern regions.
Q: What makes a crop planning tool the “best” one for a US farm?
A: One that pulls current USDA NASS yield data, connects directly to input sourcing, and lets you verify every figure against a public source — not one bundling in unrelated recordkeeping features.
Q: Does this replace a farm record analysis tool?
A: No. Planning and sourcing are a different job from compliance recordkeeping; FSA program participants under climate programs should confirm requirements with their local FSA office.
Q: Can I access the crop finder on mobile devices?
A: Yes, it’s mobile-responsive for use from the field.
Explore Farmonaut’s Precision Agriculture Solutions
Visit our website or download our mobile apps to get started:
Further reading:
Farmonaut Subscriptions
A crop planning tool paired with a working crop finder turns two separate searches — what to plant, where to buy — into one workflow, and one you can re-verify against USDA and AMS data every season.

 Rouge VC
 Yutz Automation
 AgroGreen Dynamics
 Leher
Leher AgroRisk
 Oath Inc
 Reddane Farming
 Esri North East Africa
 Cresol
 Atur Kuliner
 MDCV UK
 Zerella Group
 Etech Consulting Madagascar
 Vestlandsforsking
 Delicio
 WB Dev
 Sama Premium
 Prochecker
 Tres Valles
 LACOS Geoinformation
 Magrifly
 LatConnect 60
 Blickwinkel
