

Reviewed September 2026 against Michigan State University Extension, USDA National Agricultural Statistics Service, and USDA Farm Service Agency data.
Try it: Estimated total rate: — →
MSU Extension’s Custom Machine Work Costs report sets its 2026 skilled labor rate at $33.38/hr and unskilled labor at $22.49/hr, using a 4.04% interest rate parameter and $3.03/gallon fuel price as calculation inputs. Separately, USDA data show farm machinery expenses on typical Midwest operations rose from $136/acre in 2021 to $171/acre in 2024 — a 26% jump in three years — while national tractor sales fell 9.86% in 2025 to 195,857 units. Below is what those numbers mean for your rate negotiations, your equipment budget, and your borrowing costs, plus a calculator that turns MSU’s published inputs into a rate estimate for your own acreage.
Table of Contents
- MSU Custom Farming Rates: What’s Actually in the Report
- Labor, Fuel, and Interest: The Three Inputs Behind Every Rate
- Farm Equipment Value: New Machinery vs. the Used Market
- Antique Farm Equipment Value: What’s Published and What Isn’t
- Farm Equipment Interest Rates: FSA vs. the Market
- Farm Operations Efficiency: Where the Data Actually Points
- Drone Spraying and Custom Rate Comparisons
- Custom Rate Calculator
- Technology Tools That Complement Custom Rate Decisions
- FAQ
- Try it: Estimated total rate: —

MSU Custom Farming Rates: What’s Actually in the Report
Michigan State University Extension publishes the Custom Machine Work Costs report annually, and it remains the most-cited benchmark for custom farming rates in the Midwest — not because Michigan operations are representative of every region, but because MSU is one of the few land-grant universities that surveys and publishes a full rate table every year. The report is built from a survey of Michigan custom operators and combines labor, fuel, repairs, depreciation, and interest into per-acre or per-hour total rates for more than 50 field operations.
The three inputs that drive every rate in the report, per the MSU Extension Custom Machine Work Costs page, are:
| Input | 2026 Value | Role in the Rate Formula |
|---|---|---|
| Skilled labor rate | $33.38/hr | Applied to operations requiring calibration, chemical handling, or precision guidance (spraying, planting) |
| Unskilled labor rate | $22.49/hr | Applied to lower-complexity tasks (hauling, basic tillage passes) |
| Interest rate parameter | 4.04% | Used to calculate the annual cost of capital tied up in machinery |
| Fuel price | $3.03/gallon | Baseline diesel cost used to compute fuel expense per operation |
These four numbers are the reason MSU’s report is useful even outside Michigan: rather than publishing a static price list, MSU publishes the formula. If your local skilled labor rate, diesel price, or interest cost differs from MSU’s baseline, you can substitute your own figures into the same structure MSU uses and get a rate that reflects your actual costs rather than a number calculated for a different county. That is the durable part of this guide — the rates themselves will be revised every December, but the method for adjusting them will not.
MSU’s report is downloaded as a full spreadsheet or PDF from the link above; it is updated in December each year, so a rate you read here in one growing season should be checked against the live page before you sign a contract for the next one. The per-operation dollar figures for specific tasks (plowing, planting, combining, baling) are published inside that PDF and spreadsheet rather than in MSU’s public web summary — if you need the exact current per-acre number for a specific operation, that document is the primary source; treat any secondhand table you find elsewhere, including tables that pre-date the current MSU release, as a starting point for negotiation rather than a quote.
Labor, Fuel, and Interest: The Three Inputs Behind Every Rate
Understanding how MSU builds a rate matters more than memorizing any single number, because the same formula lets you re-price a job the moment one input changes. A custom rate is, at its simplest, labor cost plus fuel cost plus a machinery ownership cost (which itself bakes in depreciation, repairs, insurance, and interest). Move any one of the four inputs above and the total rate moves with it.
Take fuel as an example. MSU’s 2026 baseline is $3.03/gallon. If your local diesel price runs $0.40/gallon higher, a spraying pass that burns 1.5 gallons/acre costs you an extra $0.60/acre in fuel alone before you’ve touched labor or machinery cost. Multiply that across a 2,000-acre operation and the gap between MSU’s baseline and your actual cost is $1,200 for a single pass — which is exactly why MSU frames its numbers as a starting point for negotiation, not a fixed price.
The interest rate parameter works the same way, but on the ownership side. MSU’s 4.04% figure represents the estimated cost of capital tied up in a machine that isn’t being used for anything else. If your operating loan carries a materially different rate — see the FSA comparison below — your true ownership cost per acre will diverge from MSU’s published rate accordingly, and larger, more capital-intensive equipment (a combine vs. a baler) will show the widest gap.
Farm Equipment Value: New Machinery vs. the Used Market
Farm equipment value has moved on two different tracks recently, and conflating them is the most common mistake in a private-sale negotiation. USDA National Agricultural Statistics Service data, cited via University of Illinois farmdoc daily, put total US farm equipment and machinery inventories at $5.72 billion as of December 2025, with annual tractor sales of 195,857 units in 2025 — down 9.86% year-over-year — and combine sales at just 3,579 units for the same year. That is a genuine pullback in new-equipment purchasing, not a rounding blip.
At the same time, USDA NASS’s Machinery Prices Paid index — the measure of what farmers are actually paying for equipment, parts, and repairs — rose only 0.8% year-over-year as of December 2025, per the USDA NASS land value report. That’s a sharp deceleration from the double-digit machinery inflation of recent years, and it tells a specific story: fewer units are moving, but the price per unit paid has largely stabilized rather than falling. For a farmer weighing a purchase, that combination — falling unit sales, flat-to-slightly-up prices — suggests dealers are holding the line on pricing rather than discounting to move inventory, which is a different negotiating position than a falling-price market would give you.
On the cost side, USDA figures show machinery-related expenses on typical Midwest farms climbing from $136/acre in 2021 to $171/acre in 2024 — a $35/acre increase, or roughly 26% over three years, per the same farmdoc daily analysis. That single figure explains much of why custom-hire decisions have become more attractive relative to ownership over that period: as the per-acre carrying cost of owning machinery rises, the breakeven acreage at which ownership beats custom-hire also rises, pushing more mid-size operations toward hiring out specific passes rather than owning every implement.
For a current used-equipment price on a specific make and model, USDA’s aggregate figures won’t get you there — they measure the market, not an individual machine. AgDirect’s used equipment market update and Iron Solutions’ equipment value guides both track specific model pricing and are the right next stop if you need an appraisal-grade number for a particular tractor, combine, or implement rather than a market-wide trend.
Antique Farm Equipment Value: What’s Published and What Isn’t
If you’re trying to price a specific antique tractor or implement — a pre-1960s row-crop tractor, a horse-drawn implement, a restored steam engine — there is no USDA, USDA NASS, or MSU dataset that tracks vintage or collectible farm equipment values. USDA’s Machinery Prices Paid index and NASS’s inventory figures are built from the current commercial equipment market: tractors, combines, and implements actively used in production agriculture, not restored or collector-grade machines held for their historical value.
That’s a real gap, not an oversight in this guide — the sources available for this article do not include an antique-equipment depreciation curve or a vintage pricing index, and it would be wrong to present one as if it existed. Antique equipment pricing runs on its own market, driven by restoration condition, rarity, and collector demand rather than the labor, fuel, and depreciation inputs that set custom work rates. If you need a current value on a specific antique machine, your most reliable options are:
- Completed auction results for the same make, model, and condition — auction houses that specialize in farm equipment publish hammer prices, which reflect actual sale data rather than asking prices.
- Antique tractor and equipment club appraisals — collector clubs organized around specific manufacturers (a common structure in the antique tractor hobby) often maintain informal value guides based on member sales.
- A specialty appraiser for insurance or estate purposes, particularly if the equipment is being valued for a sale, donation, or insurance claim rather than personal reference.
None of those routes will give you a single authoritative number the way MSU’s report does for custom rates — antique equipment value is inherently comparable-sale-based, not formula-based, and that is the honest answer rather than a manufactured figure.
Farm Equipment Interest Rates: FSA vs. the Market
Financing cost is one of the four inputs MSU bakes into every custom rate, and it’s also a direct cost for anyone financing an equipment purchase outright. The one interest-rate figure with a clear, current, published source is the USDA Farm Service Agency’s direct lending rates. As of the FSA’s December 2025 lending rate announcement, the direct operating loan rate for January 2025 was 5.125%, and the direct farm ownership loan rate for the same period was 5.625%.
| Rate Type | Value | Period | Source |
|---|---|---|---|
| MSU custom-rate interest parameter | 4.04% | 2026 report | MSU Extension |
| FSA direct operating loan rate | 5.125% | January 2025 | USDA Farm Service Agency |
| FSA direct farm ownership loan rate | 5.625% | January 2025 | USDA Farm Service Agency |
The gap between MSU’s 4.04% parameter and the FSA’s 5.125%–5.625% range matters if you’re comparing a custom-hire quote against the true cost of financing your own equipment: MSU’s rate is a modeling assumption for depreciation and opportunity-cost purposes, while the FSA rates are actual loan pricing available to eligible producers through USDA’s direct lending programs. Commercial and dealer-financed equipment loans run on their own pricing separate from FSA’s programs, and no single published index tracks private-lender farm equipment rates the way FSA publishes its own — if you’re shopping a commercial loan, the FSA rate above is your benchmark for comparison, and getting a competing rate quote from your equipment dealer or bank is the only way to know where you stand against it. FSA updates its lending rates monthly, typically announced the first business day of the month, so check the FSA announcement page directly for the current month’s figure before using it in a financing decision.
Farm Operations Efficiency: Where the Data Actually Points
“Efficiency” in farm operations gets used loosely, so it’s worth being specific about what’s actually measurable from published data versus what would need farm-specific tracking. The clearest efficiency signal in the sources behind this guide is the widening gap between machinery expense per acre ($136 in 2021 to $171 in 2024, a 26% rise) and the much smaller 0.8% year-over-year rise in the Machinery Prices Paid index as of December 2025. Read together, those two figures say that per-acre machinery cost has been rising faster than the price of machinery itself — which points to utilization, not price, as the efficiency lever operations can still pull.
In practice, that means the efficiency question for most operations isn’t “can I buy cheaper equipment” but “am I running the equipment I have across enough acres, or should specific passes move to a custom operator whose per-acre cost is lower because the same machine runs across many farms.” That’s the direct link between MSU’s custom rate report and an operations-efficiency decision: a custom rate is, in effect, a quoted price for someone else’s machine-utilization efficiency, and MSU’s formula (labor + fuel + ownership cost, spread across whatever acreage the operator runs) is how that efficiency gets converted into a price you can compare against your own per-acre machinery cost.
Beyond that expense-per-acre comparison, there is no published, current-year dataset in the sources for this guide that quantifies labor-hours-per-acre or fuel-efficiency-per-pass improvements at a national level — those figures would need to come from your own field records (hours logged per pass, gallons burned per acre) compared year over year, since no USDA or MSU report tracks them at the granularity an individual operation would need for a real efficiency benchmark.
Drone Spraying and Custom Rate Comparisons
Drone spraying has grown into its own line item in custom work discussions because it changes two of MSU’s four rate inputs directly: labor and fuel. A spray drone requires a licensed operator (skilled-labor-rate territory under MSU’s framework) but burns a fraction of the fuel of a ground rig or manned aircraft, and it can access fields that self-propelled sprayers cannot — steep terrain, wet ground, or standing crop too tall for ground equipment.
There is no MSU-published per-acre rate specifically for drone application in the sources gathered for this guide — drone spraying is recent enough, and adoption varies enough by region, that it isn’t yet a standard line in every state’s custom rate survey the way moldboard plowing or corn planting are. The comparison that does hold up from the data on hand: self-propelled ground sprayers are priced on MSU’s four-input formula (skilled labor at $33.38/hr, fuel at $3.03/gallon, plus machinery ownership cost), and any drone-service quote you get locally can be sanity-checked against that same structure — ask the operator to break down their quote into labor, fuel/battery, and equipment-ownership components, and you can compare it apples-to-apples against a ground-rig custom rate rather than comparing two black-box numbers.
If drone spraying rates for your state aren’t in a public university extension report yet, the most reliable current number is a direct quote from two or three licensed operators in your area, broken into those same cost components — which also gives you a negotiating basis grounded in MSU’s own rate logic rather than a flat “market rate” you can’t verify.
Custom Rate Calculator
Use MSU’s own published inputs to estimate a custom rate for your acreage — adjust any input to match your local labor, fuel, or interest costs rather than relying on Michigan’s baseline.
Estimated total rate: —
Assumptions: labor and fuel defaults reflect MSU's 2026 published parameters; "acres per hour" and "ownership cost" are yours to set based on your equipment and should be adjusted from your own records. This estimate excludes repairs, insurance, and operator travel time, which MSU's full spreadsheet accounts for separately — use the MSU worksheet for a complete per-operation figure.

Technology Tools That Complement Custom Rate Decisions
MSU's rate formula tells you what a pass should cost; it doesn't tell you when or where to run it. That's the gap satellite monitoring and farm-management software are built to close, and it's a genuinely separate decision from which rate to negotiate. Farmonaut provides satellite-based crop health monitoring and AI-driven advisory tools that help identify which fields or zones actually need a spray pass, a fertilizer application, or an irrigation cycle — turning a blanket custom-hire decision into a targeted one.
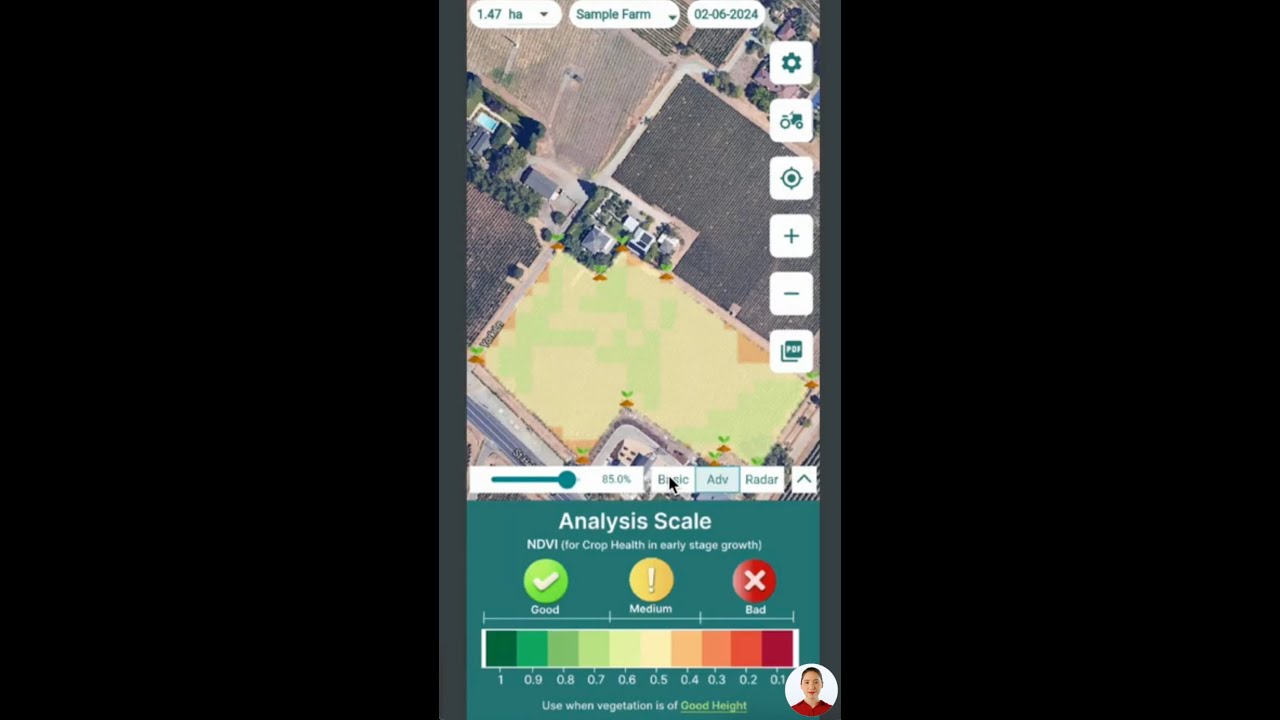
For operations weighing custom-hire against ownership, Farmonaut's crop plantation and forest advisory services add a layer of field-level insight that can sharpen the timing question: if satellite data shows uneven crop stress across a field, a variable-rate custom application may be worth more than a flat per-acre rate, even at a premium.
Several other Farmonaut tools intersect directly with the cost categories this guide covers:
- Carbon Footprinting: Tracks emissions data relevant to operations weighing fuel-efficient custom services against their own diesel-burning equipment.
- Product Traceability: Documents input applications and field operations, useful when reconciling custom-operator invoices against actual field work performed.
- Crop Loan and Insurance: Satellite-based verification for loan and insurance processes, relevant to the equipment-financing questions raised above.
- Fleet Management: Tracks machinery usage and utilization, the exact metric that determines whether owning equipment or hiring it out is the better economic call for your acreage.

For larger operations managing multiple fields, custom operators, and equipment financing decisions simultaneously, Farmonaut's large-scale farm management solutions centralize the field-level data needed to make those calls with current information rather than last season's assumptions.

How to Keep These Numbers Current
Every figure in this guide has a publication date and a refresh path, because none of them are static:
- MSU custom work rates, labor rates, and interest parameters: updated annually each December at the MSU Extension Custom Machine Work Costs page.
- USDA FSA lending rates: updated monthly, typically the first business day of the month, at the FSA news page.
- USDA NASS Machinery Prices Paid index: updated monthly within NASS land value reports; the Quick Stats database offers query access for the current figure.
- Farm equipment sales and inventory data: tracked in farmdoc daily's ongoing market coverage, sourced from USDA NASS.
The method that doesn't expire: any custom rate, from any state or any year, breaks down into the same four components MSU uses — skilled or unskilled labor, fuel, machinery ownership cost (repairs, depreciation, insurance, interest), and a margin. When a quote looks out of line with what you'd calculate yourself, ask the operator to break it into those components before you negotiate on the total.
FAQ
- Q: How often does MSU update its custom work rates?
A: Annually, each December. The 2026 report set skilled labor at $33.38/hr and unskilled labor at $22.49/hr; check the MSU Extension page directly for the current release. - Q: Is there a published value guide for antique farm equipment?
A: No. USDA and MSU data cover current commercial equipment, not vintage or collector machines. Antique values come from completed auction results, specialty appraisers, or collector-club sale records — there is no single index. - Q: What's the current farm equipment interest rate?
A: The USDA Farm Service Agency's direct operating loan rate was 5.125% and its direct farm ownership loan rate was 5.625%, both for January 2025 per the FSA's December 2025 announcement. MSU's custom-rate calculations use a separate 4.04% parameter. FSA rates update monthly — check the FSA announcement page for the current month. - Q: Are farm equipment values rising or falling?
A: Both trends exist at once. Unit sales are falling (tractor sales down 9.86% in 2025 to 195,857 units), while the Machinery Prices Paid index rose only 0.8% year-over-year as of December 2025 — prices have largely held rather than dropped despite weaker sales volume. - Q: How do I calculate a custom rate for an operation MSU doesn't list a current per-acre figure for?
A: Use the four-input method: (labor rate ÷ acres covered per hour) + (fuel used per acre × fuel price) + machinery ownership cost per acre. The calculator on this page runs that formula with MSU's 2026 labor and fuel defaults already filled in. - Q: How can satellite monitoring reduce reliance on blanket custom applications?
A: By identifying which specific zones within a field need treatment, tools like Farmonaut's crop health monitoring can turn a whole-field custom pass into a targeted one, avoiding payment for coverage on areas that don't need it.
For more on integrating farm management technology with your custom-hire and equipment decisions, visit Farmonaut's website or the mobile apps:



Earn With Farmonaut
Earn 20% recurring commission with Farmonaut's affiliate program by sharing your promo code and helping farmers save 10%. Onboard 10 Elite farmers monthly to earn a minimum of $148,000 annually—start now and grow your income!
Learn More About Farmonaut's Affiliate Program
Explore Farmonaut's Subscription Options

 Suminter India Organics
 Crossprod
 Patrick America
 Liquify Digital
 CU Foods
 BeyondTech Global
 Rouge VC
 AgroGreen Dynamics
 AgroRisk
 Oath Inc
 Reddane Farming
 Esri North East Africa
 Cresol
 MDCV UK
 Zerella Group
 Etech Consulting Madagascar
 Vestlandsforsking
 Delicio
 WB Dev
 Sama Premium
