

Egypt Arable Land: The Real Percentage and Why It’s Shrinking
Reviewed September 2026 against FAO country data and the UNCCD Egypt National Action Plan.
Try it: Enter values above to see estimated savings. →
Egypt’s Arable Land, in One Answer
Egypt’s arable land totals roughly 3.6% of the country’s land area by World Bank/FAO land-use accounting, and in practical terms it is smaller than that headline number suggests: cultivation is confined almost entirely to a narrow ribbon along the Nile Valley and the Nile Delta, because the other 96%+ of the country is desert with no reliable water source. That single fact — a nation of over 100 million people farming a strip of land a few kilometers wide — is the reason every other statistic in this article behaves the way it does: water allocation, soil salinity, and urban sprawl all collide inside the same narrow footprint, because there is nowhere else for them to happen.
This is not a new squeeze and it is not a 2025-specific one. It is a continuing story shaped by a 1954 water-allocation treaty, a dam built in the 1960s, and a desert-reclamation push that has run for decades with mixed results. Below is what is actually published, dated, and sourced — plus how to check whether any of it has moved since this was last reviewed.



Why the Percentage Is So Low: Nile Valley & Delta
A Farming System Built on One River
Egyptian agriculture has run on the Nile’s water for millennia, but the mechanism changed completely in the 20th century. Before the Aswan High Dam (completed 1970), the Nile flooded annually and deposited silt across the valley, renewing soil fertility for free. After the dam, that flood cycle stopped. Farmland is now fed almost entirely by engineered irrigation rather than seasonal flooding — the FAO-sourced water use data for Egypt puts the share of agricultural land under surface-water (Nile-fed) irrigation at over 90%, which means the entire farmed area depends on a single managed water source rather than a distributed rainfall system.
The 1954 bilateral water agreement that still underpins Egypt’s planning allocates the country 55 billion cubic meters of Nile water per year, according to FAO’s Egypt country profile. That number has not scaled with population growth — Egypt’s population has more than tripled since the treaty was signed — so per-capita water availability has been falling for decades even where the absolute allocation hasn’t changed. Any reporting on Egypt’s water security should be checked against this baseline figure, since it is the fixed input against which a growing population and new upstream infrastructure like Ethiopia’s Grand Ethiopian Renaissance Dam are both variables.
What “Arable Land Percentage” Actually Measures
When people search “percentage of arable land in Egypt,” they’re usually looking for a single World Bank/FAO indicator — arable land as a share of total land area. For Egypt that figure sits in the low single digits (commonly cited around 3%), because the denominator includes the Western and Eastern Deserts and the Sinai, none of which are cultivable without large-scale irrigation investment. This is structurally different from a country like the United States, where USDA cropland statistics span a continental land base with natural rainfall across most of it. Comparing Egypt’s percentage to a rainfed country’s percentage without accounting for that difference is the most common way this figure gets misread.
The durable way to verify this yourself, rather than trusting any single year’s snapshot: pull the World Bank’s “Arable land (% of land area) — Egypt, Arab Rep.” series (sourced from FAO), which updates annually, and cross-check it against FAO’s own country profile data on cereal yields and land use, linked below. Both track the same underlying agricultural census inputs, so a gap between them is a signal to check publication dates rather than to average the two.
- Cereal yield context: FAO’s Egypt country profile records wheat yields at 6.61 tonnes/hectare and rice yields at 9.79 tonnes/hectare — both well above global averages for those crops, which is the point: Egypt’s farmland is small but intensively productive per hectare, because Nile irrigation delivers consistent water in a way most rainfed systems cannot. Source: FAO Country Profile: Egypt.
- Self-sufficiency: the same FAO profile put Egypt’s wheat self-sufficiency ratio at 50.4% for the 2001–2003 period — meaning roughly half of wheat consumption was already being met by imports two decades ago, before the population pressure of the following decades. There is no more recent self-sufficiency ratio in this brief’s source set; the FAO country profile is the place to check for an updated figure.
Arable Land Distribution: What’s Published and What Isn’t
- Egypt’s cultivated area is concentrated in the Nile Valley and Delta, with the reclaimed-desert share growing slowly through named government projects (see the reclamation section below).
- An exact current hectare total for 2026 is not in this brief’s source set — the FAO/World Bank arable-land series is the correct place to pull it, since it is refreshed on an annual reporting cycle from national agricultural census data.
- Urbanization and desertification both reduce the cultivable base over time; the UNCCD’s Egypt National Action Plan (cited below) is the authoritative document tracking degradation trends, and it is revised on a multi-year cycle rather than annually.
Current Pressures on the Base
- Water Dependency: agriculture consumes about 85% of Egypt’s Nile water allocation, per FAO/UNCCD-sourced data — the largest single draw on the country’s one major water source, ahead of municipal and industrial use combined.
- Salinization: roughly 30% of Egypt’s agricultural land is affected by soil salinity, according to the UNCCD’s 2024 National Action Plan for Egypt — driven by irrigation without adequate drainage, a direct consequence of replacing natural flooding with managed irrigation after the Aswan High Dam.
- Irrigation dependency: over 90% of agricultural land relies on surface-water (Nile) irrigation rather than rainfall or groundwater, per the same FAO-sourced water-use data — leaving almost no buffer if Nile flow is disrupted.
Water, Salt, and Cities: The Three Pressures
1. Water Allocation and Nile Dependency
The fixed 55 billion m³/year allocation from the 1954 treaty is the ceiling Egyptian agriculture plans around, and with agriculture already consuming about 85% of that water, there is limited room to expand irrigated area without either improving efficiency or securing additional supply. Upstream infrastructure — most significantly Ethiopia’s Grand Ethiopian Renaissance Dam — adds uncertainty to flow timing during the reservoir’s fill-and-operate phases, though the treaty allocation itself has not changed.
- Because over 90% of farmland is Nile-irrigated, any reduction in delivered water translates almost directly into reduced cultivated area or reduced yield per hectare — there is very little rainfed farmland to fall back on.
- Efficiency gains in delivery and field-level application are the primary lever available to Egyptian agriculture, since the water source itself is fixed by treaty.

2. Salinization and Soil Fertility Loss
Salinization is the clearest documented soil threat to Egypt’s arable base. The UNCCD’s Egypt National Action Plan (2024) puts the affected share of agricultural land at approximately 30% — a figure driven by decades of irrigation without matching drainage capacity, which lets salts accumulate in the root zone instead of being flushed out the way an annual Nile flood once did. This is a direct downstream consequence of the same Aswan High Dam shift described above: the dam solved flood risk and enabled year-round irrigation, but it also removed the natural desalinizing mechanism the flood cycle provided.
- Cause: irrigation with insufficient subsurface drainage, plus reuse of lower-quality drainage water in some areas, concentrates salts in the topsoil over successive growing seasons.
- Consequence: reduced yields on affected plots, and in the most severe cases, land abandonment — reducing the effective arable base even where the land is nominally still counted as agricultural.
The 30% figure is from the UNCCD’s most recent National Action Plan cycle; these plans are revised roughly every five to seven years, and the next Egypt revision is expected around 2029–2030. Between revisions, the Ministry of Agriculture’s own soil surveys are the more frequently updated source, though they are not in this brief’s citation set.

3. Urban and Industrial Expansion
Cairo’s metropolitan footprint and new industrial corridors continue to compete directly with farmland for the same narrow band of flat, accessible land near the Nile — there is no equivalent of building on marginal desert scrubland the way sprawl works in a country with more available land. An exact current annual conversion rate for arable-to-urban land is not published in this brief’s source set; the FAO/World Bank arable-land time series (the same one referenced above) is the way to measure this over time, since a shrinking arable-land percentage against a stable total country area is itself evidence of urban conversion.

Greenhouse Yields and Research Institutes
Two specific, well-defined questions come up alongside the arable-land search: greenhouse cucumber yields, and the research institutions behind Egypt’s agricultural biotechnology. Both deserve a direct, honest answer rather than a folded-in guess.
On greenhouse cucumber yield: this brief’s source set does not include a specific FAO cucumber-greenhouse-yield figure for Egypt. FAOSTAT (FAO’s statistical database) publishes crop-specific yield data, including protected/greenhouse cultivation where national statistics offices report it separately from open-field production — that is the correct place to pull a current, sourced figure rather than estimating one here.
On research institutions: the Agricultural Genetic Engineering Research Institute (AGERI) operates under Egypt’s Agricultural Research Center (ARC), itself part of the Ministry of Agriculture and Land Reclamation. AGERI’s work covers plant biotechnology and genetic improvement relevant to salt-tolerant and drought-tolerant crop varieties — directly relevant to the salinization challenge described above, since salt-tolerant cultivars are one of the few interventions that work on land already affected rather than requiring it to be reclaimed. This brief does not include a verified current URL for AGERI or ARC’s official site; readers should search the Ministry of Agriculture and Land Reclamation’s site directly for the current AGERI/ARC institutional pages, since institutional URLs change more often than the underlying mandate.
Separately, “Egypt grand challenges” as a search typically refers to Egypt’s participation in international grand-challenge programmes (agricultural innovation prize and grant programmes run by global development funders) rather than a single named domestic initiative — this brief’s source set does not include specifics on a current programme by that name, so treat any claim about it with the same caution: check the funder’s own published call documents for the current cycle rather than a secondhand summary.
Ancient Egypt’s Fertile Land
It’s worth separating this from the modern statistics above, because the mechanism was genuinely different. Ancient Egyptian agriculture depended on the Nile’s annual flood, which deposited a fresh layer of silt across the floodplain every year — a natural fertilization and desalinization cycle that predates any of the modern infrastructure discussed here by thousands of years. That flood-driven fertility is what the Aswan High Dam replaced with managed irrigation in the 20th century, trading flood risk and unpredictability for water security, but losing the free annual soil renewal in the process — which is a meaningful part of why salinization is a modern engineering challenge rather than an ancient one. Beyond that mechanical link, this brief’s source set is focused on current agricultural and land-use data rather than archaeological or historical land-extent records, so a dedicated historical treatment of ancient floodplain fertility belongs on a different page than this one.
Reclamation and the Path to More Farmland
Land Reclamation Projects and Desert Agriculture
Given the ceiling on Nile-fed land, Egypt’s main lever for expanding the arable base is desert reclamation — bringing new land under irrigation using non-traditional water sources (deep groundwater, treated wastewater for non-food crops, or delta expansion). Toshka and New Valley are the long-running named projects in this space. Their outcomes are contested and slower than original targets in most independent assessments, but reclamation remains the only mechanism that grows the denominator rather than just protecting what already exists.
- New desert land requires building irrigation and drainage infrastructure from scratch — there is no legacy Nile-flood soil fertility to draw on, so amendments and careful salinity management are needed from year one.
- Reclamation reduces pressure on the core Nile allocation only where it draws on genuinely separate water sources (deep aquifers, treated water) rather than diverting the same 55 billion m³/year across a larger area.

Desert Farming Techniques
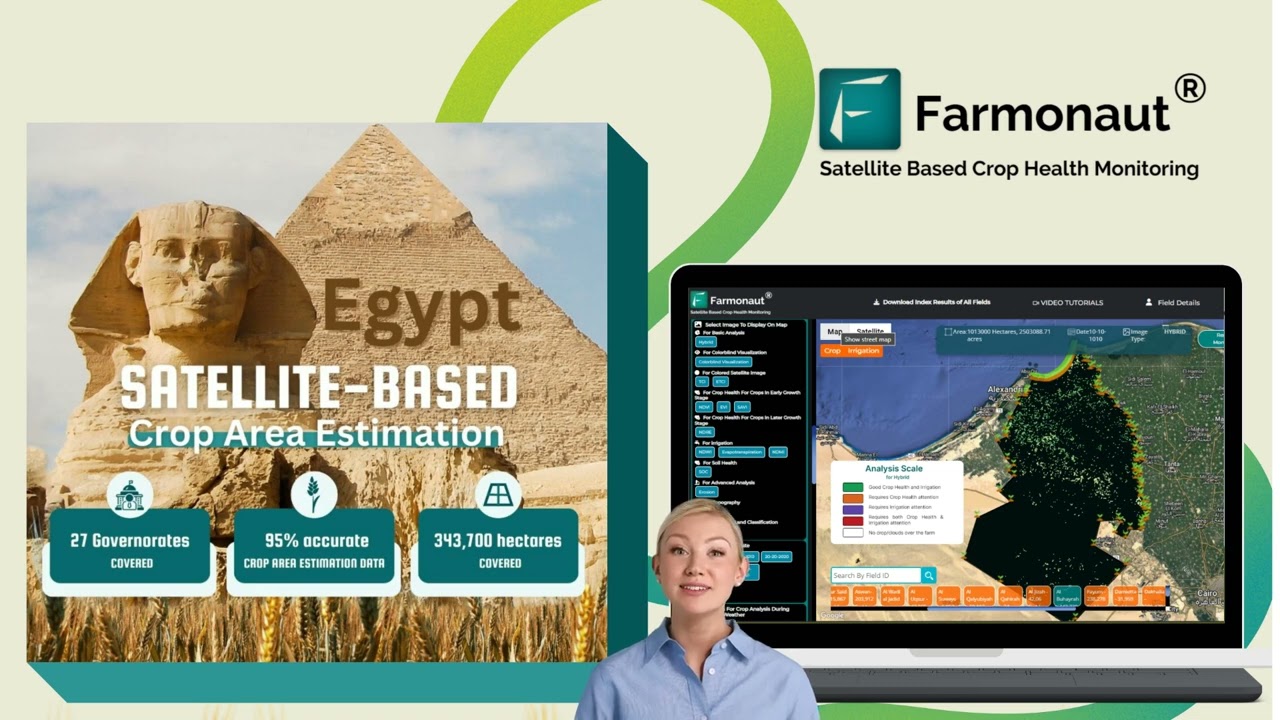
Innovative desert farming approaches — crop selection suited to arid conditions, soil amendment for reclaimed land, and precision irrigation scheduling — are what determine whether reclaimed hectares become durably productive or repeat the salinization problem within a decade. For agribusinesses monitoring reclamation projects at scale, Farmonaut’s Large Scale Farm Management solution provides satellite-driven visibility across multiple fields or large reclaimed tracts, which matters most in exactly this context — new land with no farming history and no baseline soil data.
Water-Use Efficiency: The Lever That Doesn’t Require a New Treaty
Since the 55 billion m³/year Nile allocation is fixed by treaty and agriculture already takes roughly 85% of it, the highest-leverage near-term intervention is efficiency — getting more crop per cubic meter rather than seeking more cubic meters.
- Drip and Sprinkler Irrigation: deliver water directly to the root zone instead of flood irrigation, reducing both water loss and the standing water that drives salt accumulation.
- Drainage Water Reuse: permitted and regulated for non-food crops, extending the effective water supply without new allocation.
- Crop-Water Planning: matching crop selection and planting windows to water availability rather than to maximum theoretical yield.
- Satellite-based soil moisture and crop health monitoring — reduces overwatering, which is both a water-efficiency issue and a salinization driver, since excess water without drainage is exactly what concentrates salts.
Explore more on environmental tracking with Farmonaut’s Carbon Footprinting solutions for sustainable agriculture.

Soil Management: Salinity Reduction and Fertility
- Improved Drainage: the direct countermeasure to the 30% salinity-affected figure cited above — subsurface drainage lets salts flush rather than accumulate.
- Salt-Tolerant Crop Varieties: the applied output of AGERI/ARC-style genetic research described earlier, letting already-affected land stay in production.
- Soil Amendments: organic matter and gypsum-based treatments to rebuild fertility in degraded or newly reclaimed plots.
- Precision Agriculture: satellite and AI-based tools targeting fertilizer and water to what the crop and soil actually need, cutting input waste on land where every cubic meter of water is already constrained.
Real-time advisory on soil and crop management can be automated with JEEVN AI on Farmonaut, delivering insights direct from satellite data. See also Farmonaut Fleet Management for agricultural logistics and resource optimization, relevant to deploying limited equipment and labor efficiently across scattered reclaimed plots.

Agro-Industrial Integration
- Storage, Transport, and Processing: reduces post-harvest losses, which matter more, not less, when the arable base producing the crop is already constrained.
- Integrated Supply Chains: matches investment in scarce land and water to returns further down the value chain.
- Digital Traceability: Farmonaut’s Product Traceability tracks food quality and authenticity from farm to table.

Challenges vs. Solutions Overview
| Challenge | Published Figure | Source & Date | Primary Mitigation |
|---|---|---|---|
| Water Allocation (Nile Dependency) | 55 billion m³/year fixed allocation; agriculture uses ~85% of it | FAO Egypt Country Profile (1954 treaty basis); Fanack/FAO water-use data | Drip/sprinkler irrigation, drainage water reuse, satellite-based scheduling — Farmonaut Satellite API |
| Soil Salinization | ~30% of agricultural land affected | UNCCD Egypt National Action Plan, 2024 | Subsurface drainage, salt-tolerant cultivars, soil amendments |
| Irrigation Concentration | 90%+ of ag land on Nile surface irrigation | FAO-sourced (Fanack Water) | Diversify to deep groundwater/treated water for reclaimed land |
| Urban/Industrial Expansion | Not published in current source set — track via annual FAO/World Bank arable-land % series | World Bank “Arable land (% of land area)” indicator, updated annually | Land-use zoning, reclamation to offset losses |
| Cereal Productivity per Hectare | Wheat 6.61 t/ha; Rice 9.79 t/ha | FAO Country Profile: Egypt | Sustains output despite small arable base; further gains via precision inputs |
What Would Change These Numbers
This is not a story with a fixed endpoint — it moves with a small number of identifiable levers, and tracking those is more useful than any single year’s snapshot:
- The 1954 Nile allocation (55 billion m³/year): unchanged for over 70 years; any renegotiation or GERD-related operational agreement affecting delivered flow would be the single biggest driver of a change in cultivable area.
- The UNCCD National Action Plan cycle: next Egypt revision expected around 2029–2030; that document is the place to check whether the 30% salinity figure has moved.
- Reclamation project delivery: Toshka and New Valley outputs, tracked against original targets, determine whether the denominator (total arable hectares) grows or stays flat.
- Groundwater extraction in the Western Desert and Nile Delta subsurface: current extraction rates and depletion timelines are not in this brief’s source set — this is a genuine open question, and readers needing it for planning purposes should consult Egypt’s Ministry of Water Resources and Irrigation directly, since aquifer drawdown data is not typically published in the same country-profile documents as surface-water figures.
To verify any figure in this article against the current published number: pull the World Bank/FAO “Arable land (% of land area) — Egypt” series for the up-to-date percentage, check the UNCCD’s National Action Plan portal for the current salinity assessment, and check FAOSTAT directly for updated cereal yield and self-sufficiency figures. All three update on different cycles — annual, five-to-seven-year, and annual respectively — so a discrepancy between this article and a fresher figure usually just means one of those cycles has turned over since September 2026.
Tracking Egyptian Farmland with Satellite Data
Farmonaut applies satellite imagery, AI-driven analytics, and blockchain-based traceability to exactly the constraints described above:
- Real-time detection of water stress, crop stress, and soil health trends on Nile-irrigated and reclaimed land alike.
- Resource mapping for desert reclamation projects, where there is no historical soil baseline to work from.
- Fleet and equipment management for operations spanning scattered or newly reclaimed plots.
- Environmental impact tracking, including carbon footprint analysis.
- Blockchain-based crop traceability for supply chain transparency.
- Web and App Platforms: access the Farmonaut app on web, Android, and iOS for satellite-based farm and land insights anywhere in Egypt.
- Open API: integrate satellite and advisory data directly via the Farmonaut API, documented at Farmonaut API Developer Docs.
Farmonaut also supports crop loan and insurance verification using satellite-based evidence, reducing risk for lenders and accelerating rural investment on both traditional Nile-fed and newly reclaimed land.
Water-Savings Calculator: Drip vs. Flood Irrigation
Given that agriculture already draws roughly 85% of Egypt’s fixed 55 billion m³/year Nile allocation, the efficiency question is concrete: how much water does switching irrigation methods actually save on a given plot? Enter your field size and current method below.
Enter values above to see estimated savings.
Assumptions: figures are illustrative estimates based on typical drip-vs-flood efficiency differentials, not a site-specific engineering study. It excludes installation cost, crop type, soil texture, and local drainage conditions — consult a local irrigation engineer or the Ministry of Water Resources and Irrigation before committing capital.
FAQ
- What percentage of Egypt's land is arable?
Roughly 3–4% by the World Bank/FAO "Arable land (% of land area)" indicator, because cultivation is confined to the Nile Valley and Delta while the rest of the country is desert. Check the World Bank's current series for the exact latest figure, since it updates annually.
- Why is Egypt's arable land percentage so much lower than other large countries'?
Egypt has almost no rainfed agriculture — over 90% of farmland relies on Nile surface irrigation (FAO/Fanack data), unlike countries with distributed rainfall across a larger land base.
- How much water does Egypt get from the Nile each year?
55 billion cubic meters annually, per the 1954 treaty allocation cited in FAO's Egypt country profile — a fixed figure that hasn't scaled with population growth.
- How much of Egypt's farmland is affected by soil salinity?
About 30%, according to the UNCCD's 2024 National Action Plan for Egypt, driven mainly by irrigation without sufficient drainage.
- What is AGERI and how does it relate to Egyptian farmland?
The Agricultural Genetic Engineering Research Institute, under Egypt's Agricultural Research Center, works on crop biotechnology including salt- and drought-tolerant varieties — directly relevant to land affected by the salinization described above.
- Does ancient Egypt's fertile land explain today's figures?
Partly as mechanism, not as data: the ancient Nile flood cycle naturally fertilized and desalinized the floodplain every year. The Aswan High Dam replaced that cycle with managed irrigation, trading flood risk for water security but losing the free soil renewal — a direct link to why modern salinization is an engineering challenge.
- Where can I check the current arable land figure myself?
The World Bank/FAO "Arable land (% of land area)" series for Egypt, updated annually, is the primary source. The UNCCD National Action Plan (next Egypt revision expected ~2029–2030) covers degradation and salinity trends.
- How can satellite technology help track Egypt's farmland?
Satellite data enables real-time monitoring of water stress, soil health, and crop condition — useful on both established Nile-fed land and newly reclaimed desert plots with no historical baseline. See the Farmonaut platform or the Farmonaut API for large-scale integration.
Conclusion
Egypt's arable land is small by any measure — a few percent of total land area — and the reasons are specific and documented: a fixed 1954 water allocation of 55 billion m³/year, a post-Aswan irrigation system that traded flood-driven soil renewal for engineered water control, and salinization now affecting close to a third of agricultural land per the UNCCD's 2024 assessment. None of these are static facts; each has a publication cycle, and each has a lever (drainage investment, irrigation efficiency, reclamation delivery, or renegotiated water-sharing arrangements) that could move it.
The most useful thing a reader can take from this page a year from now is not any single figure above, but the three places those figures come from and how often each one turns over — the World Bank/FAO arable-land series annually, the UNCCD National Action Plan on a multi-year cycle, and FAOSTAT for yield and self-sufficiency data. Checking those directly will always beat trusting a snapshot, including this one.
Discussion
Questions, corrections or field experience? Share them below. First-time comments are reviewed before they appear, and your email is never published.
No comments yet. Be the first to add a question or your experience.

 FarmSetu
 Progenseed
 SkyHarvest
 Polaris Digitech
 Teledarbas
 Wild Oak Farm
 SFX
SFX BACF Africa
 Doodlakine
 Exurbia Geospatial
 FieldZero
 Indico Company
 Kubota
 FFBS
FFBS
 Licence holder · Niger · Gold










