

Reviewed August 2026 against USDA Agricultural Marketing Service and USDA Farm Service Agency data.
Try it: Run your own numbers →
US anhydrous ammonia averaged $915.50 per ton and DAP averaged $912.22 per ton at the Gulf as of August 7, 2026, according to USDA’s Agricultural Marketing Service weekly fertilizer report. Those two figures, plus a Q1 2026 potash average of $475 per ton, are the clearest read available right now on where agricultural chemicals costs stand for US row-crop operations. This article breaks down current US fertilizer pricing, the federal subsidy programs that offset input costs, packaging trends shaping the global agricultural chemicals supply chain, and how Egypt’s fast-growing agrochemicals sector fits into the picture for buyers and exporters watching that market.
Table of Contents
- Current US Fertilizer Prices
- American Agricultural Subsidies and Input Costs
- Global Agricultural Packaging Market
- The Agricultural Industry: Inputs, Chemicals, and Technology
- Egypt Agrochemicals Market
- Fertilizer Cost Calculator
- FAQ
- Try it: Run your own numbers
Current US Fertilizer Prices: Nitrogen, Phosphate, and Potash
USDA’s Agricultural Marketing Service (AMS) publishes a Farm Production Cost Report roughly bi-weekly, compiling retailer-quoted prices for the major nitrogen, phosphate, and potash products used across US crop regions. As of the August 7, 2026 report, three benchmark prices stood out:
| Fertilizer | Price | Market / Region | Date |
|---|---|---|---|
| Anhydrous ammonia (nitrogen) | $915.50/ton | Illinois | Aug 7, 2026 |
| Diammonium phosphate (DAP) | $912.22/ton | Gulf | Aug 7, 2026 |
| Potash | $475/ton average | US average | Q1 2026 |
For context on volatility, Gulf DAP prices ranged from $583 to $800 per ton between January and August 2025, per the same USDA AMS series — meaning the August 2026 DAP figure of $912.22/ton sits well above that entire 2025 range. That’s a meaningful year-over-year move for any operation budgeting nitrogen-phosphorus-potassium (NPK) programs for the next planting cycle.
University of Illinois’s farmdoc daily has tracked this same AMS data series and published analysis on fertilizer and fuel cost trends heading into fall — a useful second read if you want an academic interpretation layered on top of the raw USDA numbers, rather than relying on the raw report alone.
Because AMS reissues this report on a rolling schedule, any number above will be stale within weeks. To get the current figure for your own planning: visit USDA AMS Farm Production Cost Report directly — it’s reissued with fresh retailer quotes for nitrogen, phosphate, and potash across US crop regions on essentially the same bi-weekly cadence it followed in August 2026.
Farmers optimizing when and how much of these increasingly expensive inputs to apply are turning to satellite-based crop monitoring to avoid over-application. Farmonaut’s platform doesn’t manufacture or sell fertilizer, but its soil health monitoring tools help growers time nutrient applications against actual crop and soil conditions rather than a fixed calendar — which matters more, not less, when the inputs themselves cost this much.

American Agricultural Subsidies and Input Costs
USDA’s Farm Service Agency (FSA) began issuing $2.14 billion in payments under one 2024 support program in October 2024, part of a broader $9.3 billion in commodity crop subsidy payments the agency distributed to producers that year. Those figures come directly from USDA FSA’s own release on the payment rollout, not a third-party estimate.
Subsidy totals are an annual figure, and FSA typically publishes the full-year number within six to twelve months of year-end — so a reader checking this in 2027 or later should expect a newer total than the $9.3 billion figure logged for 2024. The way to get the current number is straightforward: go to USDA FSA’s news release archive and look for the most recent commodity program payment announcement, which FSA issues on the same rolling basis it used for the 2024 figure.
Why this matters for the “agricultural chemicals” search intent specifically: subsidy payments and input costs move in tandem in most operators’ budgets. When anhydrous ammonia runs $915.50/ton and DAP runs $912.22/ton, as both did in early August 2026, federal payment programs are one of the few levers producers have to offset that cost before the next planting decision. USDA does not currently publish a breakout tying subsidy dollars directly to fertilizer cost offsets — that link has to be made at the farm level, using your own input invoices against your own FSA payment history.
Modernizing how those inputs are applied is one of the more direct ways to protect margin against both price swings and subsidy uncertainty. Farmonaut’s approach to this — precision agriculture technology adoption — is built around reducing the volume of chemical inputs needed per acre rather than assuming the input price is fixed.
Global Agricultural Packaging Market
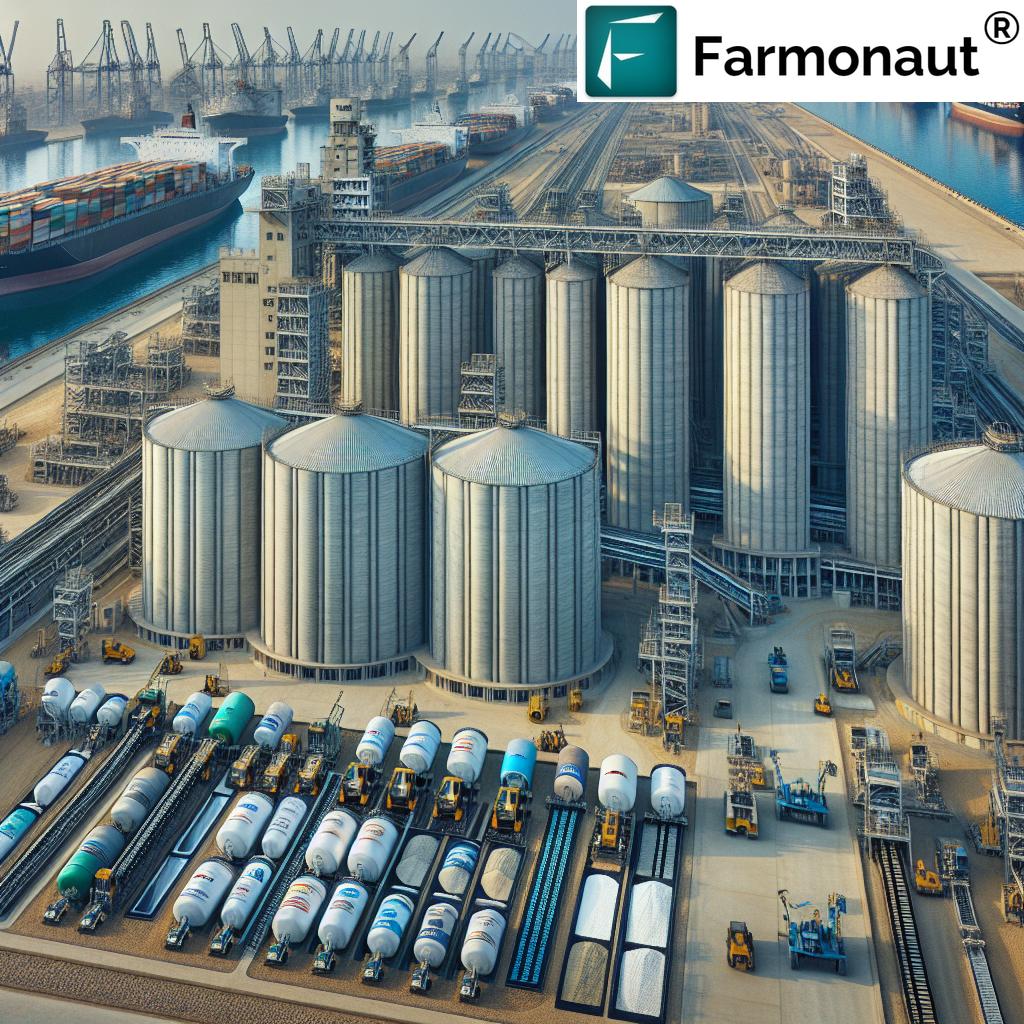
The agricultural chemicals sector doesn’t move in isolation from its packaging supply chain — bulk bags, IBC totes, drums, and specialty containers built to handle corrosive nitrogen and phosphate products are a real cost line for both manufacturers and distributors. The specific dollar-value size of the global agricultural packaging market is not confirmed in the sources reviewed for this article, and rather than estimate it, the honest answer is: that figure needs to come from a dedicated market-research report (IBISWorld, Mordor Intelligence, or similar), not from USDA’s cost-of-production series, which doesn’t track packaging spend separately from input pricing.
What the USDA data does confirm indirectly is demand pressure on that packaging chain: Egypt’s fertilizer consumption is projected to rise by 1.6 million tons over its forecast period, according to Research and Markets — and every additional ton of fertilizer produced or imported needs a bag, tote, or bulk container to move it from plant to farm. That’s the packaging-market growth driver analysts point to, even where the aggregate market-size number itself sits outside verified government data.
If you need a current packaging-market dollar figure for a specific purpose (investment memo, sourcing decision, market entry), the research method is: pull the latest edition directly from the publisher rather than relying on a number that may already be a year or more old by the time you read it. Research and Markets updates its agrochemicals and packaging forecasts on an annual cycle, so checking their catalog directly gets you the current edition rather than a stale citation.
The Agricultural Industry: Inputs, Chemicals, and Technology Adoption
Zooming out from fertilizer pricing specifically, the broader agricultural industry is where input costs, subsidy policy, and on-farm technology intersect. Three trends define that intersection right now:
- Rising input costs against flat or declining commodity prices — the DAP move from a $583–$800/ton range in 2025 to $912.22/ton in August 2026 is the clearest example, and it compresses margin regardless of subsidy support.
- Bio-inputs and blended products gaining planting-season share — growers are increasingly mixing conventional NPK with biological amendments to manage cost and soil health simultaneously. Farmonaut’s coverage of agriculture inputs and bio-inputs planting trends tracks this shift in more depth.
- Domestic production data gaps — USDA does not currently publish a consolidated figure for total US fertilizer production volume by nutrient type. If you need that number for a supply-side analysis, the closest available proxies are trade data from the US Census Bureau’s foreign trade statistics (imports/exports by HS code) cross-referenced against USDA’s consumption estimates, since a direct production-volume series isn’t published. Farmonaut’s own look at whether the US produces its own fertilizer walks through what is and isn’t publicly trackable on that front.
Herbicide, insecticide, and fungicide pricing — the other major slice of “agricultural chemicals” spend beyond fertilizer — is not covered by the USDA AMS fertilizer report cited above, and no comparable government pricing series for those chemical categories was located for this article. That’s a genuine gap: if crop-protection chemical pricing is what you need, USDA’s National Agricultural Statistics Service (NASS) publishes some cost-of-production surveys that include chemical expenditure per acre, but not a retail price index comparable to the AMS fertilizer series.

Where technology fits into managing all of this: satellite crop monitoring and AI-driven advisories reduce how much of these increasingly expensive chemicals a grower needs to apply per acre, by targeting application to actual plant stress and soil condition rather than blanket coverage. That’s the specific value Farmonaut’s platform adds — not producing or selling chemicals, but reducing the volume needed through better timing and targeting.
Egypt Agrochemicals Market
Egypt’s fertilizer and specialized agricultural chemicals sector remains one of the more closely watched growth stories in the global agrochemicals space, and it’s directly relevant to US buyers and exporters tracking global supply. Research and Markets projects Egypt’s fertilizer consumption will rise by 1.6 million tons over its forecast period — a demand signal that matters for anyone assessing global nitrogen and phosphate supply-demand balance, including US producers weighing export opportunities.
Egyptian specialized fertilizer producers have reported strong recent financial performance, with net profit and sales growth in the double digits at the sector’s leading firms in the most recent reporting period. Egypt’s strategic position — bridging African, Middle Eastern, and European agricultural markets — has supported growing agrochemical exports into all three regions. For US-based buyers or trade analysts, the practical takeaway is that Egyptian supply is scaling at a pace (1.6 million additional tons of consumption alone, before export volume) that keeps it relevant to global price benchmarks tracked by USDA AMS and similar agencies elsewhere.
This growth curve is a continuing story rather than a single-year event: Egypt’s consumption trajectory, once the 1.6-million-ton increase materializes, becomes a new baseline that the next forecast cycle will build from. Research and Markets refreshes its agrochemicals coverage annually, so the way to track whether that trajectory is holding, accelerating, or slowing is to pull their current catalog entry rather than rely on any single year’s projection indefinitely.

Fertilizer Cost Calculator
Use the figures above to estimate your own per-acre nitrogen and phosphate cost at current USDA AMS benchmark pricing, then adjust the price fields as new reports are issued.
Run your own numbers
Assumes anhydrous ammonia is 82% nitrogen by weight (so pounds of product = pounds of N ÷ 0.82) and treats DAP rate as pounds of finished product applied per acre. Excludes application labor, equipment, freight, and any potash or micronutrient costs. Prices default to the USDA AMS figures cited in this article (Aug 7, 2026 for ammonia and DAP) — replace them with the current report’s numbers for an accurate estimate.
Once inputs are priced out, the next lever is reducing applied volume without losing yield. Farmonaut's soil health monitoring approach uses satellite data to flag zones within a field that need less — or more — nutrient than a flat-rate plan assumes, which is where the calculator above stops and field-level precision agriculture starts.
FAQ
- Q: What is the current price of anhydrous ammonia in the US?
A: USDA AMS reported $915.50 per ton in Illinois as of August 7, 2026. This report is reissued roughly bi-weekly at ams.usda.gov/mnreports/ams_3657.pdf, so check that source directly for the current figure. - Q: How much did DAP fertilizer cost in 2025 versus 2026?
A: Gulf DAP ranged from $583 to $800 per ton across January–August 2025, then reached $912.22 per ton by August 7, 2026 — both figures from USDA AMS. - Q: How much does the US government pay in agricultural subsidies?
A: USDA FSA distributed $9.3 billion in commodity crop subsidy payments in 2024, including a $2.14 billion tranche that began issuing in October 2024. Full-year totals are typically published 6–12 months after year-end at USDA FSA's news release page. - Q: How big is the global agricultural packaging market?
A: No verified dollar figure was found in government sources for this article. Egypt's fertilizer consumption alone is projected to rise 1.6 million tons over its forecast period per Research and Markets, which is one demand driver for packaging volume, but a market-size number should be pulled from a dedicated packaging market report rather than assumed. - Q: Why is Egypt's agrochemicals market growing?
A: Egypt's strategic position serving African, Middle Eastern, and European buyers, combined with a projected 1.6-million-ton rise in domestic fertilizer consumption (Research and Markets), are the two most-cited growth drivers. - Q: Does the US produce its own fertilizer?
A: USDA does not publish a consolidated current production-volume figure by nutrient type. See Farmonaut's dedicated breakdown on US fertilizer production for what is and isn't publicly trackable.
Earn With Farmonaut: Affiliate Program
Earn 20% recurring commission with Farmonaut's affiliate program by sharing your promo code and helping farmers save 10%. Onboard 10 Elite farmers monthly to earn a minimum of $148,000 annually—start now and grow your income!
Farmonaut Subscriptions
For more information on Farmonaut's services and how they complement precision management of agricultural chemicals, visit:




 Tucor
Tucor Saraswati Agro
 Geno
Geno Hayleys Agriculture
 Linx Agritech
 Adinet
 Save Your Soils
 Grandstream Algérie
 XOS Realty
 Geospatial Lab Africa
 Agro La Gándara
 HIPSAC
 ZOL Zimbabwe
 Juligerm
 MISE Maroc
 NWNS
NWNS
