

Reviewed September 2026 against Global Forest Watch, the UK Forestry Commission’s Forestry Statistics 2024, and the FAO Global Forest Resources Assessment 2025.
Try it: Run your own numbers →
Table of Contents
- The Short Answer: What Actually Works
- How Big Is the Problem — Nigeria, the UK, and Global Figures
- Technological Solutions to Deforestation, Explained
- Non-Technology Solutions That Pair With It
- Comparative Table: 7 Solutions Ranked
- Calculator: Estimate Your Reforestation Carbon Offset
- Nigeria in Focus: Dry Season, Mining, and Detection
- UK and US Context
- Farmonaut’s Data-Driven Approach
- FAQ
- Summary & Resources



Technological Solutions to Deforestation: 7 That Work
The technological solutions to deforestation that actually change outcomes fall into three groups: satellite-based detection systems that flag forest loss within days rather than years, supply-chain traceability tools that make illegal timber and forest-risk commodities harder to sell, and precision agroforestry platforms that let farmers keep yields up without clearing more land. None of these works alone — detection without enforcement just produces alerts nobody acts on, and certification without monitoring is easy to fake. Below is what each solution does, what it costs to run, what it actually reduces, and where the evidence runs out and you have to check current figures yourself.
The single most-cited technical breakthrough in this space is detection accuracy, not detection speed. A 2024 systematic review in Frontiers in Forests and Global Change found U-Net deep learning models reached 99.91% accuracy identifying deforestation from satellite imagery — but accuracy only matters if the alert reaches someone with authority to act on it within the same growing season.
How Big Is the Problem — Nigeria, the UK, and Global Figures
Global Forest Watch’s Nigeria dashboard recorded 240,000 hectares of natural forest loss in Nigeria in 2025, tracked via satellite-based monitoring updated on a rolling basis (Global Forest Watch, Nigeria country dashboard). That is down from the FAO Forest Resources Assessment’s historical rate of 410,100 hectares per year for 2005–2010, also cited on the same GFW dashboard — a meaningful decline in the annual clearing rate, though the two figures come from different measurement periods and methods, so treat the comparison as directional rather than a precise before-and-after.
Zooming out, the FAO’s Global Forest Resources Assessment 2025 puts cumulative global forest area lost since 1990 at 489 million hectares, against a global reforestation rate of 6.78 million hectares per year over 2015–2025 (FAO Global Forest Resources Assessment 2025). FAO also estimates roughly 900 million hectares of forest and degraded land worldwide are currently suitable for restoration — the addressable market, in effect, for every solution covered below.
For context on the other side of the Atlantic: the US Forest Service reports an average of 190,000 acres reforested per year over its most recent five fiscal years (USDA Climate Hubs, Patterns of Reforestation Success and Failure) — useful as a benchmark for what a mature national reforestation programme processes annually, and a figure worth rechecking each year since USDA Forest Service publishes an updated State of Forests report annually.

Technological Solutions to Deforestation, Explained
These are the technology-first answers to “what are the solutions for deforestation” — the tools, not the policies. Each entry names what it detects or does, how accurate or effective it is where a figure exists, and what it costs to adopt where that is knowable.
1. Satellite-Based Forest Loss Detection
This is the foundation everything else sits on. Platforms like Global Forest Watch ingest satellite imagery and flag canopy loss, sometimes within days of clearing. The technical benchmark: a systematic review of deep-learning deforestation-detection models published in Frontiers in Forests and Global Change found U-Net architectures — a convolutional neural network design originally built for image segmentation — reaching 99.91% detection accuracy against satellite imagery test sets (Frontiers in Forests and Global Change, 2024). That is the ceiling for what deforestation satellite imagery can currently do in controlled test conditions; real-world field accuracy depends on cloud cover, image resolution, and how fast the alert pipeline actually delivers a flag to someone with the authority to intervene. Farmonaut’s own satellite monitoring layer works on this same principle, feeding real-time vegetation health and cover data through the API & Developer integrations and the Satellite Weather API developer docs.
2. Blockchain and Digital Traceability for Timber and Forest-Risk Commodities
Traceability systems record a product’s chain of custody — from harvest or field to export — on a tamper-resistant ledger, so a buyer or regulator can verify a shipment did not originate on illegally cleared land. This matters most where certification alone is easy to forge on paper but hard to fake against a logged GPS trail. Farmonaut’s Traceability system and product traceability suite apply this to timber, palm oil, and other forest-adjacent supply chains.
3. AI-Driven Tree Counting and Canopy Mapping
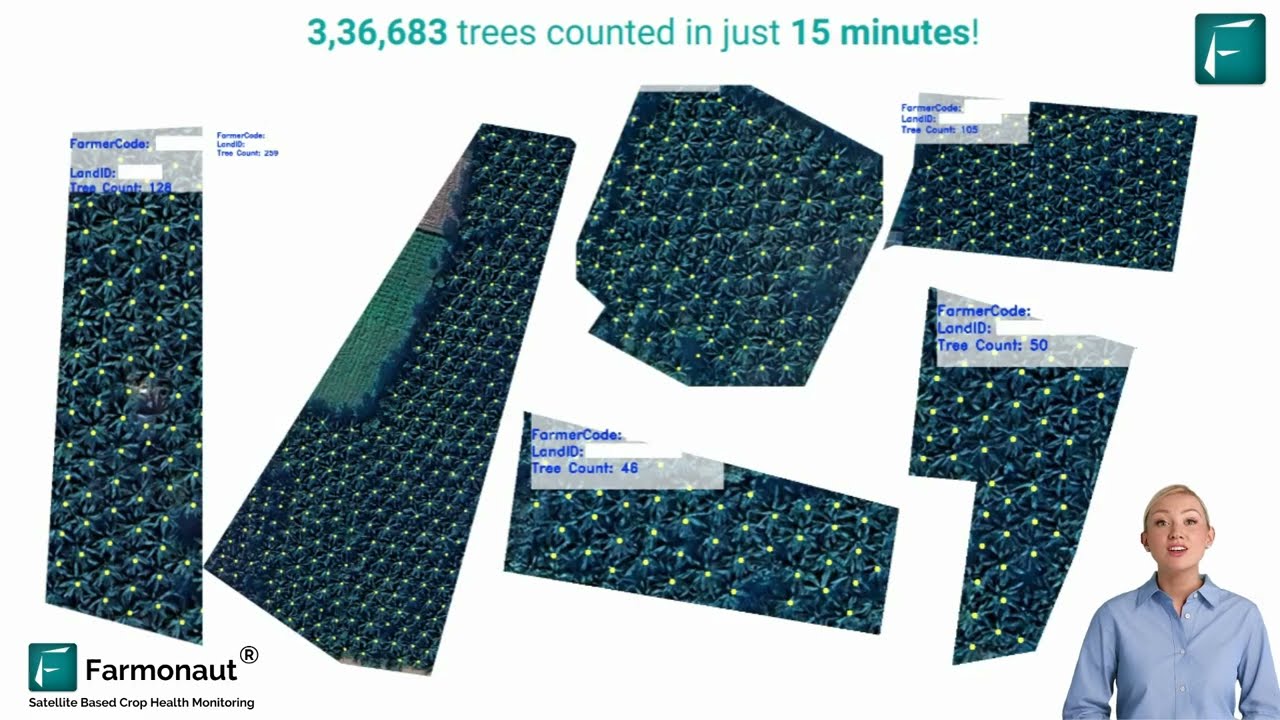
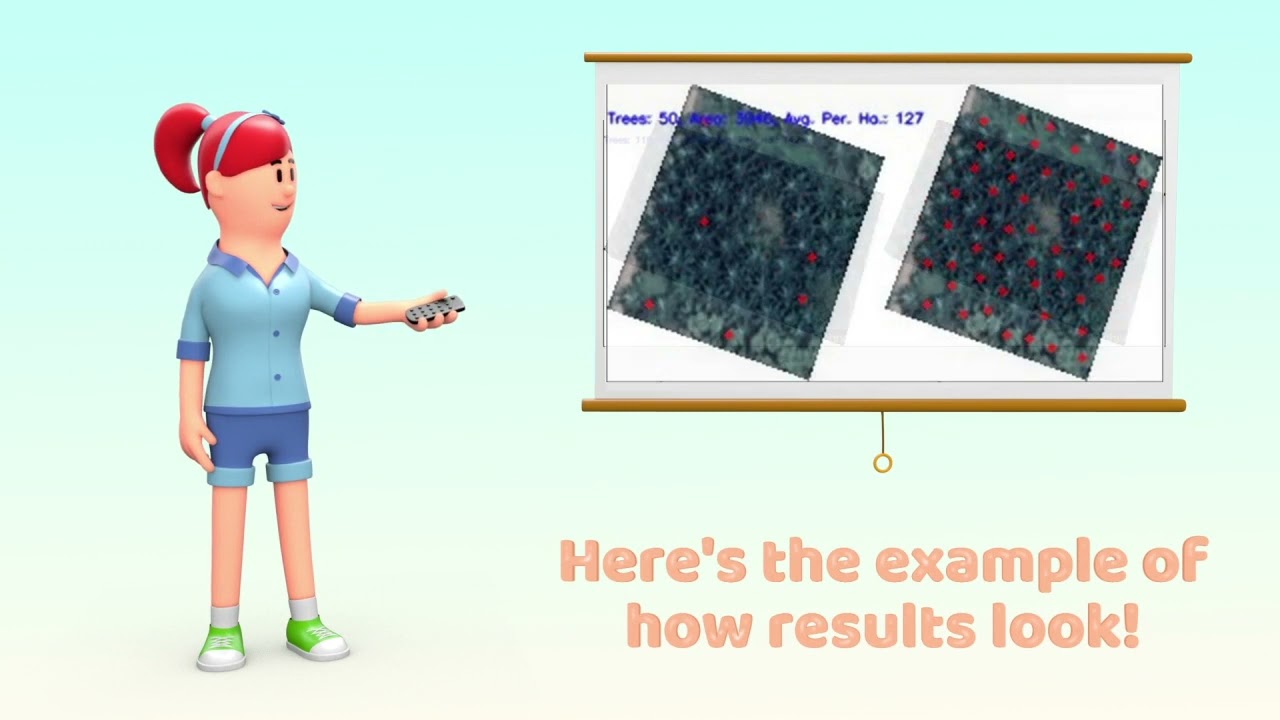
Beyond flagging clearance after the fact, automated tree-detection models count individual trees and map canopy density from satellite or drone imagery, giving land managers a baseline they can re-survey on a fixed schedule instead of estimating cover by eye. This is the same U-Net-class technology behind the 99.91% detection figure above, applied to counting rather than change-detection.
4. Carbon Footprint and Sequestration Tracking Platforms
Reforestation and agroforestry projects need to prove carbon is actually being sequestered, not just that trees were planted. Digital carbon-tracking platforms model sequestration from vegetation index data over time, which matters for anyone selling carbon credits or reporting under a compliance scheme. Farmonaut’s Carbon Footprinting platform does this by tracking NDVI and biomass proxies across a monitored area.
5. Precision Agroforestry and Remote-Sensing Farm Management
Agroforestry — integrating trees with crops or livestock — reduces the pressure to clear new land by keeping existing farmland productive. Technology’s role is measurement: soil moisture sensing, NDVI-based crop health tracking, and yield forecasting let a farm manager see whether an agroforestry plot is actually outperforming a cleared monocrop, rather than assuming it. Farmonaut’s large-scale farm management tools are built for this kind of multi-plot oversight.
6. Fleet and Resource Management to Cut Operational Land Impact
Less obviously “anti-deforestation” but measurable: efficient routing and scheduling of vehicles and equipment in forestry, mining, and agricultural operations reduces the total ground area disturbed by access roads and staging sites. Farmonaut’s Fleet Management product applies this logic to mining and agricultural operations working near forest margins.
7. Financial-Sector Tools: Satellite-Verified Crop Loans and Insurance
A less direct but real lever: lenders and insurers increasingly require satellite-verified land-use data before issuing credit, which removes the incentive to clear forest simply to prove “productive use” of land to a bank. Farmonaut’s crop loan and insurance verification tools are an example of this approach in practice.

Non-Technology Solutions That Pair With It
Anyone searching “what are the solutions to deforestation” is usually asking a broader question than just the tech stack. Technology detects and verifies; these three levers are what turn a detection into a reduction:
- Land tenure and community forest rights: Where local communities hold recognised, enforceable rights to a forest, they have a direct stake in reporting illegal clearing — technology gives them the evidence to act on that stake.
- Certification schemes: Timber and forest-risk commodity certification (verifying legal harvest and sustainable management) creates a market incentive, but only holds up when paired with traceability tech that can audit the claim.
- Regulatory enforcement and strategic environmental assessment: Satellite alerts are only as good as the agency that receives and acts on them — enforcement capacity, not detection capacity, is usually the binding constraint.
- Try it: Run your own numbers
A detection system with no enforcement pathway behind it produces alerts that pile up unread. Before investing in satellite monitoring, confirm who receives the alert and what their mandate is to act on it within the same season the clearing happened.
Comparative Table: 7 Technological Solutions Ranked
This table ranks the seven solutions above by what they primarily deliver, so you can match a tool to the specific problem — detection, proof, or prevention:
| Solution | Primary Function | Evidence of Effectiveness | Best Suited To |
|---|---|---|---|
| Satellite forest-loss detection | Early detection of clearing | Up to 99.91% detection accuracy (U-Net models, Frontiers in Forests and Global Change, 2024) | Governments, NGOs, large landholders |
| Blockchain / digital traceability | Supply chain verification | Makes illegally-sourced timber harder to launder into legal supply chains | Timber exporters, buyers, regulators |
| AI tree counting / canopy mapping | Baseline measurement | Same detection-model class as above; used for counting, not just change | Forestry managers, restoration projects |
| Carbon tracking platforms | Sequestration verification | Supports carbon-credit and compliance reporting claims | Reforestation projects, carbon markets |
| Precision agroforestry / remote sensing | Reduce pressure to clear new land | Improves yield visibility on existing farmland | Smallholder and commercial farmers |
| Fleet / resource management | Reduce operational land disturbance | Fewer access roads and staging sites per operation | Mining, forestry, large-scale agriculture |
| Satellite-verified loans / insurance | Remove financial incentive to clear | Ties credit access to verified land-use data instead of self-reported clearing | Lenders, insurers, smallholder farmers |
Calculator: Estimate Your Reforestation Carbon Offset Timeline
Use FAO’s global reforestation pace as a reference point to see how a planting project of your own size compares — enter your planned area and an assumed annual growth rate to see roughly how many years of FAO’s global reforestation pace your project represents.
Run your own numbers
Nigeria in Focus: Dry Season, Mining, and Detection
Nigeria’s 240,000 hectares of natural forest loss recorded for 2025 by Global Forest Watch breaks down across the same drivers covered nationally for years: agricultural land expansion, unregulated logging, mining site clearance, and infrastructure that opens previously remote forest to further clearing (Global Forest Watch, Nigeria dashboard). The dashboard updates on a rolling basis, so check it directly each September–October for the latest confirmed annual figure rather than relying on a fixed number here.
On dry season conditions specifically: no quantified figures on Nigeria dry-season rainfall reduction or duration change were located from Defra, USGS, or Nigeria’s national meteorological service for this review. Readers researching Nigeria’s dry season in the context of deforestation should treat rainfall-pattern claims from unsourced articles with caution and check the Nigerian Meteorological Agency (NiMet) or FAO’s climate data portals directly for current seasonal figures rather than relying on secondary summaries.
Mining-driven clearance is a distinct sub-driver worth separating from farming and logging: site access roads, heavy equipment staging, and processing infrastructure clear forest directly, while altered water flows and soil compaction degrade adjacent land indirectly. Responsible mining operators increasingly build reforestation and site-closure commitments into planning from the start, verified against satellite-derived baseline and post-closure imagery rather than a paper commitment alone.

Treating a single year’s Global Forest Watch figure as a trend. Compare at least three consecutive years on the live dashboard before concluding the clearing rate is rising or falling — a single year can be skewed by one large concession or an unusually dry season.
UK and US Context
The UK sits at the opposite end of the spectrum from Nigeria: it is one of the least-wooded countries in Europe, and its forestry story for the past several years has been net gain, not net loss. As of March 2024, UK total woodland area stood at 3.28 million hectares, covering 14% of UK land area, per the Forestry Commission’s Forestry Statistics 2024 (Forestry Commission, Forestry Statistics 2024). In the 2023–24 reporting year, 20,660 hectares of new woodland were created across the UK, and 1.44 million hectares of UK woodland carried third-party sustainable-management certification as of the same March 2024 snapshot.
No comparable UK net forest-loss-in-hectares figure (parallel to Nigeria’s 240,000 ha) was located in this review — the Forestry Commission’s public statistics report planting, certification, and total stock rather than a net-loss series, likely because UK deforestation is a marginal and tightly regulated activity rather than a major land-use driver. If you need a UK loss figure specifically, the Forestry Commission’s full Forestry Statistics 2024 release is the authoritative source to check directly; the next edition is due September 2025 or later with March 2025 data.
In the US, the Forest Service’s 190,000-acre average annual reforestation figure over its most recent five fiscal years is the clearest available benchmark (USDA Climate Hubs, Patterns of Reforestation Success and Failure) — useful for comparing the scale of a US state or regional programme against the national baseline. Check USDA Forest Service’s annual State of Forests report for the current fiscal year’s figure, since this is refiled yearly.
Certification and satellite-verified impact are increasingly priced into land value and market access. UK woodland’s 1.44 million certified hectares is itself a market signal: certified stock trades on different terms than uncertified stock in UK and EU timber markets.

Farmonaut’s Data-Driven Approach
Farmonaut applies the same satellite-detection, traceability, and monitoring principles covered above to agriculture, forestry, and mining operations directly. The core components:
- Satellite Monitoring: Continuous vegetation-cover and health tracking across farm, forest, and extractive-industry land, accessible through the satellite API.
- AI & Advisory: Automated recommendations for restoration, compliance, and land-use decisions based on cover-change signals.
- Blockchain Traceability: Chain-of-custody tracking for timber, agricultural, and forest-adjacent products via the product traceability suite.
- Carbon Tracking: Sequestration and land-cover-change monitoring through the Carbon Footprinting platform.
- Fleet & Resource Management: Reduces the operational land footprint of mining, forestry, and large-scale agriculture through the Fleet Management product.
Developers integrating these signals directly can start with the API and the full Satellite Weather API developer docs.

FAQ: Technological Solutions to Deforestation
Q1: What are the main technological solutions to deforestation?
Seven stand out: satellite-based forest loss detection, blockchain/digital traceability for timber and forest-risk commodities, AI tree counting and canopy mapping, carbon tracking platforms, precision agroforestry using remote sensing, fleet and resource management to reduce operational land disturbance, and satellite-verified crop loans and insurance that remove the financial incentive to clear land. Detection technology alone has reached up to 99.91% accuracy in test conditions, per a 2024 Frontiers in Forests and Global Change review.
Q2: What are the solutions for deforestation beyond technology?
Land tenure and community forest rights, certification schemes for legally and sustainably harvested timber, and regulatory enforcement capacity. Technology supports all three — it gives communities evidence, gives certifiers an audit trail, and gives regulators an alert pipeline — but none of the three works without the human and institutional side functioning too.
Q3: How accurate is satellite imagery at detecting deforestation?
U-Net deep-learning models reached 99.91% detection accuracy against satellite imagery in a 2024 systematic review published in Frontiers in Forests and Global Change. That is a controlled-test benchmark; real-world accuracy depends on image resolution, cloud cover, and how quickly an alert reaches someone able to act.
Q4: How much forest is Nigeria losing?
Global Forest Watch recorded 240,000 hectares of natural forest loss in Nigeria in 2025. That compares with a historical FAO-sourced rate of 410,100 hectares per year for 2005–2010. Check the Global Forest Watch Nigeria dashboard directly for the current year’s confirmed figure, since it updates on a rolling basis.
Q5: Is deforestation a problem in the UK?
Not at Nigeria’s scale. UK woodland covered 3.28 million hectares (14% of UK land area) as of March 2024, with 20,660 hectares of new woodland created in 2023–24 alone — the UK’s forestry trend is net expansion, not net loss, per the Forestry Commission’s Forestry Statistics 2024.
Q6: What role does Nigeria’s dry season play in deforestation?
No quantified rainfall or dry-season-duration data specific to Nigeria was located from Defra, USGS, or Nigeria’s national meteorological service for this review. Anyone researching this link directly should consult NiMet (Nigerian Meteorological Agency) or FAO climate data portals for current seasonal figures rather than unsourced secondary claims.
Summary, Resources, and Next Steps
The technological solutions to deforestation that hold up under scrutiny share one trait: they produce a verifiable number, not just a claim. Satellite detection at up to 99.91% accuracy, Nigeria’s 240,000 hectares lost in 2025, the UK’s 3.28 million hectares of standing woodland and 1.44 million certified, the US Forest Service’s 190,000-acre annual reforestation average, and FAO’s 6.78-million-hectare global annual reforestation pace against a 900-million-hectare restoration opportunity — these are the figures to check and recheck, not accept once and forget.
The durable method, regardless of what next year’s numbers say: pull the current figure from the primary source (Global Forest Watch for Nigeria, the Forestry Commission for the UK, USDA for the US, FAO for global), confirm the reporting period, and compare at least three years before calling a trend. A single year’s number, in isolation, tells you almost nothing.
For those in agriculture, forestry, or mining seeking data-driven tools to apply this directly:
- Access Farmonaut’s web and mobile platforms here.
- Integrate custom solutions using our API and app suite for resource optimization and compliance.
- Explore crop loan and insurance verification technologies tied to satellite-verified land use.
Recommended Videos & Further Learning
-
Regenerative Agriculture 2025 🌱 Carbon Farming, Soil Health & Climate-Smart Solutions | Farmonaut -
Farmonaut For Oil Palm Plantation
-
How Farmonaut’s Satellite Technology is Revolutionizing Land Use in Agriculture

Detection technology keeps improving, but the constraint that decides whether deforestation actually slows is what happens after the alert fires — enforcement, financing, and market incentive. That is the part every reader has to check locally, using the sources and method above.

 Atur Kuliner
 GlobalQuant
 MDCV UK
 Zerella Group
 Etech Consulting Madagascar
 Vestlandsforsking
 Agritein
 Delicio
 WB Dev
 Sama Premium
 Prochecker
 Tres Valles
 LACOS Geoinformation
 Magrifly
 LatConnect 60
 Blickwinkel
 Agricultural Credit Policy Council
 Marei Nursery
 eKGIS
eKGIS Mostas Tech
