

Reviewed August 2026 against USDA NASS and World Resources Institute data.
A farmland index tracks the change in agricultural land value over time, using a base year set to 100 so later years can be read as a percentage move. In the United States, the closest official version is USDA’s annual farm real estate value series, which put the average value of US farmland at $4,500 per acre and cropland specifically at $6,020 per acre as of the 2026 survey (USDA NASS, Land Values 2026 Summary). This article explains how that index is built, where land is cheapest and most expensive across the US, and how to weigh deforestation and land-use data against a rising price trend before you treat land as a durable asset.
Table of Contents
- Summary: What the Farmland Index Actually Measures
- What Is the Farmland Index?
- US Farmland Values by Region: Comparison Table
- Where Is the Cheapest Farmland in the US?
- Farmland Index Growth Rate: 2022-2026
- Deforestation Data and Land-Value Risk
- How to Read the Index Before You Buy or Invest
- Farmland Value Comparison Calculator
- Satellite Monitoring for Farmland Value and Risk
- Investment and Policy Implications
- Frequently Asked Questions
- Conclusion: Using the Index as a Starting Point, Not an Answer
- Jump to the calculator
Summary: What the Farmland Index Actually Measures
The US farmland index — USDA’s farm real estate value series — measures the average dollar value of an acre of agricultural land, tracked annually since the 1970s and reported each July. It is not a single traded number like a stock index; it is survey-based, drawn from land value reports across all 50 states, and it separates cropland, pastureland, and total farm real estate into distinct figures. As of the July 2026 release, US farm real estate averaged $4,500/acre, cropland averaged $6,020/acre, and pastureland averaged $2,000/acre (USDA NASS, Land Values 2026 Summary). Cumulative growth in farm real estate value from 2020 to 2026 reached 44%, though the annual growth rate has been slowing each year since 2022.
This matters for three groups searching for this information: people evaluating a farmland index fund as an inflation hedge or diversification play, people asking where the cheapest farmland in the US actually is on a per-acre basis, and people trying to understand what a farmland index number means before citing it in an investment decision. This article answers all three using USDA’s published figures, plus deforestation-linked land-use data from the World Resources Institute for readers weighing long-term land risk.
Key Takeaway Highlights
- ✔ US cropland averaged $6,020/acre and total farm real estate averaged $4,500/acre in the USDA NASS 2026 Land Values report.
- 📊 US farm real estate values grew 44% cumulatively from 2020 to 2026, but annual growth has slowed from 11.7% (2022) to 4.3% (2025).
- 💰 The cheapest US farmland by region is not published as a single ranked list by USDA; pastureland at $2,000/acre nationally is the lower bound, with wide regional variation below and above it.
- 🌎 Farmland index funds (REITs, ETFs) track land value trends like these but layer on fund-level fees, liquidity terms, and leverage that the underlying index does not reflect.
- 🌳 Deforestation-linked land conversion — 172 million hectares of permanent-agriculture forest loss globally since 2001 — is a land-use risk factor separate from price, and worth checking before treating rising land value as risk-free.
What Is the Farmland Index?
A farmland index aggregates land value data into a single trackable series, usually indexed to a base year of 100. USDA does not publish its farm real estate values pre-indexed this way — it reports raw per-acre dollar figures — but the same data can be converted into an index by dividing any year’s value by a chosen base year and multiplying by 100. The components USDA tracks each year include:
- ✔ Total farm real estate value: the blended average across cropland, pasture, and farm buildings, per acre.
- 📊 Cropland value: land actively used for row crops, reported separately because it commands a premium over pasture.
- ⚠ Pastureland value: grazing land, the lowest-value category nationally.
- ✔ Regional breakdowns: values by USDA production region and state, since national averages mask large swings.
- 📊 Year-over-year percentage change: the growth rate figure most often cited as “the farmland index.”
Separately, private index products exist — most notably the NCREIF Farmland Index, which tracks returns on institutionally-owned farmland held by pension funds and similar investors. That data sits behind an institutional data portal and is not part of USDA’s public release; if you need NCREIF’s quarterly return figures specifically, request access through NCREIF’s member portal directly, since no public mirror of those figures currently exists.

Why the Farmland Index Is Watched
- 🌎 Benchmark for land purchases: buyers and appraisers compare a specific parcel’s asking price against the regional average to judge if it’s fairly priced.
- 💹 Signal for farmland-backed investment products: REITs and funds holding US farmland reference these values in their own reporting.
- 📈 Input for lenders: agricultural lenders use land value trends to set loan-to-value ratios on farm mortgages.
- 🌱 Cross-check against land-use risk: a rising index in a region with high deforestation-linked conversion may reflect unsustainable expansion rather than durable value.
US Farmland Values by Region: Comparison Table
USDA’s regional breakdown is where the real variation shows up — the national average of $4,500/acre hides a gap of more than $12,000/acre between the highest- and lowest-value regions. The two highest state-level averages in the 2026 report were Connecticut at $14,600/acre and California at $14,100/acre, both driven by high-value specialty crop and horticultural land rather than row-crop acreage.
| Land Category | 2026 US Average Value | What Drives It | Source |
|---|---|---|---|
| Cropland (national average) | $6,020/acre | Row-crop productivity, irrigation access, proximity to grain markets | USDA NASS, July 2026 |
| Total farm real estate (national average) | $4,500/acre | Blend of cropland, pasture, and farm structures | USDA NASS, July 2026 |
| Pastureland (national average) | $2,000/acre | Grazing capacity, lower input requirements, lower per-acre revenue | USDA NASS, July 2026 |
| Connecticut (highest regional value) | $14,600/acre | Limited supply, proximity to Northeast urban markets, specialty use | USDA NASS, July 2026 |
| California (second-highest regional value) | $14,100/acre | High-value fruit, nut, and vegetable production; irrigation infrastructure | USDA NASS, July 2026 |
For the full state-by-state and USDA production-region tables, the primary source is USDA NASS’s annual Land Values report, published each July: USDA NASS, Land Values 2026 Summary. The next edition is expected in July 2027 — check that release for updated per-acre figures rather than relying on the 2026 numbers past that point.
Where Is the Cheapest Farmland in the US?
USDA does not publish a ranked “cheapest state” list — it reports averages by state and region, and the lowest values consistently fall in the Mountain and Great Plains regions where land is dominated by extensive grazing rather than irrigated row crops. Nationally, pastureland at $2,000/acre is the closest published figure to a floor, since it is the lowest of USDA’s three headline categories and is concentrated in states with large rangeland acreage rather than the high-value cropland states like Connecticut or California.
If you’re comparing specific states or counties rather than the national pasture average, the method is straightforward and repeatable every year:
- Open the current-year USDA NASS Land Values report (USDA NASS, Land Values 2026 Summary) and go to the state-level table.
- Sort by “all farmland” value per acre — the Mountain region states (Montana, Wyoming, New Mexico) and parts of the Great Plains typically post the lowest per-acre averages nationally, well below the $2,000/acre pastureland floor in some counties.
- Cross-check the specific county with USDA NASS’s Quick Stats tool, since state averages still blend cropland and pasture and can mask cheaper pockets.
- Verify local land-use and water-rights restrictions before treating a low per-acre price as a bargain — cheap land is frequently cheap because of limited irrigation access or restricted development rights.
This is also the honest answer to why no single “cheapest farmland” dollar figure appears in this article: USDA’s public release is state- and region-level, not a per-county ranking, so naming an exact cheapest county would mean fabricating precision the source data doesn’t provide. Use the method above against the current report for a defensible number specific to your search.

Farmland Index Growth Rate: 2022-2026
The annual growth rate is the number most often quoted as “the farmland index is up X%.” USDA’s year-over-year farm real estate value growth has decelerated every year since 2022: 11.7% in 2022, 6.7% in 2023, 5.0% in 2024, and 4.3% in 2025 (USDA NASS, Land Values 2026 Summary). That deceleration matters more than the cumulative 44% figure for anyone trying to time a purchase or judge whether the asset class is still appreciating at the pace it was three years ago.
The pattern reads as a market cooling from a post-2020 surge rather than reversing. Farm real estate values are still rising in absolute terms — the cumulative 44% gain since 2020 confirms that — but each additional year of gains has been smaller than the last. Anyone using a farmland index fund as an inflation hedge should treat the 2022 rate as the outlier and the 2024-2025 rates as the more representative recent baseline, since a fund’s forward returns will track the current growth regime, not the 2022 spike.
Common Mistake Box
Quoting the 44% cumulative gain (2020-2026) as if it were the current annual growth rate. It is not — the most recent year on record (2025) grew 4.3%, a much smaller number that better reflects what a farmland investment made today is likely to earn going forward.
Deforestation Data and Land-Value Risk
Rising land values in a region don’t automatically mean sustainable land use — in some parts of the world, farmland expansion is the direct driver of forest loss, and that conversion carries its own risk profile for investors and buyers of agricultural land or land-linked commodities. The World Resources Institute’s global forest loss tracking attributes 172 million hectares of permanent-agriculture-driven tree cover loss worldwide between 2001 and 2025 (World Resources Institute, Forest Loss Drivers). The regional concentration is stark:
- ⚠ Latin America: permanent agriculture accounts for 72% of forest loss, driven substantially by pasture and soy expansion.
- ⚠ Southeast Asia: permanent agriculture accounts for 65% of forest loss.
- 📉 Tropical primary rainforest overall: permanent land-use change accounts for 60% of loss, versus shifting cultivation or wildfire.
- 🌱 Bolivia specifically: 55% of forest loss traces to permanent agriculture, primarily pasture and soy expansion.
For US and European investors, this data is relevant less as a direct US land-value input and more as a due-diligence layer for any farmland-linked fund with international exposure, or for commodity supply chains (soy, palm, beef) that source from these regions. A farmland index fund that includes emerging-market land exposure should be checked against exactly this kind of forest-loss data before being treated as a clean ESG-compliant holding.

Checklist: Screening Land or a Land Fund for Conversion Risk
- 👍 Check whether the fund or parcel’s region appears in WRI’s high-conversion list (Latin America, Southeast Asia) before assuming price appreciation reflects productivity gains rather than land conversion.
- 📉 For US-only holdings, this risk is materially lower — USDA’s tracked farmland values reflect established agricultural land, not new forest conversion.
- ✔ Ask any fund manager directly what share of underlying acreage was converted from forest or native land cover in the last five years.
- 🌱 Use satellite-based land-cover monitoring (carbon footprint and land-cover tracking) to verify a specific parcel’s history independent of a seller’s disclosure.
How to Read the Index Before You Buy or Invest
The method below stays valid regardless of which year’s numbers you’re looking at — it’s the durable part of this article, and it applies whether USDA’s next report shows $4,500/acre, $5,000/acre, or something lower.
- Pull the current-year USDA NASS Land Values report. It is released every July; treat any figure older than 18 months as stale for a purchase decision.
- Separate cropland, pasture, and total farm real estate. A “farmland index” quote that doesn’t specify which category it means is not precise enough to act on.
- Compare the year-over-year growth rate, not just the level. A high per-acre value with a slowing growth rate (like the 4.3% posted in 2025) signals a maturing market, not a fast-appreciating one.
- Check the regional table against the national average. National figures blend $14,600/acre Connecticut land with much lower Mountain-region land — always compare like-for-like regions.
- Layer in land-use risk data for any exposure outside established US farmland, using WRI’s forest-loss tracking as a screen.
- If evaluating a fund rather than direct land, add the fund’s fee load, redemption terms, and leverage on top of the underlying index — the index measures land value, not fund-level investor returns.

Farmland Value Comparison Calculator
Compare a specific parcel’s asking price against the USDA national averages for its land category to see the dollar and percentage gap.
Assumes the USDA NASS 2026 national average for the selected category applies uniformly; it does not account for regional variation (e.g., California or Connecticut values run more than double the national average). Excludes closing costs, water rights, and improvements. Re-run with the following year’s USDA figures once published each July.
Satellite Monitoring for Farmland Value and Risk
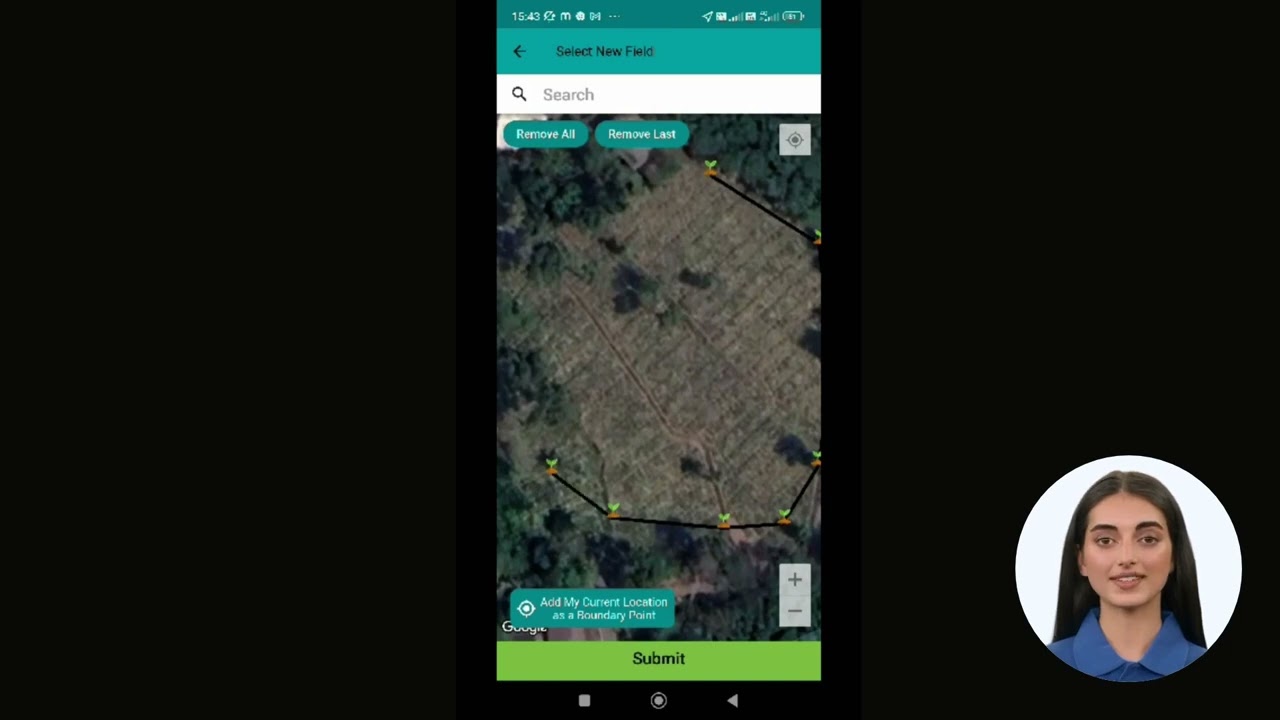
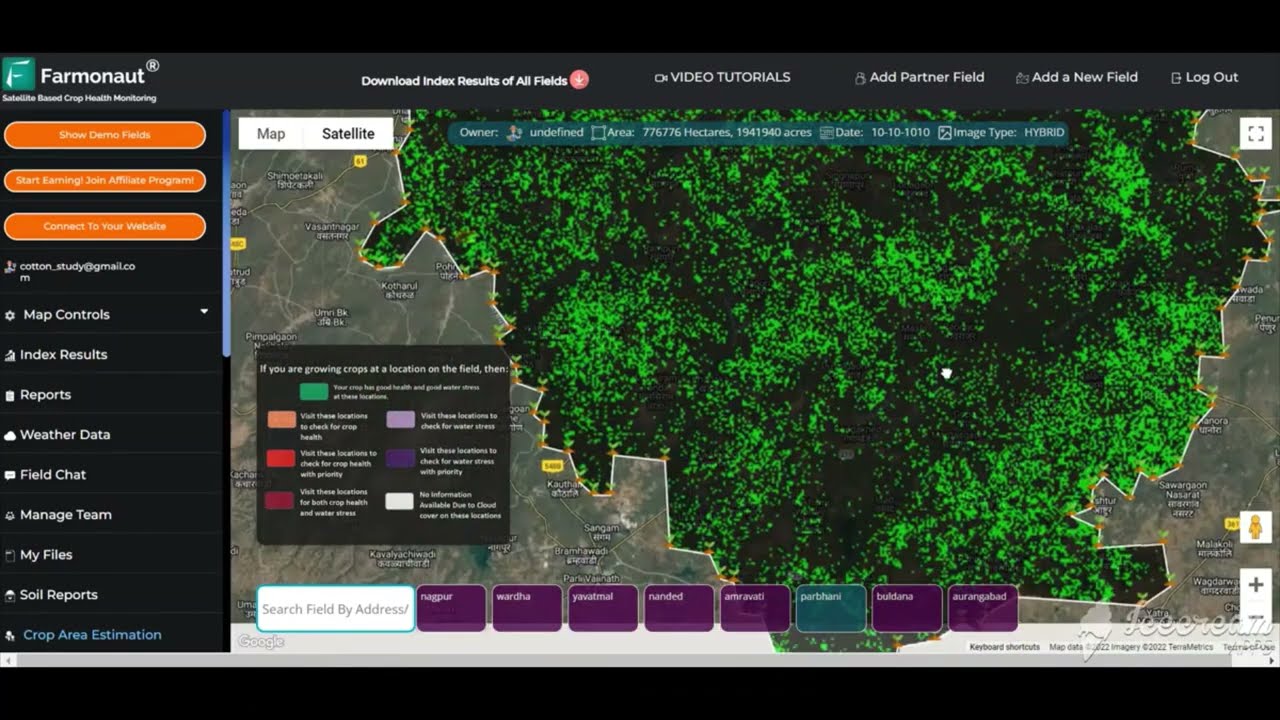
Land value assessments are only as good as the underlying data on soil condition, land use, and productivity — and that's where satellite monitoring closes a gap USDA's price surveys don't cover. Farmonaut provides remote sensing tools that let buyers, lenders, and landowners verify a parcel's actual condition rather than relying on price alone:
- ✔ Satellite-Based Monitoring
- Tracks vegetation health, soil moisture, and land degradation on a specific parcel over time.
- Supports fleet and resource management for operations managing multiple parcels. - 📊 Jeevn AI Advisory System
- Delivers weather forecasts and management recommendations using satellite data, relevant to both working farms and land under evaluation for purchase. - 🔗 Blockchain-Based Traceability
- Verifies the origin and handling history of agricultural products, relevant to buyers requiring supply-chain documentation. - 📉 Environmental Impact Monitoring
- Carbon footprint tracking for compliance and land-use verification, useful when screening a parcel or fund for the conversion risk described above. - 💹 Financial Access
- Satellite-based verification for loans and insurance, which lenders can use to support land-value assessments alongside USDA data.
These tools are available through Farmonaut's large-scale farm management platform, mobile apps, and API (API access | developer docs), and its traceability system gives supply-chain-level verification for exporters and buyers who need it.



Pro Tip Box
Before relying on a state or regional average from USDA's annual report, pull satellite-based land-cover history for the specific parcel. A county average can mask a parcel with degraded soil or a parcel with above-average productivity — the average tells you the market, not the asset.

Farmonaut Subscription Plans
Investment and Policy Implications
The farmland index feeds directly into decisions made by several groups, each reading the same USDA numbers for a different purpose:
- ✔ Fund investors comparing a farmland index fund's stated returns against the underlying USDA growth rate (4.3% in 2025) to judge whether fund fees are eating into the land-value gain.
- ✔ Direct buyers using regional averages (like the $14,100/acre California figure) as a starting negotiation benchmark.
- ✔ Lenders setting loan-to-value ratios on farm mortgages against current per-acre values.
- 📈 Policymakers and researchers tracking whether land-value growth is outpacing farm income growth, a gap that raises questions about affordability for new entrants to farming.
Investor Note Box
US farm real estate values grew 44% cumulatively from 2020 to 2026, but the annual rate has fallen every year since 2022 (11.7% to 4.3%). A farmland index fund's forward return is more likely to track the recent 4-5% range than the earlier double-digit years — price any allocation off the trend, not the peak.
Data Not Yet Public: What to Check Yourself
A few figures commonly asked about alongside the farmland index are not available in USDA's public Land Values release and should not be estimated:
- NCREIF Farmland Index quarterly total returns — request directly through NCREIF's institutional data portal.
- Current-year corn, soybean, and wheat prices — USDA's Agricultural Marketing Service publishes these weekly; check AMS directly for the latest print rather than an annual average.
- Farmland REIT performance (e.g., publicly traded agricultural REITs) — pull the company's most recent SEC filing (10-K or 10-Q) for audited figures rather than a secondary summary.
- Average cash rent for cropland by state — USDA NASS publishes this separately from the Land Values report; check the county-level cash rent survey for your target region.
Frequently Asked Questions
What is the current US farmland index value?
USDA NASS reported US farm real estate averaging $4,500/acre and cropland averaging $6,020/acre in its July 2026 Land Values report. These are national averages; state and regional values range from roughly $2,000/acre (national pastureland average) up to $14,600/acre (Connecticut, the highest state average in the 2026 report). The next update is expected in July 2027.
What is a farmland index fund?
A farmland index fund is an investment vehicle (REIT, ETF, or private fund) that holds US farmland or farmland-linked assets and aims to track land value trends like those USDA reports. The fund's return depends on the underlying land value trend plus the fund's own fee structure, leverage, and liquidity terms — none of which are captured by USDA's land value figures alone, so compare the two separately before evaluating a fund's stated performance.
Where is the cheapest farmland in the US?
USDA doesn't publish a ranked cheapest-state or cheapest-county list. Nationally, pastureland at $2,000/acre is the lowest of USDA's three headline categories, and it's concentrated in Mountain and Great Plains states with large rangeland acreage. For a specific number, pull the current USDA NASS Land Values report's state table and cross-check the county with USDA's Quick Stats tool — see the step-by-step method above.
How does deforestation data relate to farmland value?
They're separate metrics, but land converted from forest to agriculture carries a different risk profile than established farmland. Globally, permanent agriculture drove 172 million hectares of forest loss between 2001 and 2025, concentrated in Latin America (72% of forest loss) and Southeast Asia (65%), per the World Resources Institute. This is most relevant to farmland funds with international exposure or supply chains sourcing from those regions — US-only farmland values are not materially affected by this dynamic.
How can I monitor a specific parcel's condition before buying?
Visit the Farmonaut web platform or download the mobile apps for Android and iOS. For integration into a larger due-diligence workflow, the API and developer docs provide satellite-based land-cover and vegetation data you can attach to a specific parcel record.
Conclusion: Using the Index as a Starting Point, Not an Answer
The farmland index — in practice, USDA's annual farm real estate value survey — gives a defensible national and regional benchmark: $4,500/acre for total farm real estate, $6,020/acre for cropland, and $2,000/acre for pasture as of the July 2026 report, with growth that has slowed from 11.7% in 2022 to 4.3% in 2025. That's a solid starting point for a purchase negotiation, a fund comparison, or a lending decision, but it's a national average built from state-level surveys — not a per-parcel appraisal.
Use the method in this article every year the report updates: pull the current USDA release, separate the land category you care about, check the growth rate rather than just the level, and — if there's any international or land-conversion exposure — screen it against forest-loss data before treating price appreciation as evidence of sound land use. That process holds regardless of what number the July 2027 report eventually shows.

 Godrej Agrovet
 Hayleys Agriculture
 Linx Agritech
 Adinet
 Save Your Soils
 GalaxEye Space
 Grandstream Algérie
 XOS Realty
 Geospatial Lab Africa
 Agro La Gándara
 HIPSAC
 ZOL Zimbabwe
 Juligerm
 AdBio
AdBio MISE Maroc
 NWNS
NWNS Red August Group
 Farm Inc
 WeMe Global
 Agrotoken
 Blue BearX
 Insignito
 DnCubed
 Indosistim Teknologi
 Liquify Digital
 CU Foods
 BeyondTech Global
 Rouge VC
 AgroRisk
 Oath Inc
 Esri North East Africa
 MDCV UK
 Etech Consulting Madagascar
 Vestlandsforsking
 WB Dev
 Sama Premium
 Tres Valles
 Blickwinkel
 Agricultural Credit Policy Council
 eKGIS
eKGIS Mostas Tech
 Andex
Andex Deluxe Conseil
 WICO
WICO Chimera Innovation
 SkyHarvest
 Teledarbas
 Exurbia Geospatial
 FieldZero
