

Reviewed August 2026 against USDA NASS and the Economics Observatory’s tracking of the 2025 tariff framework.
Try it: Run your own numbers →
Table of Contents
- Summary: What “New Agriculture Policy” Actually Means Right Now
- The 2025 Tariff Framework: What Changed and Who Pays
- 2024 US Crop Data: The Baseline Every Policy Debate Cites
- A Note on “Agriculture Policy in India” Searches
- Where Technology Fits Into US Farm Policy
- Market Access, Traceability & Direct Sales
- Sustainability, Soil Health & Climate Programs
- Crop Insurance, Loans & Risk Management
- Tool: Tariff Exposure Estimator for a Crop Sale
- Policy Comparison Table: Trade, Support & Technology
- How Farmonaut Fits Into Policy Compliance & Verification
- FAQ
- Conclusion: How to Track What Changes Next
Summary: What “New Agriculture Policy” Actually Means Right Now
There is no single “new agriculture policy” document to read — the phrase covers two distinct, moving stories in the United States. The first is trade policy: an executive order effective July 31, 2025 set a 10% base tariff rate on US imports under a reciprocal framework, with rates up to 50% for countries running trade surpluses against the US, and agricultural exporters are directly exposed to the retaliation this triggers abroad. The second is the ordinary cycle of farm-bill programs, crop insurance rules, and USDA production reporting that shifts every year regardless of headlines. If you searched for “new agriculture policy” expecting one clean answer, the honest one is: check the tariff schedule for your commodity, then check USDA NASS for the acreage and production numbers that determine how much that tariff actually costs your sector.
This page tracks both threads with sourced figures — not projections dressed up as facts — and gives you a way to verify the current numbers yourself, since tariff schedules and crop reports both update on fixed cycles.
The 2025 Tariff Framework: What Changed and Who Pays
The most concrete recent shift in US agriculture policy is trade policy, not a farm program. Under an executive order that took effect July 31, 2025, the US applied a reciprocal tariff structure: a 10% base rate applied broadly, rising to as much as 50% for trading partners the administration identified as running persistent surpluses against the US. This is documented by the Economics Observatory’s analysis of how the tariffs are reshaping global agricultural trade, available at economicsobservatory.com.
Why this matters more than a subsidy line item: US row-crop exporters — corn, soybean, cotton, and wheat growers — sell into markets that can retaliate against the base tariff with their own duties on US goods. A 50% ceiling rate is not evenly applied; it is targeted at specific trade-surplus countries, so the actual burden on any single US farm depends entirely on where their crop or the inputs behind it cross a border. If you are trying to price in trade risk for the coming marketing year, the framework itself — not a single average rate — is the number to track, because it determines the ceiling your buyers or suppliers could face.
This is the kind of detail an AI-generated summary tends to flatten into “tariffs went up.” They didn’t go up uniformly — they went up on a sliding scale tied to bilateral trade balances, and that scale is what determines whether your specific export market is exposed at 10% or 50%. The Economics Observatory source above breaks down the mechanism; USDA’s own trade data (via NASS, linked below) is where you’d check exposure by commodity as new figures are published.
How to Verify This Yourself
- Check the current tariff schedule against your commodity’s HS code before assuming a rate.
- Cross-reference USDA’s Economic Research Service trade balance reports for the specific partner country your crop ships to.
- Re-check quarterly — reciprocal rates are explicitly tied to bilateral trade balances, which shift with each trade data release.
- Try it: Run your own numbers
2024 US Crop Data: The Baseline Every Policy Debate Cites
Any conversation about “new agriculture policy” that doesn’t start from actual production numbers is speculation. Here is the verified 2024 baseline from USDA’s National Agricultural Statistics Service (NASS), which is the authority both trade negotiators and commodity groups cite when arguing over policy impact:
- Corn: 91.5 million acres planted in 2024, per USDA NASS Crop Progress & Condition data (nass.usda.gov).
- Soybeans: 4.37 billion bushels produced in 2024, per the USDA NASS 2024 Crop Production Annual Summary.
- Cotton: 14.4 million bales (480-lb bales) produced in 2024, same USDA NASS annual summary.
- Wheat: 47.2 million acres planted in 2024, same USDA NASS annual summary.
The annual summary for the last three figures is published by USDA and archived at esmis.nal.usda.gov. These are 2024 crop-year figures — USDA NASS publishes updated acreage and production estimates on a fixed annual and in-season cycle, so a 2025 or 2026 crop-year summary will supersede these numbers once released. Bookmark the NASS Charts and Maps page linked above; it is the same URL structure USDA uses each year, just with the year updated.
Why This Baseline Matters for Policy Reading
Corn’s 91.5 million planted acres and wheat’s 47.2 million planted acres are not just trivia — they are the denominator for every tariff-exposure claim you’ll read. A 50% tariff ceiling hitting a country that buys a small share of a 4.37-billion-bushel soybean crop moves markets differently than the same rate hitting a major buyer of the 14.4-million-bale cotton crop. Without the acreage and production baseline, a tariff headline is unfalsifiable. With it, you can at least scope how much of the crop is plausibly exposed.
A Note on “Agriculture Policy in India” Searches
If you arrived here searching for India’s agriculture policy specifically, this page focuses on US trade and production policy — the data above (USDA NASS, the 2025 tariff framework) is US-specific and won’t answer questions about Indian farm law, MSP mechanisms, or state-level Indian schemes. Farmonaut covers that ground in a dedicated article: Agriculture Policy of India: Strategies & Creation. That page tracks India’s policy reforms directly rather than as a US-market comparison, and is the more useful destination if India is what you’re researching.
Where Technology Fits Into US Farm Policy
US farm policy increasingly assumes digital infrastructure is already in the field — crop insurance claim verification, conservation program compliance, and trade documentation all lean on remote sensing and data platforms rather than paper records. This isn’t a future promise; it’s how claims and compliance checks are processed today at scale, because manual field verification for millions of acres isn’t feasible on USDA’s or an insurer’s timeline.
- Satellite-based crop monitoring: Multispectral imagery tracks vegetation health, soil moisture, and stress signals across a field without a site visit, which is what makes remote insurance and conservation verification possible at national scale.
- Traceability infrastructure: Buyers — particularly export buyers subject to the tariff exposure described above — increasingly require documented chain-of-custody. Farmonaut’s blockchain-based traceability platform addresses this directly: Blockchain Traceability.
- API access for developers and analysts: Agricultural researchers and platform builders can pull satellite imagery, weather, and field analytics directly via Farmonaut’s API, documented at the API Developer Docs.

For large operations managing acreage across multiple parcels, the administrative layer matters as much as the sensor data. Farmonaut’s Large Scale Farm Management Portal consolidates monitoring across an operation instead of requiring a separate check per field.





Market Access, Traceability & Direct Sales
Trade-policy shifts like the 2025 tariff framework put a premium on market diversification and documentation. Two structural responses matter for producers regardless of what the tariff schedule does next:
- Traceability as a market-access requirement: Export buyers navigating tariff exposure often demand documented origin and handling records before committing to a purchase contract. This has shifted traceability from a marketing nicety to a deal prerequisite in several export categories.
- Supply chain platform comparison: Farmonaut’s overview of traceability platforms compares the leading options: Top 7 Supply Chain Traceability Platforms & Solutions.


Sustainability, Soil Health & Climate Programs
US conservation programs — administered through USDA’s Farm Service Agency and Natural Resources Conservation Service — pay for practices like cover cropping, reduced tillage, and precision nutrient management. Enrollment figures and payment rates by program (EQIP, CSP, CRP) change with each farm-bill cycle and annual appropriations, so rather than quoting a figure likely to be out of date by the time you read this, the reliable method is to check USDA NASS’s own reporting cadence — the same Charts and Maps resource cited above for crop data also tracks conservation practice adoption where published.
- Carbon footprint tracking: Operations documenting emissions reductions for voluntary carbon markets or buyer requirements can use Farmonaut’s Carbon Footprinting Platform to quantify and report reductions.
- Fleet and input optimization: Reducing fuel and input passes across a field is one of the more measurable levers a single operation controls regardless of policy timing — see Fleet Management Tools.

Crop Insurance, Loans & Risk Management
Federal crop insurance, administered through USDA’s Risk Management Agency, uses satellite and weather data increasingly for claim verification rather than solely site visits — a shift that speeds payout timelines when a claim is straightforward. Coverage levels, premium subsidies, and eligible practices are set by the current farm bill and its annual implementing rules; because these are legislated and re-appropriated on a cycle rather than fixed permanently, check RMA’s current program handbook for your state and crop before assuming a coverage level applies.
- Satellite-based verification for loans and insurance: Farmonaut’s platform supports satellite-based land and crop verification, which can streamline documentation for lenders and insurers: Crop Loan and Insurance.
Tool: Tariff Exposure Estimator for a Crop Sale
Use the figures you already have — bushels or bales sold, contract price, and the tariff tier that applies to your buyer’s country — to estimate the dollar exposure a reciprocal tariff could add to an export sale, using the 10%–50% range set by the July 2025 framework as your bounds.
Run your own numbers
Assumptions: this estimator applies a flat rate to the share of a sale you designate as tariff-exposed; it does not model currency effects, buyer-side pass-through, subsidy offsets, or exemptions specific to a trade agreement. The 10%/25%/50% options reflect the base and ceiling rates in the July 2025 reciprocal tariff framework — confirm the exact rate for your buyer’s country before relying on this for a contract decision.
Policy Comparison Table: Trade, Support & Technology
| Policy Area | Current Mechanism | Key Figure | Source & Vintage | How to Get a Fresher Number |
|---|---|---|---|---|
| Import tariffs | Reciprocal tariff framework, base + surplus-tier ceiling | 10% base, up to 50% ceiling | Executive Order, effective July 31, 2025 | Check current federal tariff schedule by HS code and partner country |
| Corn acreage | Annual USDA NASS planted-acreage survey | 91.5 million acres planted | USDA NASS, 2024 crop year | USDA NASS Charts & Maps, updated each crop year |
| Wheat acreage | Annual USDA NASS planted-acreage survey | 47.2 million acres planted | USDA NASS, 2024 crop year | USDA NASS Crop Production Annual Summary |
| Soybean production | Annual USDA NASS production survey | 4.37 billion bushels | USDA NASS, 2024 crop year | USDA NASS Crop Production Annual Summary |
| Cotton production | Annual USDA NASS production survey | 14.4 million bales (480-lb) | USDA NASS, 2024 crop year | USDA NASS Crop Production Annual Summary |
| Crop insurance verification | USDA RMA claims, increasingly satellite-supported | Not centrally published by rate; varies by program year | USDA RMA program handbooks | Check current RMA handbook for your state and crop |
| Conservation program payments | EQIP/CSP/CRP, set by farm-bill appropriations cycle | Not fixed; reset each appropriations cycle | USDA FSA/NRCS program rules | Check current FSA program rates for your county |
Two rows above are marked “not centrally published” deliberately rather than filled with an invented figure — USDA’s RMA claim-processing rates and conservation payment schedules are not summarized in the research used for this article, and inventing a number for either would be worse than admitting the gap. The method column tells you exactly where to look instead.
Farmonaut Subscription Plans
Farmonaut offers scalable subscription tiers for individual producers, cooperatives, enterprises, and institutions — covering satellite crop monitoring, resource management, carbon tracking, and supply chain traceability.
How Farmonaut Fits Into Policy Compliance & Verification
As an agritech company built around satellite-based farm management, Farmonaut’s tools map directly onto the compliance and documentation demands that trade and insurance policy now assume are in place:
- Real-time crop health monitoring: Multispectral imagery for vegetation health, soil moisture, and pest/disease risk — the same data class insurers and conservation programs increasingly accept for remote verification.
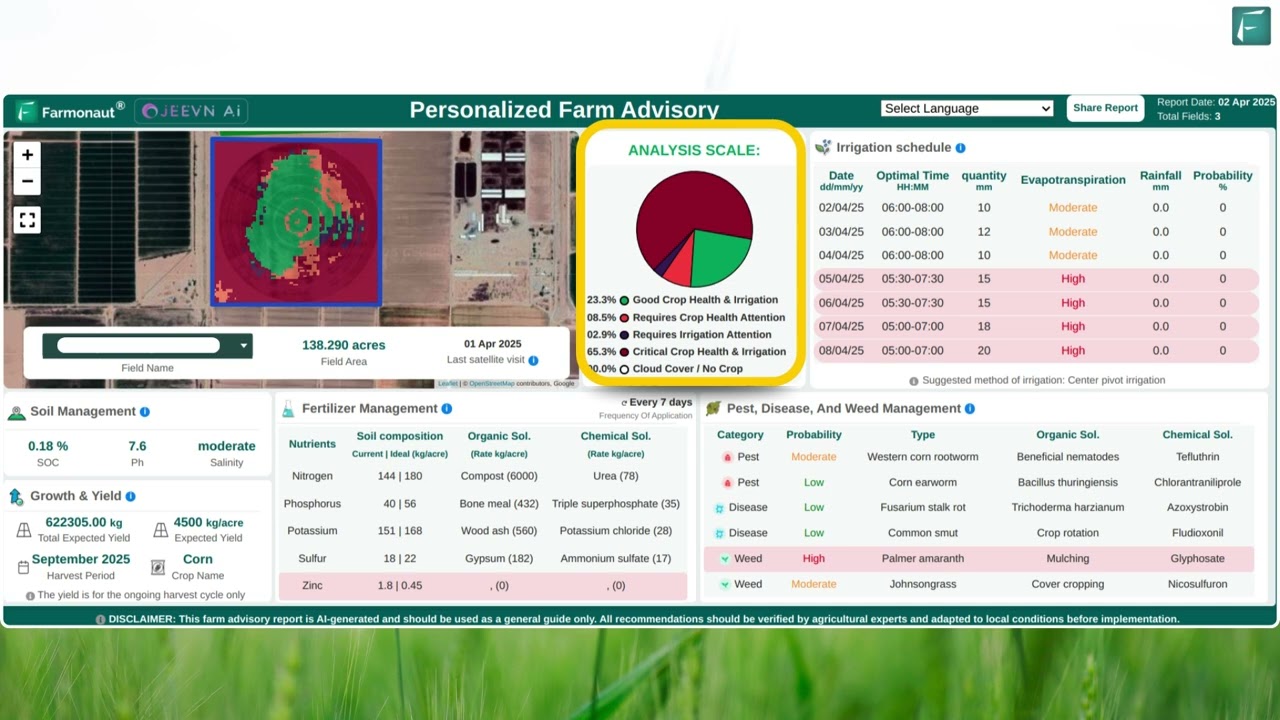
- Jeevn AI Advisory: Personalized, weather-backed crop management guidance for operations of any size.
- Blockchain Traceability: Documented farm-to-market chain of custody, relevant for export buyers navigating the tariff exposure discussed above.
- Resource & Fleet Management: Tracking logistical assets and input use to reduce operating costs.
- Carbon Footprinting: Quantifying emissions reductions for voluntary markets or buyer sustainability requirements.
These tools don’t require a specific policy outcome to be useful — they hold up whether the tariff ceiling moves, a new farm bill resets conservation payments, or the current framework simply continues, because they document what happened on your operation regardless of what Washington does next.
FAQ
-
What is the current US tariff rate on agricultural trade?
Under the reciprocal tariff framework effective July 31, 2025, the base rate is 10%, rising to as much as 50% for trading partners identified as running a trade surplus against the US. The rate that applies to any specific shipment depends on the partner country and commodity — check the current schedule rather than assuming a flat rate. -
How much corn, wheat, soybeans, and cotton did the US produce in the most recent full crop year on record?
For the 2024 crop year, USDA NASS reported 91.5 million acres of corn planted, 47.2 million acres of wheat planted, 4.37 billion bushels of soybeans produced, and 14.4 million bales of cotton produced. USDA NASS publishes updated figures for each subsequent crop year on the same reporting cycle. -
Is this page about India’s agriculture policy?
No — this page tracks US trade and production policy. For India-specific coverage, see Agriculture Policy of India: Strategies & Creation. -
Does satellite data actually get used in crop insurance claims?
USDA’s Risk Management Agency and private insurers increasingly incorporate remote sensing and weather data into claim verification, which can speed processing versus site-visit-only claims. Coverage rules and payout levels are set by the current farm bill and its annual implementing rules, so check RMA’s program handbook for your state and crop for the current terms. -
Where can I verify these figures myself?
USDA NASS’s Charts and Maps resource and annual Crop Production Summary are the primary sources for acreage and production data; the Economics Observatory’s tariff analysis is the source for the 2025 trade framework. Both are linked above with their exact publication dates. -
What is Farmonaut’s role in this?
Farmonaut provides satellite-based crop monitoring, AI advisory, traceability, and resource management tools that support the documentation and verification demands of current trade, insurance, and conservation policy — accessible via Web, Android, iOS, or API.






Further reading:
Conclusion: How to Track What Changes Next
US agriculture policy right now is really two separate clocks running at different speeds. The tariff framework set in July 2025 can shift with each new trade-balance calculation between the US and a given partner country — that’s a diplomatic and economic variable, not an annual one, so treat the 10%–50% range as a structure to re-check rather than a fixed number. USDA NASS’s crop production and acreage data, by contrast, updates on a predictable annual cycle — the 91.5 million corn acres, 47.2 million wheat acres, 4.37 billion soybean bushels, and 14.4 million cotton bales cited here are the 2024 baseline, and the same NASS pages will carry the next crop year’s figures on schedule.
The durable habit, regardless of which number moves next: before acting on a tariff rate or a production claim you read anywhere — including this page — trace it back to USDA NASS for production data or to the current federal tariff schedule for trade data, and check the publication date against today’s date. That’s the whole method, and it doesn’t expire.
For satellite-based tools that document your operation’s compliance and output regardless of which policy cycle is in motion, explore Farmonaut’s app, API, or subscription plans.

 WICO
WICO Gen Chayat
 Chimera Innovation
 Hiteshi Infotech
 Clubhouse OS
 SkyHarvest
 Polaris Digitech
 Teledarbas
 Wild Oak Farm
 SFX
SFX BACF Africa
 Doodlakine
 Exurbia Geospatial
 FieldZero
 Indico Company
